

Abstract
Attention is often extolled for its selective neural properties. Yet, when powerfully captured by a salient unexpected event, attention can give rise to a broad cascade of systemic effects for evaluating and adaptively responding to the event. Using graph theory analysis combined with fMRI, we show here that the extensive psychophysiological and cognitive changes associated with such attention capture are related to large-scale distributed changes in the brain’s functional connectivity. Novel task-irrelevant “oddball” stimuli presented to subjects during the performance of a target-search task triggered an increase in internetwork functional connectivity that degraded the brain’s network modularity, thereby facilitating the integration of information. Furthermore, this phenomenon habituated with repeated oddball presentations, mirroring the behavior. These functional network connectivity changes are remarkably consistent with those previously obtained with conscious target perception, thus raising the possibility that large-scale internetwork connectivity changes triggered by attentional capture and awareness rely on common neural network dynamics.
NEW & NOTEWORTHY The selective properties of attention have been extensively studied. There are some circumstances in which attention can have widespread and systemic effects, however, such as when it is captured by an unexpected, salient stimulus or event. How are such effects propagated in the human brain? Using graph theory analysis of fMRI data, we show here that salient task-irrelevant events produced a global increase in the functional integration of the brain’s neural networks.
Keywords: attention capture, brain networks, functional connectivity analysis, graph theory, oddball
INTRODUCTION
Novel, salient stimuli in the environment can powerfully grab attention and trigger a cascade of behavioral and physiological changes that ready the organism for an appropriate response (Pavlov 1927; Sokolov 1963). Such stimulus-driven “orienting response” is often accompanied with a wide array of physiological changes, including sympathetic nervous system activation, increased arousal, pupillary dilation, and galvanic skin response (Beatty 1982; Kahneman and Beatty 1966; Tracy et al. 2000). The triggering events can also mobilize numerous cognitive processes, including (but not limited to) the orienting of attention, event evaluation, and planning of appropriate behavioral responses (Han and Marois 2014; Kahneman 1973; Sara and Bouret 2012). All together, these processes prepare an individual to interact with the attention-grabbing event in accordance with its behavioral meaning and value. As such, the cumulative response to unexpected or sudden events in the environment can be considered a global one, recruiting aspects of both body and mind.
In contrast to the global effects resulting from the capture of attention by a surprise stimulus, neurobiological studies of attention have mostly focused on attention’s selective goal-directed neural properties (Chawla et al. 1999; Corbetta and Shulman 2002; Desimone and Duncan 1995; Kastner et al. 1999; Reynolds et al. 1999; Reynolds and Chelazzi 2004). Such attentional focus can, however, also trigger a cascade of neurophysiological changes that propagate across brain regions, for example via oscillatory mechanisms (Fries et al. 2001; Womelsdorf et al. 2006). Indeed, widespread changes in neurophysiological activity are an integral part of an influential model of attention, the biased competition model, in which attention biases the competition for representations of stimuli or events throughout the brain (Desimone and Duncan 1995). Yet, evidence that attention can produce truly global neural changes is scant (Rosenberg et al. 2017). Attention networks of the brain have been well delineated, including a ventrolateral “stimulus-driven” network composed of the temporoparietal junction, inferior frontal junction, and anterior insula (Corbetta and Shulman 2002; Downar et al. 2000; Marois et al. 2000; Serences et al. 2005) that overlaps with a related “salience” network in AI and dorsal anterior cingulate cortex (Menon and Uddin 2010; Menon 2011), as well as a dorsal “goal-directed” network consisting of core components in the frontal eye field and dorsal parietal cortex (Beck et al. 2001; Chica et al. 2014; Corbetta and Shulman 2002; Kastner et al. 1999; Shulman et al. 1999). However, given the wide-ranging extent of the cognitive and physiological changes associated with the orienting response, such changes may also originate from a range of brain regions well beyond the confines of the attention networks. Moreover, the rapidity and flexibility with which an individual may have to interact with the surprising event could be optimized if cortical resources were also primed to address this event in a swift manner. Thus, we hypothesize that attention capture by a surprising event involves widespread alterations in the functional topology of the human brain to facilitate the rapid exchange of information across the cerebral cortex. According to this hypothesis, while the attention networks would ignite attention capture, their effects would be propagated across a broad expanse of the brain to prime the observer’s analysis and context-appropriate response to the surprising event, akin to the global workspace model of awareness. As such, attention capture would represent a dynamic interplay between specific networks and the entire brain state, consistent with recently proposed frameworks of large-scale dynamic brain function (Ciric et al. 2017).
Using functional magnetic resonance imaging (fMRI) combined with graph theory analyses, we sought to examine whether detection of salient, novel task-irrelevant “oddball” events produced functional connectivity changes throughout the brain or whether they were mostly confined to the attention/salience networks. Graph theory is ideal for testing global functional connectivity predictions, as it provides concise measurements of the functional topology of an entire graph system (Bullmore and Sporns 2009; Medaglia et al. 2015). Participants performed a demanding goal-oriented visual search task in which they monitored a rapid stream of distractors for the presentation of target letters, with the task disrupted by the rare presentations of unexpected, salient oddball images. We then used graph theory analysis to assess whether the initial presentations of oddballs produce a global shift in the pattern of functional connectivity rather than regional (attention network) changes, and to determine whether such global changes would mirror the behavioral habituation pattern that is observed with repeated presentations of the surprising events (Asplund et al. 2010a, 2010b; Sokolov 1963). If such global connectivity changes are observed with attention, we also aimed at distinguishing the underlying process(es) driving those changes. One mechanistic possibility is that they are brought about by increased integration of the brain’s networks due to a surge in internetwork connectivity, as was observed for perceptual awareness of a goal-relevant target (Godwin et al. 2015), consistent with the finding that integrated network states enable faster cognitive performance tasks (Shine et al. 2016). Another possibility is that these changes could result from a modulation in “small-worldness”, a measure of the brain’s balance between functional integration and functional specialization (Bassett and Bullmore 2017; Bassett et al. 2006; Watts and Strogatz 1998) that is indicative of the graph’s propensity for efficient information processing and propagation (Oliveira et al. 2014). In the latter account, attention capture could shift the state of the brain’s small-worldness toward greater functional integration by reducing the functional distance between all brain regions, i.e., reducing the characteristic path length of the graph system, while leaving regional specialization relatively unaffected.
MATERIALS AND METHODS
This study presents novel connectivity and graph theory analyses of data acquired in Asplund et al. 2010b. The graph analytic methods have been previously described in detail in Godwin et al. 2015. Additional details of the experimental design can be found in Asplund et al. 2010b. Any new analytic steps are described in the following sections.
Participants
Thirty-one individuals (12 females, age range 19–29 yr) recruited from the Vanderbilt University community participated in the study. All participants had normal or corrected-to-normal vision. The Vanderbilt University Institutional Review Board approved the experimental protocol, and written informed consent was obtained from all participants. Data from one participant was excluded due to technical problems during the scan session. Two participants were excluded from fMRI analyses because their average global motion fell beyond 2.5 standard deviations from the mean of the sample. An additional three participants were excluded because they had a disproportionate number of events that were censored from functional connectivity and graph theory analyses due to excessive framewise head displacement (see Experimental Design: fMRI Methods below). As a result, the connectivity analyses below include 25 participants.
Experimental Design: Behavioral Paradigm
The main task (Fig. 1) consisted of searching for a target letter (“X”) presented in a rapid serial visual presentation (RSVP) of distractor letters (all letters were shown in white Helvetica font, 1.8° × 1.8°, overlaid on a dark gray background). Trials were 8 s long and consisted of a 3.4-s letter RSVP followed by a 2-s response period and a 2.6-s intertrial interval (ITI). RSVP periods consisted of 31 letters chosen randomly, without possibility of repeats, from a possible set of 20, with vowels being excluded from the possible set. All stimuli were shown for 100 ms with a 10-ms interstimulus interval (ISI). An onscreen prompt directed participants to initiate a right index finger response to indicate “target present” or a right middle finger response to indicate “target absent.” ITIs displayed a white fixation cross on the screen for the duration. The target was present on 77.5% of the 40 total trials presented over the course of one fMRI run per participant.
Fig. 1.

A: schematic of behavioral task. Each trial (8 s) began with a 3.4-s rapid serial visual presentation (RSVP) of 31 letters, with each letter presented for 100 ms with a 10-ms interstimulus interval. Participants had 2 s to respond following each trial as to the presence of a target. A 2.6-s intertrial interval followed each response period. When presented, the oddball face occurred 330 ms before the target letter. B: rates of target detection for Early-oddball, Late-oddball, and No-oddball trials.
On a subset of trials (6 of 40), participants were shown a salient, task-irrelevant “oddball” stimulus during the RSVP at fixation in place of a distractor letter. Oddballs consisted of grayscale faces, each distinct from one another, and were shown during both target-present trials (for five of the oddballs) and no-target trials (for one oddball). On target-present trials, oddball images were displayed 330 ms before the target. Although only faces were used in the current study, we have previously shown that similar behavioral effects are obtained for other oddball types (Asplund et al. 2010b). The order of oddball trials, including the targetless oddball trial, was pseudorandomized and balanced across subjects. Oddball trials were separated by a minimum of two trials containing a target with no oddball stimulus. Only no-oddball trials were practiced before the fMRI session, and participants needed to be proficient at 80% accuracy before scanning.
All stimuli were presented using Psychophysics Toolbox extensions (Brainard 1997; Kleiner et al. 2007; Pelli 1997) in MATLAB (MathWorks).
Experimental Design: fMRI Methods.
The study was carried out in a 3T GE MRI system at the Vanderbilt University Institute of Imaging Sciences. Stimuli were back-projected from an LCD projector (Avotec, Inc.) onto a screen viewed by the participant lying in the scanner via a mirror. Nineteen 7-mm-thick axial slices were taken parallel to the anterior commissure-posterior commissure (AC-PC) line (0 mm skip; 3.75 × 3.75 mm in-plane). T2*-weighted image acquisition consisted of a 25-ms echo time, 70° flip angle, 240-mm field of view, 64 × 64 matrix, and a 2,000-ms repetition time; 166 brain volumes were collected during the functional scan, although the first 6 volumes were discarded to allow for signal stabilization.
Data preprocessing was performed using BrainVoyager QX 2.6 (Brain Innovation) and included 3D head motion correction, linear trend removal, and a correction for slice acquisition timing. Functional and anatomic runs were coregistered and transformed into standard Talairach space (Talairach and Tournoux 1988), with the functional image data being resampled at 3 × 3 × 3 mm3. Prior to the functional connectivity stage of analysis, six estimates of motion correction parameters (x, y, z, pitch, yaw, and roll), and six temporal (backward) derivatives of motion parameters were regressed out of the data to account for the potential effects of head motion on connectivity estimates (Power et al. 2012), as were a temporal constant and four physiological time series obtained from left and right white matter and ventricles to account for variable physiological noise (Birn 2012); note that leaving out the white matter and ventricle signals from the general linear model (GLM) yielded similar findings to those reported in the results section, namely significant effects of oddball presentation order on modularity (F2,48 = 77.10, P < 0.001, ANOVA), segregation (F2,48 = 43.97, P < 0.001, ANOVA), and participation coefficient (F2,48 = 33.17, P < 0.001, ANOVA). We included all trials (i.e., both correct and incorrect trials) in the analysis. GLMs included condition-specific regressors for the first two oddball trials (“Early” oddballs), the next four oddball trials (“Late” oddballs), target-present trials with no oddballs, and target-absent trials with no oddballs. The decision to distinguish the initial two oddballs from the later four was based on the pattern of behavioral results indicating an exponential decrement in oddballs’ capacity to capture attention with repeated presentations, with the first two presentations capturing more attention than the next four, as judged by target detection performance (Asplund et al. 2010a, 2010b). This rationale is further bolstered by univariate fMRI analyses showing far stronger BOLD signal responses to the first two oddballs than for subsequent pairs of oddballs (Asplund et al. 2010b). In addition to the two oddball conditions (Early- and Late-oddball trials), no-oddball trials with and without a target were combined into the “No-oddball” condition for connectivity and graph theory analyses to provide a robust baseline for assessing connectivity and topology in the absence of distracting oddball images.
Because functional connectivity and graph theory measures have been shown to be particularly sensitive to head motion (Drakesmith et al. 2015; Power et al. 2012; Satterthwaite et al. 2012; Van Dijk et al. 2012), extra steps were implemented to alleviate any effects of head displacement before we constructed background connectivity matrices. First, for each subject’s time series we computed the framewise head displacement estimates (a singular measurement of movement created by collapsing across the six estimates of motion). If the framewise displacement was greater than an a priori threshold of 0.2 mm (Siegel et al. 2014), we performed motion censoring, which involved removing the corresponding brain volumes and the one before each high motion volume. A trial’s remaining uncensored volumes were included in the analysis if they constituted 50% or more of the volumes in the trial (i.e., >6/12 s of data remain after censoring). Furthermore, a subject is included in the analysis only when there is at least one “clean” trial per condition, where a trial was considered “clean” if it contained no censored volume. With the application of this criterion, three subjects were excluded. We also tested and validated the robustness of our graph metric results to a broad range of motion tolerance (see results).
For the remaining 25 participants, we next determined whether the connectivity analyses could be confounded by a condition-specific pattern of head movement by comparing the residual average framewise displacement of head position across conditions of interest. We found that the average framewise displacement, over the same 12-s window used for connectivity analyses described in the next section, was influenced by condition, F2,48 = 7.89, P = 0.001, partial η2 = 0.25, ANOVA. However, pairwise comparisons between conditions indicate that this difference is attributed to higher displacement and more motion during Late-oddball trials (M = 0.075, SE = 0.006) than during Early-oddball trials (M = 0.066, SE = 0.006; t24 = 3.13, P = 0.005, Cohen’s d = 0.63, paired t test) but not significantly higher than No-oddball trials (M = 0.072, SE = 0.005; t24 = 1.64, P = 0.1, Cohen’s d = 0.33, paired t test), and that No-oddball trials significantly differed from early-oddball trials (t24 = 2.85, P = 0.009, Cohen’s d = 0.57, paired t test). If the present graph theory analysis was largely confounded by motion, and given that the Early-oddball trials were one of those with the lowest displacement, we would expect modularity to be greater for Early-oddball trials than for Late-oddball and No-oddball trials, given previous evidence that head motion has a negative relationship with modularity (Satterthwaite et al. 2012). Such a modularity increase with early oddballs would run counter to the proposed intermodular network connectivity changes mentioned in the introduction and, as evidenced in results, would be inconsistent with our pattern of findings. Furthermore, when we included this residual motion (i.e., the residual average framewise displacements of head motion) as a covariate in a regression model at the group level testing and assessed the effects of conditions on graph theory measures (e.g., modularity), the main results of the graph theory analyses were qualitatively the same as those presented in results (i.e., there was still a main effect of oddball condition for both modularity, F2,47 = 59.61, P < 0.001, partial η2 = 0.72, and participation coefficient, F2,47 = 42.21, P < 0.001, partial η2 = 0.64).
Functional Connectivity and Statistical Analysis
Regions of interest (ROIs) were defined according to the results of a previously reported analysis of resting-state functional connectivity (Power et al. 2011), in which the authors identified 264 nodes with strong overlap with known functional-network systems. Conversion of these Montreal Neurological Institute coordinates into Talairach coordinate space was performed in the current study via the mni2tal.m function in MATLAB. Six-millimeter-radius spheres were drawn around each coordinate to create a list of 264 ROIs to serve as nodes for graph theory analyses.
To produce a full connectivity matrix for each participant, a separate GLM was performed for each of the 264 seeds (nodal ROIs). In GLM, task-dependent activity was modeled by convolving the onset of events of interest with a canonical hemodynamic response function (HRF). Background activity (e.g., residual time series from GLM) was obtained by regressing out the task-related activity and nuisance signals (e.g., motion and physiological regressors) (Cohen and D’Esposito 2016; Cole et al. 2014, 2019; Fair et al. 2007; Tran et al. 2018). Then, for each condition, six consecutive volumes following the onset of a trial (0–12 s) were extracted from the residual time series and concatenated across all trials for that condition. The correlation matrix was reconstructed by estimating functional connectivity between each pair of nodes for each condition respectively. With background connectivity, connections were estimated based on Pearson correlations (via the corrcoef.m function in MATLAB) on the residual time series, and Fisher’s Z transformation was applied to correlation coefficients. To assess the generalizability of our results, we also analyzed the data by using a finite impulse response (FIR) model (Cole et al. 2019), which yielded the same main effects of modularity and participation coefficients as those reported with the canonical HRF in results.
To prevent highly variable connections across individuals from biasing inferences based on the average correlation matrix and to minimize thresholding variability in graph theory analyses (Rubinov and Sporns 2010), individual correlation matrices were masked to exclude connections that were not statistically greater than or less than 0 across participants (t test, P < 0.05, false detection rate corrected for the number of connections; note that leaving out masking individual correlation matrices from the analysis yielded similar findings to those reported in results, namely significant effects of oddball presentation order on modularity (F2,48 = 95.37, P < 0.001, ANOVA), segregation (F2,48 = 58.78, P < 0.001, ANOVA), and participation coefficient (F2,48 = 57.71, P < 0.001, ANOVA). Individual correlation matrices were then combined to derive a participant average correlation matrix and connectogram to illustrate the statistically reliable topography of functional connectivity for early-, late-, and no-oddball trials across individuals (Fig. 2).
Fig. 2.

Top 10% of subject-averaged connectivity for 3 conditions (Early-oddball, Late-oddball, No-oddball). A: correlation matrices (264 × 264) aggregated across participants; points in blocked squares indicate corresponding within-network connections. B: group-averaged connectograms with pairwise connections of the 264 nodes displayed in circular ring; edges outside the ring indicate within-network connections, and edges inside the ring indicate cross-network connections. Nodes’ network memberships were derived from Power et al. (2011), with nodes color coded according to the purported network membership.
Graph Theory and Statistical Analysis
Graphs were constructed for each participant for each of our conditions of interest (Early-oddball, Late-oddball, and No-oddball trials) and examined via the Brain Connectivity Toolbox (BCT) (Rubinov and Sporns 2010) for graph theory analyses. Prior to statistical calculation of graph-theoretic metrics, we accounted for the effects of the number of nodes, connections, and distribution of connections (Rubinov and Sporns 2010) by proportionally thresholding the graphs to include only the top 10% of the strongest positive connections that were statistically reliable across participants for each condition. This is a standard technique used in many similar studies involving functional connectivity analysis (Godwin et al. 2015; Rubinov and Sporns 2010). That said, and as conventional, we tested and validated the robustness of the graph theory results to a range of thresholds from 5% to 25% of strongest connections (see results). Using higher thresholds beyond that would likely include more spurious connections, thus obscuring the results of the graph theory analysis. In addition, all negative connections were discarded to exclude the potential influence of noisy connections on graph theory metrics (Rubinov and Sporns 2010). Following thresholding, matrices were rescaled to the range [0,1] by dividing connectivity values by the maximum value on a per-subject graph basis. Finally, following calculation of graph metrics, three particular metrics (i.e., global efficiency, clustering coefficient, and characteristic path length) were “normalized” by comparing said values to those derived from the average of 100 null reference graphs (constructed with the Brain Connectivity Toolbox), again on a per-subject basis. This normalization step was undertaken to allow for comparing these graph metrics across conditions and for evaluating the consistency of these metrics across thresholds, which contain variable connection densities, degree distributions, etc., and can therefore affect values of graph metrics (van Wijk et al. 2010).
Corrections for multiple comparisons of graph metrics was performed by gating comparison of pairwise conditions by the significant result of an omnibus one-way ANOVA per metric examined (Rubinov and Sporns 2011). Given the nonindependence of the network properties examined, no correction for multiple comparisons was performed based on the number of metrics tested, similarly to previous work in the field (Cao et al. 2014; Godwin et al. 2015; Rubinov and Sporns 2010, 2011).
We used a graph partition system consisting of 14 consensus networks over 264 nodes of the cerebral cortex for defining the brain’s community structure (Power et al. 2011); this partition scheme is consistent with well-known specialized brain networks supporting a wide range of cognitive functions and involved in a broad array of behavioral tasks (Cole et al. 2014; Power et al. 2011). A fixed-network architecture allows us to test the functional integration of the graphs under different conditions on a common ground and, importantly, without bias from small shift in community assignment across conditions. This approach has been used in previous studies that examined the changes in graph measures (e.g., modularity) across conditions or that assessed relations of graph measures to other factors of interest (Baum et al. 2017; Duncan and Small 2016).
Graph theory metrics.
Our analyses focused on graph theory metrics that undergird the Integration (modularity, segregation, participation coefficient) and Small-Worldness (characteristic path length, clustering coefficient, global efficiency and small-worldness) hypotheses laid out in the introduction. The description of each metric follows below, starting with those associated with the Integration hypothesis.
We utilize Newman’s definition of modularity (Newman 2004) for weighted matrices to determine the modularity (Qw) of graphs, a measure assessing the degree of segregation and integration between the nonoverlapping “modules” defined by the networks of nodes. Weighted modularity (Qw) was calculated by
with weighted connections between nodes i and j (wi,j), sum of all weights in a graph (lw), weighted degree of a node (), module containing node i (mi), and = 1 if mi = mj. Modularity Qw was computed using the formula above with predetermined assignments of the 264 nodes to the 14 networks (modules) according to Power et al. 2011. The degree to which modularity increases reflects the extent of isolated processing within modules, independent of communication with nodes in other modules, hence, the segregation of these islands of information processing. On the other hand, modularity decrease reflects the cooperative processing across modules and, hence, integration of these functional units.
Because modularity estimation is optimized for bottom-up, data-driven partition of the brain into functional communities (Newman 2006; Sporns and Betzel 2016), whereas we used a fixed-partition system here, we also employed a metric that not only could be applied to an a priori data partition system but also directly assessed the degree of system segregation of the brain networks (Chan et al. 2014). Specifically, the weighted segregation (Gw) was calculated as follows:
in which is the mean of functional connectivity between all pairs of nodes within modules defined by Power et al. 2011’s community assignments, and is the mean of functional connectivity between all pairs of nodes between modules. Segregation measures the relative strength of between-module connectivity compared with within-module connectivity. Thus, higher value indicates relatively stronger segregation (i.e., within-network connection), whereas lower value indicates relatively stronger integration (i.e., internetwork connection) of a modular system (Chan et al. 2014; Cohen and D’Esposito 2016). Moreover, compared with modularity, segregation may characterize different features of the community organization of a network (Wig 2017); thus, it was important to examine both measures in the current study. Like modularity, segregation was computed with predetermined assignments of the 264 nodes to the 14 networks (modules) according to Power et al. (2011).
Utilizing the modules defined by the network structure, we can calculate the degree to which nodes communicate across modules, i.e., the participation coefficient of those nodes, a measure of centrality of the graph’s system. Nodes with high participation increase global integration by facilitating between-module communications. Specifically, the weighted participation coefficient () is calculated by:
where N is the set of all nodes, M is the set of all modules, and is the weighted degree of connections between node i and nodes in module m. Participation coefficient () was computed in BCT using the “participation_coef” function, again with predefined module structure.
The Small-Worldness hypothesis predicts changes in the balance between the demands for functional integration necessary for efficient global communication and functional segregation necessary for specialized processing (Achard and Bullmore 2007; Bullmore and Sporns 2009; Watts and Strogatz 1998), potentially occurring uniquely in the clustering coefficient and characteristic path length metrics.
As a measure of functional segregation, the clustering coefficient highlights the degree to which information is shared across triads of nodes, reflecting strength of interconnection among local clusters. The weighted clustering coefficient () is calculated by
where is the weighted geometric mean of triangles around node i. Clustering coefficient () was computed in BCT using the “clustering_coef_wu” function.
The characteristic path length, a metric of functional integration reflecting the degree to which information is spread widely throughout the graph, measures the functional distance between any two nodes. Specifically, the weighted characteristic path length () is defined as the functional distance between nodes and is calculated as follows:
where is the shortest weighted path length between nodes i and j, computed with an inverse mapping of weight to length. The characteristic path length was computed in BCT using the “distance_wei” function.
The weighted network small-worldness () metric can, in turn, be calculated by the ratio of the normalized clustering coefficient to the normalized characteristic path length, as follows:
where and are weighted clustering coefficient and weighted characteristic path length calculated by averaging over a set of null/random graphs of the tested graph (Humphries and Gurney 2008). The null graphs were generated in BCT using the “randmio_und” function, which randomizes the target graph by randomly rewiring its edges while preserving the degree distribution. Both clustering coefficient and characteristic path length are expected to be very low in random null graphs. In our study, we randomly generated 100 null graphs from each target graph and computed their average clustering coefficient and characteristic path length for normalization purpose.
Finally, we also computed global efficiency, which is another metric related to the average inverse shortest path. Arguably, it provides a more meaningful measure of functional integration for disconnected networks (i.e., graphs with more than one connected component), for which the characteristic path length is ill defined for being infinite. Moreover, compared with characteristic path length, global efficiency is less influenced by extreme long paths, which may represent outliers between pairs of nodes (Achard and Bullmore 2007). Specifically, the global efficiency () is defined as follows:
It was computed in BCT using the “efficiency_wei” function.
Graph theory metrics on Early-oddball, Late-oddball, and No-oddball trials were then compared using repeated-measures ANOVA. Post hoc comparisons between any pair of conditions were conducted with paired t tests unless otherwise noted.
Per-Network and Targeted Attack Analyses
It is conceivable that changes in graph theory metrics caused by the presentations of novel, salient oddballs were driven by large changes in a small set of networks in the overall graph instead of emanating from widespread changes distributed throughout the cerebral cortex. This may particularly apply to the attention networks, given their engagement in attention capture (Asplund et al. 2010b; Han and Marois 2014; Menon and Uddin 2010; Stevens et al. 2000; Watkins et al. 2007), and to the salience network, given its propensity to respond to salient events (Menon and Uddin 2010; Seeley et al. 2007; Uddin 2015). To address this issue, we examined the graph theory metrics on a per-network basis, focusing on the metrics that were affected by the oddball manipulation in the entire graph system, namely modularity, segregation, and participation coefficient. Because modularity measures the functional segregation of the nodes within the defined network modules (Newman 2004; Rubinov and Sporns 2010), it can be meaningfully broken down into 14 submeasures, each representing the contribution of modularity in the corresponding networks defined by Power et al. 2011 to the overall metric (noticing that the contribution of modularity value from two nodes belonging to different networks is zero). Similarly, segregation can be computed for each network on the basis of the nodes and connectivity pertaining to the nodes within the specified network alone. Finally, participation coefficient can be computed for each node and averaged for the nodes within each network instead of globally.
To assess more directly whether global changes in modularity, segregation, or participation were driven by the attention or salience networks, we employed a targeted-attack procedure (Bullmore and Sporns 2009), which consists of assessing the impact of selectively excluding the attention or salience networks from the graph theory analysis. If excluding these nodes from the graph leads to significant changes in participation, segregation, or modularity, then one can conclude that the attention networks are critical to the expression of global changes in these metrics with oddball presentations. Aside from excluding these nodes and the edges they formed with other portions of the overall graph, the analytic approach was identical to that of the globally averaged analysis described above. Specifically, the null graphs were constructed based on the corresponding subgraph, with the specified attention network excluded.
RESULTS
Behavioral Results
Participants searched for a target letter amid distractors in a rapid serial visual presentation (RSVP) stream of letters while being scanned with fMRI. On 6 of the 40 trials of the fMRI run, a salient unexpected oddball face stimulus was presented. Such stimuli powerfully capture attention, as evidenced by the severe impairment in detecting a target presented 330 ms after the oddball stimulus, especially in the first few presentations (Asplund et al. 2010b). Consistent with these findings, target detection in the fMRI run was worse in the first two oddball trials than in the last four (t24 = 5.28, P < 0.001, Cohen’s d = 1.06, paired t test; Fig. 1). Importantly, target detection in the last four oddball trials was also worse than in target-present No-oddball trials (t24 = 2.90, P = 0.008, Cohen’s d = 0.58, paired t test). Thus, although attenuated, attention capture was still evident in the last four oddballs. Taken together, these behavioral results are consistent with previous studies in demonstrating the ability of salient task-irrelevant oddballs to powerfully capture attention. Moreover, the strength of this attention capture is contingent on the number of times oddballs are presented (Asplund et al. 2010a, 2010b; Braver et al. 2001; Marois et al. 2000; Sokolov 1963; Stevens et al. 2005), with the largest effects elicited by the first two presentations, followed by the next four oddball presentations. The rapid attenuation of attention capture with serial oddball presentations provides a powerful means to assess whether potential changes in global connectivity patterns reflect attention capture per se rather than the physical presentation of the oddballs, as the latter is equated in all oddball presentations.
Global Connectivity Patterns
To examine the effects of attention capture on global functional connectivity patterns, we first assessed the pairwise functional connectivity across 264 nodal regions of interest of the cerebral cortex (Power et al. 2011) identified by meta-analyses of resting-state fMRI data and organized in known functional-network systems. Functional connectivity was calculated based on Pearson correlations on the residual time series from the general linear model in which the task- and stimulus-induced responses have been regressed out (Cohen and D’Esposito 2016; Cole et al. 2014, 2019; Fair et al. 2007; Tran et al. 2018), allowing us to assess task-dependent functional connectivity across brain regions unconfounded by task-coincident activity (Rissman et al. 2004; Cisler et al. 2014; Sadaghiani and Kleinschmidt 2013; Sadaghiani et al. 2015). Such background activity has been shown to represent intrinsic organizations of functional networks across several task states and during resting state (Cole et al. 2014; Godwin et al. 2015; Nath and Beauchamp 2011; Spadone et al. 2015; Wu et al. 2020).
Given the extensive behavioral effects produced by the initial presentations of salient, task-irrelevant stimuli, we hypothesized that these would be accompanied by pervasive changes in functional connectivity, reflecting the powerful capture of attention by the unexpected oddballs. Moreover, we predicted that the putative global connectivity changes would be attenuated with additional oddball presentations, although these changes would still be present relative to trials with no oddball presentations. Visual inspection of the graph’s node-based functional correlations (connectogram; Fig. 2) hints at a more diffused set of weak connectivity weights throughout the graph in the oddball conditions compared with the no-oddball condition, although it is difficult to draw conclusions on the effect of oddball presentations based solely on subjective assessment of pairwise nodal correlations. To better visualize and understand the changes in global functional connectivity patterns following oddball presentations, we first aggregated the individual nodal-level connectivity (by summing the connections) both within and across the 14 functional networks defined by Power et al. 2011 and then plotted the group-level pairwise connectivity differences across the three conditions. The resulting difference connectograms, depicted in Fig. 3, reveal the global diffusion effect caused by attention capture to oddball presentations, namely a widespread surge in internetwork connectivity with Early-oddball presentations that attenuates with further oddball presentations. Interestingly, the networks showing increased connectivity with initial oddball presentations included most of those that would be expected to be recruited with attention capture by a visual event (e.g., visual, default, ventral, and dorsal attention networks), whereas the No-oddball condition prominently featured the sensorimotor network and cinguloopercular/salience networks, which we attribute to the anticipation for and/or execution of a response to goal-relevant targets (Corbetta and Shulman 2002; Dosenbach et al. 2007; Han and Marois 2014; Serences et al. 2005; Sestieri et al. 2014). These visual intuitions are largely backed up by statistical comparisons of the connectivity strengths across networks in the three conditions (Fig. 4). These analyses revealed that the Sensory/Motor Mouth/Hand, Salience, and Auditory networks were more strongly connected in the No-oddball condition than in the two oddball-present conditions. In contrast, Early-oddball presentations triggered an increase in the connections between Attention, Visual, Default, Subcortical, and Uncertain networks relative to the other two conditions.
Fig. 3.

Group-averaged connectivity difference between 3 conditions (Early-oddball, Late-oddball, No-oddball) at the network level. The 14 networks are displayed as 14 rings (ring size is proportional to number of nodes it contains); edges between the rings indicate cross-network connection differences (edge thickness is proportional to magnitude of difference); solid circles inside the rings indicate within-network connection differences (circle size is proportional to magnitude of difference). Red edges (circles) indicate that the difference is positive; blue edges (circles) indicate that the difference is negative. A between-network or within-network connectivity difference is reported only when it is statistically significant between the 2 conditions (random effects analysis using paired t test, P < 0.05).
Fig. 4.
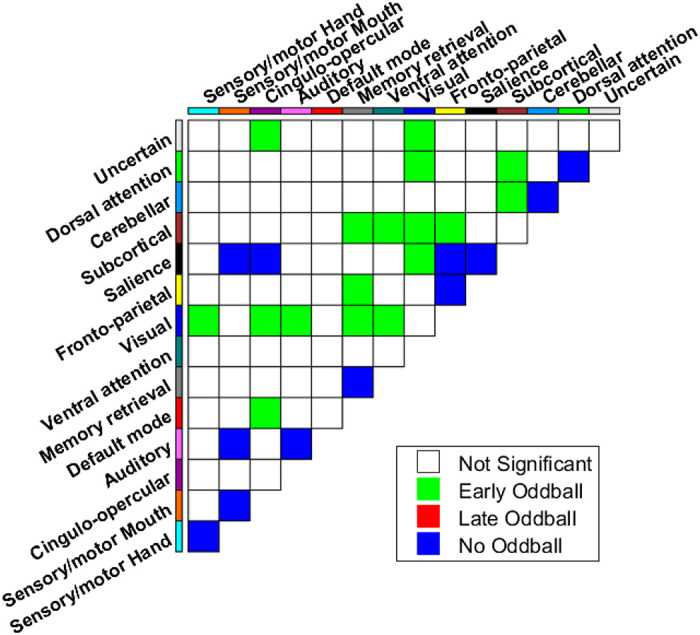
Group-based network-level connectivity matrix. Colored cells indicate that a given condition (Early-oddball, Late-oddball, or No-oddball) exhibited significantly greater connectivity than each of the 2 other conditions (i.e., there was a main effect of condition using ANOVA P < 0.05, corrected, and both post hoc paired t tests were significant P < 0.05) between 2 given networks. Blank cells indicate there was no main effect of oddball condition (P > 0.05, ANOVA, corrected) or an oddball condition failed to be significantly different from both of the other conditions (see more details on pairwise comparisons of conditions in Supplemental Fig. S1, available at https://doi.org/10.6084/m9.figshare.10280291.v1 ).
Graph Theory Results
There are limits to drawing firm conclusions about global connectivity changes on the basis of visual presentations of the connectograms. To provide a quantitative and global assessment of the changes in functional connectivity patterns that occur with attention capture, and to compare the two proposed accounts for these changes (see introduction), we submitted the correlation matrices data to graph theory analysis, focusing on the metrics undergirding the Integration and Small-Worldness hypotheses laid out in the introduction, namely modularity, segregation, participation coefficient, clustering coefficient, characteristic path length, global efficiency, and small-worldness. Figure 5 depicts these graph theory metrics for the Early-oddball, Late-oddball, and No-oddball trial conditions.
Fig. 5.

Effect of oddball conditions (Early-oddball, Late-oddball, and No-oddball) on selected graph-theoretic metrics for the top 10% of functional connections at 50% motion tolerance. A similar pattern of results was obtained with a broad range of thresholds and motion tolerances (see Supplemental Figs. S2 and S3). For clustering coefficient, characteristic path length, and global efficiency, y-axis values represent the ratio of the observed graph metric to the corresponding metric averaged over 100 null graphs (see materials and methods). *Significant effects between 2 conditions at P < 0.05, paired t test. Error bars represent within-group SE.
Integration hypothesis.
According to the Integration hypothesis, suggested by a recent study about the global connectivity changes that take place with conscious target detection (Godwin et al. 2015), attention capture would lead to a breakdown of the brain’s functional modularity, with such breakdown resulting from an increase in the functional participation of intermodular connections. This Integration hypothesis, therefore, predicts changes in modularity, segregation, and participation coefficient with attention capture akin to those observed with target awareness (Godwin et al. 2015; Rubinov and Sporns 2010). The results conformed to this prediction, showing that functional modularity shows a main effect of conditions (F2,48 = 60.86, P < 0.001, partial η2 = 0.72, ANOVA; see Fig. 5); modularity was lower in Early-oddball trials than in Late-oddball trials (t24 = −3.51, P = 0.0018, Cohen’s d = 0.70, paired t test), lower in Early-oddball trials than in No-oddball trials (t24 = −10.70, P < 0.001, Cohen’s d = 2.14, paired t test), and lower in Late-oddball trials than in No-oddball trials (t24 = −7.42, P < 0.001, Cohen’s d = 1.48, paired t test). Similarly, system segregation showed a main effect of oddball conditions (F2,48 = 41.77, P < 0.001, partial η2 = 0.64, ANOVA), with segregation being lower in Early-oddball trials than in Late-oddball trials (t24 = −3.54, P = 0.0017, Cohen’s d = 0.71, paired t test), lower in Early-oddball trials than in No-oddball trials (t24 = −9.30, P < 0.001, Cohen’s d = 1.86, paired t test), and lower in late-oddball trials than in No-oddball trials (t24 = −6.01, P < 0.001, Cohen’s d = 1.20, paired t test). The decrease in modularity and segregation for the Early-oddball condition suggests that functional modules were more integrated in the first few oddball presentations than in the other trial types. The participation coefficient, which measures cross-modular connections defined by the functional networks, also showed a significant main effect of condition (F2,48 = 46.74, P < 0.001, partial η2 = 0.66, ANOVA), again consistent with the Integration hypothesis; participation coefficient was higher in Early-oddball trials than in Late-oddball trials (t24 = 2.83, P = 0.009, Cohen’s d = 0.57, paired t test), higher in Early-oddball trials than in No-oddball trials (t24 = 11.26, P < 0.001, Cohen’s d = 2.25, paired t test), and higher in Late-oddball trials than No-oddball trials (t24 = 7.24, P < 0.001, Cohen’s d = 1.45, paired t test). These results suggest that the capture of attention by the presentations of novel, salient oddballs causes a breakdown of the brain’s functional modularity with increased participation among different networks and that this effect attenuates with repeated oddball presentations. Evidently, oddball presentations trigger global functional integration of the brain’s neural networks.
Importantly, these results are unlikely to be an artifact of the fixed-network architecture that we used to test the functional integration of the graphs (see materials and methods). Although this architecture may not be as optimal as if it had been obtained from resting-state scans of the same subject cohort, it still allowed us to observe relative changes in the network community that could not easily be accounted for by a suboptimal fit of the network architecture to the data. That the changes in graph theory metrics are consistent with one another—increased participation should be associated with decreased modularity and segregation—and with the central hypothesis of increased global integration with attention capture lends further credence to the suitability of the application of the fixed-network architecture in the present study.
We also assessed whether these findings could be a result of target detection processing rather than attention capture per se, given the strong correlation between oddball order presentation and target detection performance (see Behavioral Results above). To address this issue without the confound of oddball order, we looked at target detection performance within each oddball condition, with the caveat that this reduces the number of correct and incorrect trials that can be compared. With this analysis, we found no significant differences in modularity, segregation, or participation coefficient metrics when correct and incorrect trials were compared within each of the three oddball trial categories (e.g., two-sample t tests, all Ps > 0.1, corrected). These results rule out target detection performance as a confound for the connectivity effects of attention capture.
A peculiarity of the inherent structure of the present task design is the vastly different numbers of trials included in each of the three oddball trial conditions (see materials and methods). Of particular concern are the low numbers of volumes included in the Early- and Late-oddball conditions relative to the No-oddball condition, which could cast doubt on the experimental paradigm’s ability to reveal meaningful differences across conditions. However, robust, statistically significant effects have previously been observed with univariate analyses of the same data set using comparably low trial numbers (Asplund et al. 2010b), most likely owing to the systemic and powerful cognitive and psychophysiological effects rare oddball presentations are known to have (see introduction). In addition, we found that group-based variances in functional connectivity across conditions were comparable (Full matrix: Early oddball: M = 0.114, SE = 0.0101; Late oddball: M = 0.123, SE = 0.0119, No-oddball: M = 0.157, SE = 0.0103), again consistent with similar variances reported in our previous univariate fMRI study (Asplund et al. 2010b). But to address the issue of uneven trial numbers across conditions more directly, we subsampled the No-oddball condition by randomly selecting four trials (so as to equate the number of trials in the Late-oddball conditions) and redid the graph theory analysis. The results of this additional analysis revealed a similar pattern as the full data set analysis (i.e., for modularity and segregation measures: Early-oddball < Late-oddball < No-oddball, F2,48 = 39.96, P < 0.001, partial η2 = 0.62, ANOVA; and F2,48 = 34.89, P < 0.001, partial η2 = 0.59, ANOVA; for participation coefficient: Early-oddball > Late-oddball > No-oddball, F2,48 = 3.47, P = 0.04, partial η2 = 0.13, ANOVA), although the amplitudes of difference between Late oddball and No-oddball were smaller than those reported in the main analysis.
A final concern that merited assessing was the effect of overlap in volumes during trial analysis, given that we used a 12-s event window for trial analysis and trials were only 8 s long (see materials and methods). This issue does not affect the early vs. late oddball comparison, because these trials were not presented adjacently. It could, however, affect the comparisons between oddball and no-oddball trials. To address this issue, we reanalyzed the data after removing the no-oddball trials immediately preceding and following each oddball trials so that there were no longer overlap between the oddball and no-oddball trial conditions. The revised graph theory analyses yielded the same pattern of results as those reported above, namely significant effects of oddball presentation order on modularity (F2,48 = 37.41, P < 0.001, ANOVA), segregation (F2,48 = 28.53, P < 0.001, ANOVA), and participation (F2,48 = 41.78, P < 0.001, ANOVA).
Small-Worldness hypothesis.
The second hypothesis argues that the capture of attention by the presentation of oddballs would trigger an increase in the brain’s functional “small-worldness,” a composite measure of the balance between functional specialization and efficient information propagation in the brain (Bullmore and Sporns 2012; Oliveira et al. 2014; Watts and Strogatz 1998). Specifically, attention capture could shift the state of the brain’s small-worldness toward greater functional integration by reducing the functional distance between all brain regions, i.e., reducing the characteristic path length of the graph system, while leaving regional specialization relatively unaffected. To test this hypothesis, we first assessed the two metrics that are factored in the computation of small-worldness (Fig. 5): clustering coefficient and characteristic path length, both normalized with regard to 100 null graphs (Fornito et al. 2016). The clustering coefficient showed no significant effect of oddball condition (F2,48 = 0.40, P = 0.67, partial η2 = 0.02, ANOVA), and neither did characteristic path length (F2,48 = 0.65, P = 0.53, partial η2 = 0.03, ANOVA). Small-worldness, as measured by the ratio of the normalized clustering coefficient over the normalized characteristic path length (Bullmore and Sporns 2012; Humphries and Gurney 2008; Watts and Strogatz 1998) also showed no significant effect of condition (F2,48 = 0.30, P = 0.72, partial η2 = 0.01, ANOVA). Finally, we also computed global efficiency, a metric related to characteristic path length that may be more robust to graph perturbations (Achard and Bullmore 2007). Nevertheless, and consistent with path length, there were also no significant differences in global efficiency, (F2,48 = 0.06, P = 0.94, partial η2 = 0.002, ANOVA).
Bayes factor analysis of null results.
Given the null effects for the small-worldness metrics, we assessed with a Bayesian approach the extent to which these results provided evidence in favor of the null hypothesis that oddballs do not affect small-worldness (Rouder et al. 2012) implemented in an R package (BayesFactor, v.0.9.12–4.2). Specifically, we compared a model with an effect of oddball conditions (model 1) against a model without that effect (model 0) using the default Cauchy prior (Rouder et al. 2012). In that schema, a Bayes factor of <1 is indicative of evidence in favor of the null hypothesis. For the four metrics showing no significant effect of oddball conditions, we observed moderate to strong evidence in favor of the null hypothesis (clustering coefficient: BF10 = 0.15; characteristic path length: BF10 = 0.19; small-worldness: BF10 = 0.14; global efficiency: BF10 = 0.12). Taken together, these results suggest that the capture of attention by the presentations of novel, salient oddballs does not significantly impact the brain’s functional small-worldness.
Per-Network Analysis
The upshot of the graph theory metric analyses presented above is that the capture of attention by the presentations of novel, salient oddballs led to a global increase in the brain’s functional connectivity due to a breakdown of network modularity. It is conceivable, however, that these graph theoretic results were driven by large changes in a small set of networks in the overall graph instead of emanating from widespread changes distributed throughout the graph. To test whether our results were driven by large changes in a few specific networks (in particular, the attention and salience networks), we compared the metrics of modularity, segregation, and participation coefficient in each of 14 subnetworks defined by Power et al. (2011) at the network level.
For modularity, all networks showed the same trend, with modularity smallest for Early-oddball trials and greatest for the No-oddball trials (Fig. 6). Thus, it does not appear that network-specific modulations drive the overall global changes in modularity. For segregation, all networks showed a significant main effect of oddball conditions, except for the sensory/motor mouth, cerebellar, and dorsal attention networks. Again, this pattern suggests that the decreased segregation (hence increased integration of whole brain network) observed with oddball presentations did not seem to be driven by specific subnetworks. For participation coefficient, 8 of the 14 networks, including the default mode (F2,48 = 28.72, P < 0.001, partial η2 = 0.54, ANOVA), ventral attention (F2,48 = 29.26, P < 0.001, partial η2 = 0.55, ANOVA), visual (F2,48 = 22.32, P < 0.001, partial η2 = 0.48, ANOVA), and subcortical networks (F2,48 = 7.52, P = 0.0014, partial η2 = 0.24, ANOVA), showed an effect of condition (Fig. 6). Thus, although participation effects were not as global as the modularity and segregation effects, they were still observed in more than 50% of the networks (with a nonsignificant trend in other networks as well). Nonetheless, these results hint at the greater importance of these networks in determining the global estimate of participation.
Fig. 6.

Effect of oddball conditions on graph-theoretic metrics of modularity, segregation, and participation coefficient across 14 network modules (Power et al. 2011). *Significant main effects of condition at P < 0.05, ANOVA. Error bars represent within-group SE.
Targeted-Attack Analysis
We assessed more directly whether global changes in modularity or participation coefficient were driven by specific networks, namely the attention and salience networks, using a targeted attack analysis (see materials and methods). Significant effects of conditions for participation, segregation, and modularity were found when we excluded the dorsal attention network (participation: F2,48 = 46.63, P < 0.001, partial η2 = 0.66, ANOVA; segregation: F2,48 = 41.34, P < 0.001, partial η2 = 0.63, ANOVA; modularity: F2,48 = 60.81, P < 0.001, partial η2 = 0.72, ANOVA), the ventral attention network (participation: F2,48 = 38.13, P < 0.001, partial η2 = 0.61, ANOVA; segregation: F2,48 = 28.53, P < 0.001, partial η2 = 0.54, ANOVA; modularity: F2,48 = 46.90, P < 0.001, partial η2 = 0.66, ANOVA), or both (participation: F2,48 = 36.93, P < 0.001, partial η2 = 0.61, ANOVA; segregation: F2,48 = 27.38, P < 0.001, partial η2 = 0.53, ANOVA; modularity: F2,48 = 46.05, P < 0.001, partial η2 = 0.66, ANOVA; Fig. 7). We also observed significant effects of oddball conditions for modularity (F2,48 = 61.86, P < 0.001, partial η2 = 0.72, ANOVA), segregation (F2,48 = 51.23, P < 0.001, partial η2 = 0.68, ANOVA) and participation coefficient (F2,48 = 45.71, P < 0.001, partial η2 = 0.66, ANOVA) when excluding the salience network. These results mirrored those obtained with the entire graph. Taken together with the per-network analysis above, these findings suggest that the global changes in functional connectivity with the presentations of novel, salient oddballs do not occur uniquely in the attention or salience networks. This is not to say, however, that such networks do not play critical roles in the responses to attention-capturing events, as we previously reported (Asplund et al. 2010b). Rather, consistent with previous reports of a disassociation between changes in mean BOLD amplitude in attention networks and changes in large-scale connectivity (Alnæs et al. 2015; Godwin et al. 2015), our findings suggest that, orthogonal to BOLD amplitude modulations in these attentional networks, there is also a more diffuse, global set of functional connectivity changes that accompany detection of salient, task-irrelevant oddballs.
Fig. 7.

Impact of excluding the attention networks (ventral and/or dorsal) on selected graph metrics for the 3 conditions (Early-oddball, Late-oddball, No-oddball). *Significant main effects of condition at P < 0.05, ANOVA. Error bars represent within-group SE.
DISCUSSION
Relative to No-oddball trials, the presentation of novel oddball stimuli produced specific changes in graph theory metrics associated with intermodular connectivity, namely decreased modularity, decreased segregation, and increased participation coefficient, consistent with the increased global integration hypothesis. These findings were tolerant to a range of connectivity and motion thresholds and were not specific to a subset of nodes or networks. Together, these results indicate that the attentional capture by task-irrelevant oddball images produces functional integration via enhanced internetwork connectivity. We surmise that such integration supports the widespread representation and processing of the oddballs and primes the observer for context-appropriate responses to them. Consistent with the biased competition model of Desimone and Duncan 1995, such attention capture mechanism could bias the competition for representation and processing of the oddballs throughout the brain at the expense of targets or other stimulus events, leading to poorer target detection performance and transient blindness to other events (Asplund et al. 2010b).
In contrast to the Integration hypothesis, we found support lacking for the Small-Worldness account; the presentation of task-irrelevant salient oddballs had no discernible effect on the metrics undergirding small-worldness. In particular, the hypothesis that initial oddball presentations would lead to a decrease in path length as the graph became more integrated was not supported. The relative stability of small-world properties in response to visual oddball stimuli is consistent with similar graph theory results of magnetoencephalography activity in response to oddball auditory stimuli (Nicol et al. 2012), and it may reflect the intrinsically high efficiency of the brain’s functional network topology. Specifically, the characteristic path length (as well as global efficiency) of the human brain’s graph system may remain largely unaffected by dynamic changes in the environment if the default settings for a healthy human brain correspond to near-optimal short-path lengths (Bullmore and Sporns 2012; Latora and Marchiori 2001; van den Heuvel et al. 2008). In any case, although small-worldness may be a useful metric to describe a graph system that is both locally specialized and globally integrated, it does not appear to embody the global changes associated with the capture of attention by salient, oddball events.
Although the per-network and targeted attack analyses suggest that the global changes in modularity, segregation, and participation with attention capture cannot predominantly be explained by connectivity changes in a single or a few networks, it is also not the case that all network connectivities were uniformly affected, as clearly evidenced in the network-based difference connectograms (Fig. 3). In particular, the No-oddball trials, relative to either oddball-present conditions, showed greater functional connectivity among a restricted set of networks that primarily included the sensorimotor, salience, and cinguloopecular networks as a supramodular functional unit that may be preferentially engaged in the search for, and response to, behaviorally salient targets (Dosenbach et al. 2007; Sadaghiani et al. 2015; Sestieri et al. 2014). In stark contrast, functional internetwork connectivity was far more extensive in the oddball-present conditions, especially in the Early-oddball trials. This “attention capture” supramodular unit mostly included the visual cortex, default mode, and ventral and dorsal attention networks, all largely consistent with the known functional neuroanatomy of attention capture by visual oddballs (Asplund et al. 2010b; Downar et al. 2000; Han and Marois 2014; Menon and Uddin 2010; Stevens et al. 2000). Interestingly, the segregation between the two aforementioned supramodular units was not complete. As seen in Fig. 3, all of the networks involved in the No-oddball supramodule were also present with reconfigured connections in the attention capture supramodule, but not vice versa. This hierarchical overlap between supramodules may reflect the notion that, just as given brain regions (nodes) can switch allegiance between networks (Asplund et al. 2010b), perhaps networks can also do so at the supramodular level in a task-dependent fashion as well, consistent with a dynamic hierarchical modular organization of the human brain (Bassett et al. 2015; Braun et al. 2015). As a case in point, the occurrences of the cingular/opercular and salience networks in both supramodules are consistent with the proposed functions of these networks. Given the presumed role of the cingular/opercular network in maintaining cognitive control and task priorities (Dosenbach et al. 2007; Sestieri et al. 2014), this network may flexibly reconfigure its connectivity to coordinate with other functional networks the appropriate response to an external stimulus that challenges current task priorities. Similarly, the salience network’s involvement in both supramodules may reflect its recruitment by behaviorally meaningful events, whether these are targets or oddballs (Han et al. 2019; Han and Marois 2014; Menon and Uddin 2010).
In contrast to the large internetwork connectivity changes observed with oddball presentations, intranetwork connectivity effects were far more subdued with attention capture, as evidenced by the small size of the inner circles, if present at all, in the difference connectograms of Fig. 3. Moreover, what changes there were tended to favor the No-oddball condition. Taken together with the internetwork connectivity changes, these findings suggest that oddball presentations trigger a surge in internetwork connectivity with minimal impact on intranetwork functional connectivity. This finding is generally consistent with the results of our graph theory analyses, especially the per-network and targeted-attack analyses, as they reinforce the notion that these changes are global in nature. This is not meant to say that the attention networks (or any other specific network) are not essential for triggering the global connectivity changes that we observed, but rather that the connectivity changes are not solely expressed by, and in, the attention networks.
There is a striking parallel between the results of the present study and those of an investigation into the global neural dynamics of perceptual awareness, for which we observed widespread changes in functional connectivity associated with conscious target perception (Godwin et al. 2015), consistent with global workspace models of awareness (Baars 2005; Dehaene and Changeux 2011; Ekman et al. 2012; Kitzbichler et al. 2011). Specifically, awareness of a task-relevant target was associated with a decrease in modularity and an increase in participation coefficient, with no modulation of small-worldness, path length, and clustering coefficient, just as we observed here with oddball presentations. These mirrored results in global connectivity changes between perceptual awareness of a task-relevant stimulus and the capture of attention by a task-irrelevant oddball event suggests that the dynamic emergence of “higher-level cognitive states” (Fornito et al. 2016) may result from global functional integration, which, we propose, are primarily brought about by modulations in intermodular connectivity. We further surmise that intermodular connectivity dictates global integration, because these are the vertices of the graph that can accommodate large modulations in functional connectivity relative to a basal or resting state, whereas the intranetwork functional connectivity may already be near optimal settings at resting state, with little room to maneuver in connectivity strength (Bassett and Bullmore 2017; Bullmore and Sporns 2012). This mechanism may allow the graph to profoundly and dynamically alter its functional network topology according to task demands or environmental context, as may be the case in the present study, by degrading its modularity for the swift propagation of information following the presence of a behaviorally salient event.
While the present study sheds light on the global functional connectivity dynamics of attention capture, it is worth underlining some of its limitations. First, modularity was calculated with an a priori network partition instead of via a data-driven approach, which optimizes modular partition and maximizes modularity. Although the current approach allowed us to compare the extent of segregation of the functional network across three conditions based on a common ground, it is not ideally suited for optimizing brain network partition and modularity estimation (Sporns and Betzel 2016). To gain a deeper understanding of the impact of attention capture on brain functional connectivity, it would be valuable in future studies to include data-driven partition approaches and to characterize the dynamic nature of partitioning over states or conditions by using a multislice network approach (Mucha et al. 2010). Second, our study cannot completely rule out the possibility that at least some of the present connectivity results may be associated with the break or shift from the goal-oriented attentional set of target search triggered by oddball presentations rather than attention capture per se. That said, this alternate account cannot easily accommodate the temporal-order effect of oddball presentations on functional network connectivity, because previous univariate analyses of the same data set (Asplund et al. 2010b) revealed such oddball order effects in the stimulus-driven attention network but not in the goal-directed attention network of the brain. Had the present functional connectivity results been primarily reflecting the effect of oddball presentations on goal-oriented task setting, these oddballs should have differentially impacted the dorsal attention network in the univariate fMRI analysis, given that network’s critical role in the control of goal-oriented attentional sets (e.g., Corbetta and Shulman 2002; Kastner et al. 1999; Yantis et al. 2002).
In conclusion, the present findings indicate that attention capture by a novel, task-irrelevant event triggers a widespread increase in the brain’s functional integration brought about by an increase in internetwork connectivity and that this process may underlie other forms of higher-level cognitive states (Alnæs et al. 2015; Bassett et al. 2015; Godwin et al. 2015). It is perhaps through widespread increases in functional connectivity that the brain is able to mobilize a wide range of physiological and cognitive processes with attention capture, thereby rapidly altering its functional topology to swiftly analyze and adaptively respond to an unpredictable and dynamic world.
GRANTS
This work was supported by National Eye Institute Grant P30 EY-008126 to the Vanderbilt Vision Research Center, National Science Foundation Grant 0094992, National Science Foundation Grant CCF 1719674, Vanderbilt Institutional Fund, National Institute of Mental Health Grant R01 MH-70776, and National Institute of Biomedical Imaging and Bioengineering Grant 5R01 EB-000461.
DISCLOSURES
No conflicts of interest, financial or otherwise, are declared by the authors.
AUTHOR CONTRIBUTIONS
R.M. conceived and designed research; H.S., Q.Y., J.L.S., H.P.E. and P.R. analyzed data; J.L.S. and R.M. interpreted results of experiments; H.S. prepared figures; J.L.S. and R.M. drafted manuscript; H.S., Q.Y., D.G., P.R. and R.M. edited and revised manuscript; H.S., Q.Y. and R.M. approved final version of manuscript;
ACKNOWLEDGMENTS
We thank Dr. Chris Asplund for assistance in data acquisition.
REFERENCES
- Achard S, Bullmore E. Efficiency and cost of economical brain functional networks. PLOS Comput Biol 3: e17, 2007. doi: 10.1371/journal.pcbi.0030017. [DOI] [PMC free article] [PubMed] [Google Scholar]
- Alnæs D, Kaufmann T, Richard G, Duff EP, Sneve MH, Endestad T, Nordvik JE, Andreassen OA, Smith SM, Westlye LT. Attentional load modulates large-scale functional brain connectivity beyond the core attention networks. Neuroimage 109: 260–272, 2015. doi: 10.1016/j.neuroimage.2015.01.026. [DOI] [PubMed] [Google Scholar]
- Asplund CL, Todd JJ, Snyder AP, Gilbert CM, Marois R. Surprise-induced blindness: a stimulus-driven attentional limit to conscious perception. J Exp Psychol Hum Percept Perform 36: 1372–1381, 2010a. doi: 10.1037/a0020551. [DOI] [PMC free article] [PubMed] [Google Scholar]
- Asplund CL, Todd JJ, Snyder AP, Marois R. A central role for the lateral prefrontal cortex in goal-directed and stimulus-driven attention. Nat Neurosci 13: 507–512, 2010b. doi: 10.1038/nn.2509. [DOI] [PMC free article] [PubMed] [Google Scholar]
- Baars BJ Global workspace theory of consciousness: toward a cognitive neuroscience of human experience. Prog Brain Res 150: 45–53, 2005. doi: 10.1016/S0079-6123(05)50004-9. [DOI] [PubMed] [Google Scholar]
- Bassett DS, Bullmore ET. Small-world brain networks revisited. Neuroscientist 23: 499–516, 2017. doi: 10.1177/1073858416667720. [DOI] [PMC free article] [PubMed] [Google Scholar]
- Bassett DS, Meyer-Lindenberg A, Achard S, Duke T, Bullmore E. Adaptive reconfiguration of fractal small-world human brain functional networks. Proc Natl Acad Sci USA 103: 19518–19523, 2006. doi: 10.1073/pnas.0606005103. [DOI] [PMC free article] [PubMed] [Google Scholar]
- Bassett DS, Yang M, Wymbs NF, Grafton ST. Learning-induced autonomy of sensorimotor systems. Nat Neurosci 18: 744–751, 2015. doi: 10.1038/nn.3993. [DOI] [PMC free article] [PubMed] [Google Scholar]
- Baum GL, Ciric R, Roalf DR, Betzel RF, Moore TM, Shinohara RT, Kahn AE, Vandekar SN, Rupert PE, Quarmley M, Cook PA, Elliott MA, Ruparel K, Gur RE, Gur RC, Bassett DS, Satterthwaite TD. Modular segregation of structural brain networks supports the development of executive function in youth. Curr Biol 27: 1561–1572.e8, 2017. doi: 10.1016/j.cub.2017.04.051. [DOI] [PMC free article] [PubMed] [Google Scholar]
- Beatty J Task-evoked pupillary responses, processing load, and the structure of processing resources. Psychol Bull 91: 276–292, 1982. doi: 10.1037/0033-2909.91.2.276. [DOI] [PubMed] [Google Scholar]
- Beck DM, Rees G, Frith CD, Lavie N. Neural correlates of change detection and change blindness. Nat Neurosci 4: 645–650, 2001. doi: 10.1038/88477. [DOI] [PubMed] [Google Scholar]
- Birn RM The role of physiological noise in resting-state functional connectivity. Neuroimage 62: 864–870, 2012. doi: 10.1016/j.neuroimage.2012.01.016. [DOI] [PubMed] [Google Scholar]
- Brainard DH The psychophysics toolbox. Spat Vis 10: 433–436, 1997. doi: 10.1163/156856897X00357. [DOI] [PubMed] [Google Scholar]
- Braun U, Schäfer A, Walter H, Erk S, Romanczuk-Seiferth N, Haddad L, Schweiger JI, Grimm O, Heinz A, Tost H, Meyer-Lindenberg A, Bassett DS. Dynamic reconfiguration of frontal brain networks during executive cognition in humans. Proc Natl Acad Sci USA 112: 11678–11683, 2015. doi: 10.1073/pnas.1422487112. [DOI] [PMC free article] [PubMed] [Google Scholar]
- Braver TS, Barch DM, Gray JR, Molfese DL, Snyder A. Anterior cingulate cortex and response conflict: effects of frequency, inhibition and errors. Cereb Cortex 11: 825–836, 2001. doi: 10.1093/cercor/11.9.825. [DOI] [PubMed] [Google Scholar]
- Bullmore E, Sporns O. Complex brain networks: graph theoretical analysis of structural and functional systems. Nat Rev Neurosci 10: 186–198, 2009. [Erratum in Nat Rev Neurosci 10: 312, 2009]. doi: 10.1038/nrn2575. [DOI] [PubMed] [Google Scholar]
- Bullmore E, Sporns O. The economy of brain network organization. Nat Rev Neurosci 13: 336–349, 2012. doi: 10.1038/nrn3214. [DOI] [PubMed] [Google Scholar]
- Cao H, Plichta MM, Schäfer A, Haddad L, Grimm O, Schneider M, Esslinger C, Kirsch P, Meyer-Lindenberg A, Tost H. Test-retest reliability of fMRI-based graph theoretical properties during working memory, emotion processing, and resting state. Neuroimage 84: 888–900, 2014. doi: 10.1016/j.neuroimage.2013.09.013. [DOI] [PubMed] [Google Scholar]
- Chan MY, Park DC, Savalia NK, Petersen SE, Wig GS. Decreased segregation of brain systems across the healthy adult lifespan. Proc Natl Acad Sci USA 111: E4997–E5006, 2014. doi: 10.1073/pnas.1415122111. [DOI] [PMC free article] [PubMed] [Google Scholar]
- Chawla D, Rees G, Friston KJ. The physiological basis of attentional modulation in extrastriate visual areas. Nat Neurosci 2: 671–676, 1999. doi: 10.1038/10230. [DOI] [PubMed] [Google Scholar]
- Chica AB, Valero-Cabré A, Paz-Alonso PM, Bartolomeo P. Causal contributions of the left frontal eye field to conscious perception. Cereb Cortex 24: 745–753, 2014. doi: 10.1093/cercor/bhs357. [DOI] [PubMed] [Google Scholar]
- Ciric R, Nomi JS, Uddin LQ, Satpute AB. Contextual connectivity: a framework for understanding the intrinsic dynamic architecture of large-scale functional brain networks. Sci Rep 7: 6537, 2017. doi: 10.1038/s41598-017-06866-w. [DOI] [PMC free article] [PubMed] [Google Scholar]
- Cisler JM, Bush K, Steele JS. A comparison of statistical methods for detecting context-modulated functional connectivity in fMRI. Neuroimage 84: 1042–1052, 2014. doi: 10.1016/j.neuroimage.2013.09.018. [DOI] [PMC free article] [PubMed] [Google Scholar]
- Cohen JR, D’Esposito M. The segregation and integration of distinct brain networks and their relationship to cognition. J Neurosci 36: 12083–12094, 2016. doi: 10.1523/JNEUROSCI.2965-15.2016. [DOI] [PMC free article] [PubMed] [Google Scholar]
- Cole MW, Bassett DS, Power JD, Braver TS, Petersen SE. Intrinsic and task-evoked network architectures of the human brain. Neuron 83: 238–251, 2014. doi: 10.1016/j.neuron.2014.05.014. [DOI] [PMC free article] [PubMed] [Google Scholar]
- Cole MW, Ito T, Schultz D, Mill R, Chen R, Cocuzza C. Task activations produce spurious but systematic inflation of task functional connectivity estimates. Neuroimage 189: 1–18, 2019. doi: 10.1016/j.neuroimage.2018.12.054. [DOI] [PMC free article] [PubMed] [Google Scholar]
- Corbetta M, Shulman GL. Control of goal-directed and stimulus-driven attention in the brain. Nat Rev Neurosci 3: 201–215, 2002. doi: 10.1038/nrn755. [DOI] [PubMed] [Google Scholar]
- Dehaene S, Changeux J-P. Experimental and theoretical approaches to conscious processing. Neuron 70: 200–227, 2011. doi: 10.1016/j.neuron.2011.03.018. [DOI] [PubMed] [Google Scholar]
- Desimone R, Duncan J. Neural mechanisms of selective visual attention. Annu Rev Neurosci 18: 193–222, 1995. doi: 10.1146/annurev.ne.18.030195.001205. [DOI] [PubMed] [Google Scholar]
- Dosenbach NUF, Fair DA, Miezin FM, Cohen AL, Wenger KK, Dosenbach RAT, Fox MD, Snyder AZ, Vincent JL, Raichle ME, Schlaggar BL, Petersen SE. Distinct brain networks for adaptive and stable task control in humans. Proc Natl Acad Sci USA 104: 11073–11078, 2007. doi: 10.1073/pnas.0704320104. [DOI] [PMC free article] [PubMed] [Google Scholar]
- Downar J, Crawley AP, Mikulis DJ, Davis KD. A multimodal cortical network for the detection of changes in the sensory environment. Nat Neurosci 3: 277–283, 2000. doi: 10.1038/72991. [DOI] [PubMed] [Google Scholar]
- Drakesmith M, Caeyenberghs K, Dutt A, Lewis G, David AS, Jones DK. Overcoming the effects of false positives and threshold bias in graph theoretical analyses of neuroimaging data. Neuroimage 118: 313–333, 2015. doi: 10.1016/j.neuroimage.2015.05.011. [DOI] [PMC free article] [PubMed] [Google Scholar]
- Duncan ES, Small SL. Increased modularity of resting state networks supports improved narrative production in aphasia recovery. Brain Connect 6: 524–529, 2016. doi: 10.1089/brain.2016.0437. [DOI] [PMC free article] [PubMed] [Google Scholar]
- Ekman M, Derrfuss J, Tittgemeyer M, Fiebach CJ. Predicting errors from reconfiguration patterns in human brain networks. Proc Natl Acad Sci USA 109: 16714–16719, 2012. doi: 10.1073/pnas.1207523109. [DOI] [PMC free article] [PubMed] [Google Scholar]
- Fair DA, Schlaggar BL, Cohen AL, Miezin FM, Dosenbach NUF, Wenger KK, Fox MD, Snyder AZ, Raichle ME, Petersen SE. A method for using blocked and event-related fMRI data to study “resting state” functional connectivity. Neuroimage 35: 396–405, 2007. doi: 10.1016/j.neuroimage.2006.11.051. [DOI] [PMC free article] [PubMed] [Google Scholar]
- Fornito A, Zalesky A, Bullmore E. Fundamentals of Brain Network Analysis. London, UK: Academic Press, 2016. [Google Scholar]
- Fries P, Reynolds JH, Rorie AE, Desimone R. Modulation of oscillatory neuronal synchronization by selective visual attention. Science 291: 1560–1563, 2001. doi: 10.1126/science.1055465. [DOI] [PubMed] [Google Scholar]
- Godwin D, Barry RL, Marois R. Breakdown of the brain’s functional network modularity with awareness. Proc Natl Acad Sci USA 112: 3799–3804, 2015. doi: 10.1073/pnas.1414466112. [DOI] [PMC free article] [PubMed] [Google Scholar]
- Han SW, Eaton HP, Marois R. Functional fractionation of the cingulo-opercular network: alerting insula and updating cingulate. Cereb Cortex 29: 2624–2638, 2019. doi: 10.1093/cercor/bhy130. [DOI] [PMC free article] [PubMed] [Google Scholar]
- Han SW, Marois R. Functional fractionation of the stimulus-driven attention network. J Neurosci 34: 6958–6969, 2014. doi: 10.1523/JNEUROSCI.4975-13.2014. [DOI] [PMC free article] [PubMed] [Google Scholar]
- Humphries MD, Gurney K. Network “small-world-ness”: a quantitative method for determining canonical network equivalence. PLoS One 3: e0002051, 2008. doi: 10.1371/journal.pone.0002051. [DOI] [PMC free article] [PubMed] [Google Scholar]
- Kahneman D Attention and Effort. Englewood Cliffs, NJ: Prentice Hall, 1973. [Google Scholar]
- Kahneman D, Beatty J. Pupil diameter and load on memory. Science 154: 1583–1585, 1966. doi: 10.1126/science.154.3756.1583. [DOI] [PubMed] [Google Scholar]
- Kastner S, Pinsk MA, De Weerd P, Desimone R, Ungerleider LG. Increased activity in human visual cortex during directed attention in the absence of visual stimulation. Neuron 22: 751–761, 1999. doi: 10.1016/S0896-6273(00)80734-5. [DOI] [PubMed] [Google Scholar]
- Kitzbichler MG, Henson RNA, Smith ML, Nathan PJ, Bullmore ET. Cognitive effort drives workspace configuration of human brain functional networks. J Neurosci 31: 8259–8270, 2011. doi: 10.1523/JNEUROSCI.0440-11.2011. [DOI] [PMC free article] [PubMed] [Google Scholar]
- Kleiner M, Brainard DH, Pelli DG. What’s new in Psychtoolbox-3? (Abstract). Perception 36, 1_suppl: 14, 2007. doi: 10.1177/03010066070360S101. [DOI] [Google Scholar]
- Latora V, Marchiori M. Efficient behavior of small-world networks. Phys Rev Lett 87: 198701, 2001. doi: 10.1103/PhysRevLett.87.198701. [DOI] [PubMed] [Google Scholar]
- Marois R, Leung HC, Gore JC. A stimulus-driven approach to object identity and location processing in the human brain. Neuron 25: 717–728, 2000. doi: 10.1016/S0896-6273(00)81073-9. [DOI] [PubMed] [Google Scholar]
- Medaglia JD, Lynall M-E, Bassett DS. Cognitive network neuroscience. J Cogn Neurosci 27: 1471–1491, 2015. doi: 10.1162/jocn_a_00810. [DOI] [PMC free article] [PubMed] [Google Scholar]
- Menon V Large-scale brain networks and psychopathology: a unifying triple network model. Trends Cogn Sci 15: 483–506, 2011. doi: 10.1016/j.tics.2011.08.003. [DOI] [PubMed] [Google Scholar]
- Menon V, Uddin LQ. Saliency, switching, attention and control: a network model of insula function. Brain Struct Funct 214: 655–667, 2010. doi: 10.1007/s00429-010-0262-0. [DOI] [PMC free article] [PubMed] [Google Scholar]
- Mucha PJ, Richardson T, Macon K, Porter MA, Onnela J-P. Community structure in time-dependent, multiscale, and multiplex networks. Science 328: 876–878, 2010. doi: 10.1126/science.1184819. [DOI] [PubMed] [Google Scholar]
- Nath AR, Beauchamp MS. Dynamic changes in superior temporal sulcus connectivity during perception of noisy audiovisual speech. J Neurosci 31: 1704–1714, 2011. doi: 10.1523/JNEUROSCI.4853-10.2011. [DOI] [PMC free article] [PubMed] [Google Scholar]
- Newman MEJ Analysis of weighted networks. Phys Rev E Stat Nonlin Soft Matter Phys 70: 056131, 2004. doi: 10.1103/PhysRevE.70.056131. [DOI] [PubMed] [Google Scholar]
- Newman MEJ Modularity and community structure in networks. Proc Natl Acad Sci USA 103: 8577–8582, 2006. doi: 10.1073/pnas.0601602103. [DOI] [PMC free article] [PubMed] [Google Scholar]
- Nicol RM, Chapman SC, Vértes PE, Nathan PJ, Smith ML, Shtyrov Y, Bullmore ET. Fast reconfiguration of high-frequency brain networks in response to surprising changes in auditory input. J Neurophysiol 107: 1421–1430, 2012. doi: 10.1152/jn.00817.2011. [DOI] [PMC free article] [PubMed] [Google Scholar]
- Oliveira CLN, Morais PA, Moreira AA, Andrade JSJ Jr. Enhanced flow in small-world networks. Phys Rev Lett 112: 148701, 2014. doi: 10.1103/PhysRevLett.112.148701. [DOI] [PubMed] [Google Scholar]
- Pavlov I Conditioned Reflexes: An Investigation of the Physiological Processes of the Cerebral Cortex. London, UK: Oxford University Press, 1927. [Google Scholar]
- Pelli DG The VideoToolbox software for visual psychophysics: transforming numbers into movies. Spat Vis 10: 437–442, 1997. doi: 10.1163/156856897X00366. [DOI] [PubMed] [Google Scholar]
- Power JD, Barnes KA, Snyder AZ, Schlaggar BL, Petersen SE. Spurious but systematic correlations in functional connectivity MRI networks arise from subject motion. Neuroimage 59: 2142–2154, 2012. [Erratum in Neuroimage 63: 999, 2012]. doi: 10.1016/j.neuroimage.2011.10.018. [DOI] [PMC free article] [PubMed] [Google Scholar]
- Power JD, Cohen AL, Nelson SM, Wig GS, Barnes KA, Church JA, Vogel AC, Laumann TO, Miezin FM, Schlaggar BL, Petersen SE. Functional network organization of the human brain. Neuron 72: 665–678, 2011. doi: 10.1016/j.neuron.2011.09.006. [DOI] [PMC free article] [PubMed] [Google Scholar]
- Reynolds JH, Chelazzi L. Attentional modulation of visual processing. Annu Rev Neurosci 27: 611–647, 2004. doi: 10.1146/annurev.neuro.26.041002.131039. [DOI] [PubMed] [Google Scholar]
- Reynolds JH, Chelazzi L, Desimone R. Competitive mechanisms subserve attention in macaque areas V2 and V4. J Neurosci 19: 1736–1753, 1999. doi: 10.1523/JNEUROSCI.19-05-01736.1999. [DOI] [PMC free article] [PubMed] [Google Scholar]
- Rissman J, Gazzaley A, D’Esposito M. Measuring functional connectivity during distinct stages of a cognitive task. Neuroimage 23: 752–763, 2004. doi: 10.1016/j.neuroimage.2004.06.035. [DOI] [PubMed] [Google Scholar]
- Rosenberg MD, Finn ES, Scheinost D, Constable RT, Chun MM. Characterizing attention with predictive network models. Trends Cogn Sci 21: 290–302, 2017. doi: 10.1016/j.tics.2017.01.011. [DOI] [PMC free article] [PubMed] [Google Scholar]
- Rouder JN, Morey RD, Speckman PL, Province JM. Default Bayes factors for ANOVA designs. J Math Psychol 56: 356–374, 2012. doi: 10.1016/j.jmp.2012.08.001. [DOI] [Google Scholar]
- Rubinov M, Sporns O. Complex network measures of brain connectivity: uses and interpretations. Neuroimage 52: 1059–1069, 2010. doi: 10.1016/j.neuroimage.2009.10.003. [DOI] [PubMed] [Google Scholar]
- Rubinov M, Sporns O. Weight-conserving characterization of complex functional brain networks. Neuroimage 56: 2068–2079, 2011. doi: 10.1016/j.neuroimage.2011.03.069. [DOI] [PubMed] [Google Scholar]
- Sadaghiani S, Kleinschmidt A. Functional interactions between intrinsic brain activity and behavior. Neuroimage 80: 379–386, 2013. doi: 10.1016/j.neuroimage.2013.04.100. [DOI] [PubMed] [Google Scholar]
- Sadaghiani S, Poline J-B, Kleinschmidt A, D’Esposito M. Ongoing dynamics in large-scale functional connectivity predict perception. Proc Natl Acad Sci USA 112: 8463–8468, 2015. doi: 10.1073/pnas.1420687112. [DOI] [PMC free article] [PubMed] [Google Scholar]
- Sara SJ, Bouret S. Orienting and reorienting: the locus coeruleus mediates cognition through arousal. Neuron 76: 130–141, 2012. doi: 10.1016/j.neuron.2012.09.011. [DOI] [PubMed] [Google Scholar]
- Satterthwaite TD, Wolf DH, Loughead J, Ruparel K, Elliott MA, Hakonarson H, Gur RC, Gur RE. Impact of in-scanner head motion on multiple measures of functional connectivity: relevance for studies of neurodevelopment in youth. Neuroimage 60: 623–632, 2012. doi: 10.1016/j.neuroimage.2011.12.063. [DOI] [PMC free article] [PubMed] [Google Scholar]
- Seeley WW, Menon V, Schatzberg AF, Keller J, Glover GH, Kenna H, Reiss AL, Greicius MD. Dissociable intrinsic connectivity networks for salience processing and executive control. J Neurosci 27: 2349–2356, 2007. doi: 10.1523/JNEUROSCI.5587-06.2007. [DOI] [PMC free article] [PubMed] [Google Scholar]
- Serences JT, Shomstein S, Leber AB, Golay X, Egeth HE, Yantis S. Coordination of voluntary and stimulus-driven attentional control in human cortex. Psychol Sci 16: 114–122, 2005. doi: 10.1111/j.0956-7976.2005.00791.x. [DOI] [PubMed] [Google Scholar]
- Sestieri C, Corbetta M, Spadone S, Romani GL, Shulman GL. Domain-general signals in the cingulo-opercular network for visuospatial attention and episodic memory. J Cogn Neurosci 26: 551–568, 2014. doi: 10.1162/jocn_a_00504. [DOI] [PMC free article] [PubMed] [Google Scholar]
- Shine JM, Bissett PG, Bell PT, Koyejo O, Balsters JH, Gorgolewski KJ, Moodie CA, Poldrack RA. The dynamics of functional brain networks: integrated network states during cognitive task performance. Neuron 92: 544–554, 2016. doi: 10.1016/j.neuron.2016.09.018. [DOI] [PMC free article] [PubMed] [Google Scholar]
- Shulman GL, Ollinger JM, Akbudak E, Conturo TE, Snyder AZ, Petersen SE, Corbetta M. Areas involved in encoding and applying directional expectations to moving objects. J Neurosci 19: 9480–9496, 1999. doi: 10.1523/JNEUROSCI.19-21-09480.1999. [DOI] [PMC free article] [PubMed] [Google Scholar]
- Siegel JS, Power JD, Dubis JW, Vogel AC, Church JA, Schlaggar BL, Petersen SE. Statistical improvements in functional magnetic resonance imaging analyses produced by censoring high-motion data points. Hum Brain Mapp 35: 1981–1996, 2014. doi: 10.1002/hbm.22307. [DOI] [PMC free article] [PubMed] [Google Scholar]
- Sokolov EN Higher nervous functions; the orienting reflex. Annu Rev Physiol 25: 545–580, 1963. doi: 10.1146/annurev.ph.25.030163.002553. [DOI] [PubMed] [Google Scholar]
- Spadone S, Della Penna S, Sestieri C, Betti V, Tosoni A, Perrucci MG, Romani GL, Corbetta M. Dynamic reorganization of human resting-state networks during visuospatial attention. Proc Natl Acad Sci USA 112: 8112–8117, 2015. doi: 10.1073/pnas.1415439112. [DOI] [PMC free article] [PubMed] [Google Scholar]
- Sporns O, Betzel RF. Modular brain networks. Annu Rev Psychol 67: 613–640, 2016. doi: 10.1146/annurev-psych-122414-033634. [DOI] [PMC free article] [PubMed] [Google Scholar]
- Stevens AA, Skudlarski P, Gatenby JC, Gore JC. Event-related fMRI of auditory and visual oddball tasks. Magn Reson Imaging 18: 495–502, 2000. doi: 10.1016/S0730-725X(00)00128-4. [DOI] [PubMed] [Google Scholar]
- Stevens MC, Calhoun VD, Kiehl KA. fMRI in an oddball task: effects of target-to-target interval. Psychophysiology 42: 636–642, 2005. doi: 10.1111/j.1469-8986.2005.00368.x. [DOI] [PubMed] [Google Scholar]
- Talairach J, Tournoux P. Co-Planar Stereotaxic Atlas of the Human Brain: 3-Dimensional Approach System: an Approach to Cerebral Imaging. New York: Theime Medical, 1988. [Google Scholar]
- Tracy JI, Mohamed F, Faro S, Tiver R, Pinus A, Bloomer C, Pyrros A, Harvan J. The effect of autonomic arousal on attentional focus. Neuroreport 11: 4037–4042, 2000. doi: 10.1097/00001756-200012180-00027. [DOI] [PubMed] [Google Scholar]
- Tran SM, McGregor KM, James GA, Gopinath K, Krishnamurthy V, Krishnamurthy LC, Crosson B. Task-residual functional connectivity of language and attention networks. Brain Cogn 122: 52–58, 2018. doi: 10.1016/j.bandc.2018.02.003. [DOI] [PMC free article] [PubMed] [Google Scholar]
- Uddin LQ Salience processing and insular cortical function and dysfunction. Nat Rev Neurosci 16: 55–61, 2015. doi: 10.1038/nrn3857. [DOI] [PubMed] [Google Scholar]
- van den Heuvel MP, Stam CJ, Boersma M, Hulshoff Pol HE. Small-world and scale-free organization of voxel-based resting-state functional connectivity in the human brain. Neuroimage 43: 528–539, 2008. doi: 10.1016/j.neuroimage.2008.08.010. [DOI] [PubMed] [Google Scholar]
- Van Dijk KRA, Sabuncu MR, Buckner RL. The influence of head motion on intrinsic functional connectivity MRI. Neuroimage 59: 431–438, 2012. doi: 10.1016/j.neuroimage.2011.07.044. [DOI] [PMC free article] [PubMed] [Google Scholar]
- van Wijk BCM, Stam CJ, Daffertshofer A. Comparing brain networks of different size and connectivity density using graph theory. PLoS One 5: e13701, 2010. doi: 10.1371/journal.pone.0013701. [DOI] [PMC free article] [PubMed] [Google Scholar]
- Watkins S, Dalton P, Lavie N, Rees G. Brain mechanisms mediating auditory attentional capture in humans. Cereb Cortex 17: 1694–1700, 2007. doi: 10.1093/cercor/bhl080. [DOI] [PubMed] [Google Scholar]
- Watts DJ, Strogatz SH. Collective dynamics of “small-world” networks. Nature 393: 440–442, 1998. doi: 10.1038/30918. [DOI] [PubMed] [Google Scholar]
- Wig GS Segregated systems of human brain networks. Trends Cogn Sci 21: 981–996, 2017. doi: 10.1016/j.tics.2017.09.006. [DOI] [PubMed] [Google Scholar]
- Womelsdorf T, Fries P, Mitra PP, Desimone R. Gamma-band synchronization in visual cortex predicts speed of change detection. Nature 439: 733–736, 2006. doi: 10.1038/nature04258. [DOI] [PubMed] [Google Scholar]
- Wu EXW, Liaw GJ, Goh RZ, Chia TTY, Chee AMJ, Obana T, Rosenberg MD, Yeo BTT, Asplund CL. Overlapping attentional networks yield divergent behavioral predictions across tasks: neuromarkers for diffuse and focused attention? Neuroimage 209: 116535, 2020. doi: 10.1016/j.neuroimage.2020.116535. [DOI] [PubMed] [Google Scholar]
- Yantis S, Schwarzbach J, Serences JT, Carlson RL, Steinmetz MA, Pekar JJ, Courtney SM. Transient neural activity in human parietal cortex during spatial attention shifts. Nat Neurosci 5: 995–1002, 2002. doi: 10.1038/nn921. [DOI] [PubMed] [Google Scholar]