Abstract
Alzheimer's disease (AD) is the most common neurodegenerative disease among the elderly and has become a growing global health problem causing great concern. However, the pathogenesis of AD is unclear and no specific therapeutics are available to provide the sustained remission of the disease. In this study, we used comprehensive bioinformatics to determine 158 potential genes, whose expression levels changed between the entorhinal and temporal lobe cortex samples from cognitively normal individuals and patients with AD. Then, we clustered these genes in the protein-protein interaction analysis and identified six significant genes that had more biological functions. Besides, we conducted a drug-gene interaction analysis of module genes in the drug-gene interaction database and obtained 26 existing drugs that might be applied for the prevention and treatment of AD. In addition, a predictive model was built based on the selected genes using different machine learning algorithms to identify individuals with AD. These findings may provide new insights into AD therapy.
1. Introduction
Alzheimer's disease (AD) is the most common neurodegenerative disease among the elderly and has become a growing global health problem of great concern [1]. The most typical clinical manifestations of AD are progressive memory loss and cognitive function decline. Currently, there are approximately 47 million individuals who suffer from dementia across the globe, and the number is expected to increase to 100 million by 2050 [2]. AD is undoubtedly the most prevalent form of dementia. The significant development among societies, the increased rate of ageing, and the increased life expectancy of the population have contributed to the steady increase in the prevalence of AD.
At the early stage, the most characteristic symptoms of AD are mild memory loss and fatigue, anxiety, or negative emotions. Then, the memory impairment is aggravated and the logical thinking and comprehensive analysis abilities decrease. As the condition worsens, the cognitive impairment becomes more serious and widespread, making the person incapable of simple daily life tasks such as dressing and eating; at this time, the individual may be diagnosed with AD dementia. Later in the disease, patients suffer from impaired mobility, hallucinations, and seizures. The average duration from symptom onset to death is 8.5 years [3]. At present, the underlying mechanism of AD is unclear and may be associated with pathological processes such as the deposition of extracellular amyloid-β (Aβ) plaques and intracellular neurofibrillary tangles in the brain [4, 5]. AD pathology is confirmed in the entorhinal and temporal cortexes. A previous study identified that the expression of genes highly correlates with AD tau pathology and is most significantly increased in the entorhinal cortex, followed by the temporal cortex [6]; tau pathology usually begins in the medial temporal lobe (entorhinal cortex and hippocampus) in the allogeneic cortex. It is generally believed that the entorhinal cortex is the earliest brain structure with pathological changes in AD, while layer II of the entorhinal cortex is one of the most severely affected structures in AD [7, 8]. Furthermore, the brains of AD patients also show greater volume loss in the entorhinal cortex [9]. However, no specific therapeutics are currently available to provide the sustained remission of AD.
Traditionally, the glutamatergic system is considered the major factor affecting AD progression. All currently approved clinical drugs for AD are modulators, targeting cholinergic and glutamatergic systems, but they do not lead to the sustained remission of AD. Evidence suggests that modifying risk-added lifestyles and initiating drug and nondrug therapies in the early stage of the disease help maintain self-care ability and significantly reduce the burden of disease management. However, these changes do not alter the outcome of the disease [10]. Therefore, early AD identification and intervention are top priorities worldwide. As revealed in recent years, bioinformatics plays an important role in disease diagnosis and treatment [11].
In this study, we used comprehensive bioinformatics to determine the potential genes whose expression levels were different between the entorhinal and temporal lobe cortex samples from cognitively normal individuals and patients with AD. Then, we clustered these genes for the protein-protein interaction (PPI) analysis and identified significant genes that had more biological functions. Besides, we conducted the drug-gene interaction analysis of module genes using the drug-gene interaction database (DGIdb), which might contribute towards matching some existing drugs and subsequently finding alternatives for the prevention and treatment of AD. In addition, a predictive model was built based on the selected genes using different machine learning algorithms to identify individuals with AD. The workflow of the analysis is schematically shown in Figure 1.
Figure 1.
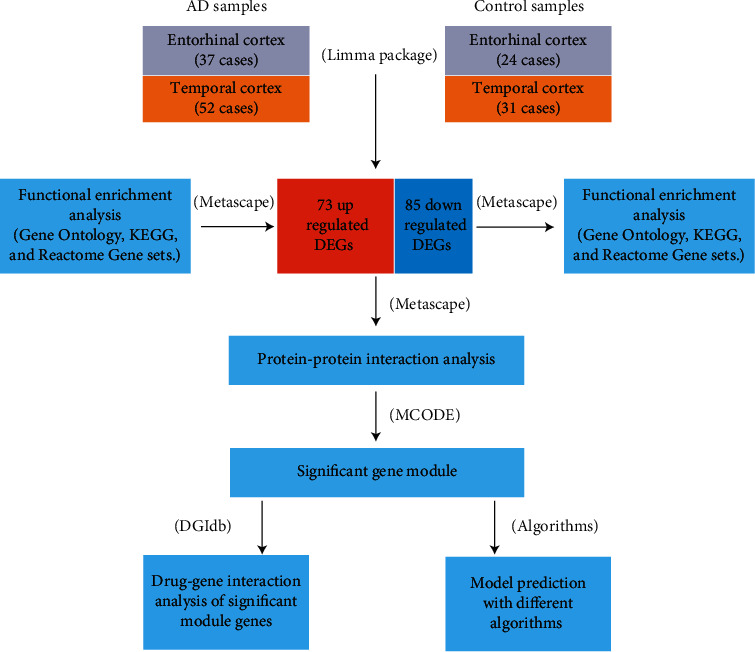
An overview workflow of this study.
2. Materials and Methods
2.1. Microarray Data Analysis
GSE118553 expression profiles and related clinical information data were retrieved and obtained from the NCBI-GEO website (https://www.ncbi.nlm.nih.gov/geo/) [6]. Entorhinal tissue samples (37 AD and 24 control samples) and temporal tissue samples (52 AD and 31 control samples) were included in the dataset. The corresponding GPL10558 platform annotation file included more than 31,000 annotated genes with more than 47,000 probes that were applied to convert the probes into target gene samples. If the target gene was annotated with two or more probes, the mean value was calculated. Among the targeted genes, the protein-coding genes were selected by referring to the human genome assembly GRCh38. Then, the Limma package [12] for the R environment was used to detect the differentially expressed genes (DEGs) between the AD and control samples of both entorhinal and temporal cortex tissues. DEGs were screened with the following cut-off criteria: [log2 fold change (FC)] > 0.5 and P value < 0.05. Overlapping DEGs between two brain regions were obtained using the Venn diagram packages [13, 14] in the R environment.
2.2. DEG Functional Enrichment Analysis
Gene enrichment analysis of DEGs was performed on the web-based portal Metascape (http://metascape.org/) [15], using the Gene Ontology biological process and the Kyoto Encyclopedia of Genes and Genomes (KEGG) pathway. The top ten enrichment terms were visualized using ggplot2 [16] package in R.
2.3. Protein-Protein Interaction Enrichment Analysis
For all the DEGs, PPI network analysis was conducted on Metascape using the following databases: BioGrid [17], InWeb_IM [17], and OmniPath [18]. In addition, if the network contained 3–500 proteins, the Molecular Complex Detection (MCODE) algorithm was applied to identify densely connected network components [18]. Pathway and process enrichment analyses were applied to each MCODE component independently, and the three best-scoring terms (based on the P value) were retained as the functional description of the corresponding components. Genes in each MCODE analysis were identified as potential target genes in AD prognosis and used for drug-gene interaction analysis and predictive model construction.
2.4. Drug-Gene Interaction Analysis
To explore the potential applications of the existing AD drugs, we designed an interactive model to identify interactions between genes and the existing drugs. Module genes were substituted into the drug-gene database (DGIdb: https://www.dgidb.org) [19] as potential targets to search for existing agonists or inhibitors. The FDA-approved drugs with antagonist or agonist functions were screened, and the interactions between the selected drugs and corresponding target genes were visualized in Cytoscape (version 3.7.1) [20].
2.5. Model Prediction
To explore whether MCODE genes have a function in the identification of AD samples, we built a prediction model using several machine learning algorithms depending on MCODE genes. Support Vector Machines (SVM) [21], Decision Tree [22], Random Forest [23], K-Nearest Neighbors (KNN) [24], and Naïve Bayes [25] were used. Considering the small sample size of this study, dividing the data into a training set, test set, and validation set was not appropriate. Therefore, to make the best use of the data, we applied a fivefold cross-validation method, which divided the data into five mutually exclusive subsets of similar size [26]. One of the subsets was selected as the test set and the other four subsets were used as the training set. Subsequently, five different results were obtained; finally, the average of the five test results was obtained. We used model evaluation indexes, such as accuracy, precision, recall, F1 score, and area under the curve (AUC) which were calculated as the evaluation matrices for the model. The model with the best performance was selected and deemed to have the ability to predict individuals with AD; if the performance of any two models was similar, the model with the larger AUC was considered as the best one. The AUC was used as a quantitative measure of the model quality, which was classified as poor (0.5–0.6), average (0.6–0.7), good (0.7–0.8), very good (0.8–0.9), and excellent (0.9–1). A better model was indicated with a higher AUC value, and a perfect model was indicated by an AUC value of 1 [1, 27]. Both model building and model performance assessment were performed using the Scikit-Learn library, which contains multiple machine learning algorithms in Python.
3. Results
3.1. DEG Identification
The differential expression analysis showed 691 upregulated and 636 downregulated genes in the entorhinal cortex that were detected based on the following cut-off criteria: ∣log2 fold change (FC) | >0.5 and P value < 0.05, as well as 116 upregulated and 243 downregulated genes that were identified in the temporal lobe cortex. Among the DEGs, 158 overlapping DEGs present in both regions of the brain were obtained using the Venn diagram package, including 73 upregulated and 85 downregulated genes (Figure 2, Table 1).
Figure 2.
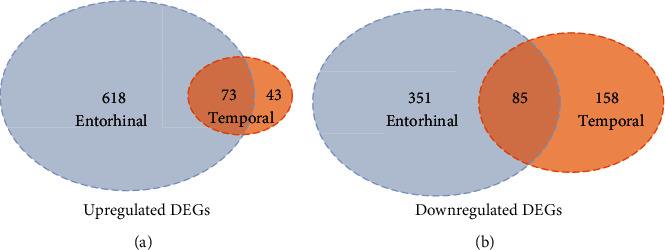
Overlapping DEGs across the entorhinal cortex and the temporal cortex. (a) 73 overlapping upregulated DEGs across the entorhinal cortex and the temporal cortex. (b) 85 overlapping downregulated DEGs across the entorhinal cortex and the temporal cortex.
Table 1.
158 DEGs both in the entorhinal cortex and the temporal cortex.
| DEGs | Gene name |
|---|---|
| Upregulated DEGs (73) | C1QTNF5, ITGB4, SYTL4, LAMB2, ANTXR2, COLEC12, TNS3, PPIC, C4B, INS-IGF2, ABCC4, SLC15A3, YAP1, DUSP1, FAM89A, ITPKB, NWD1, ASCL1, NOTCH2, AEBP1, CHST6, QPRT, DDIT4L, AKR1C3, IPO8, EPS8, WWTR1, PCDH18, GAS1, DSE, DCN, DST, EZR, SCARA3, TEAD2, BACE2, APLNR, COL6A3, LTBP1, IL13RA1, ITGB8, NOTCH3, FPR3, CDC14A, PLXNB1, RASL12, EMP3, ACTA2, PGR, CD44, PIPOX, HEPH, SLC13A4, BDH2, GEM, MT1F, HHAT, ERMAP, ITGA10, CCL2, RIN2, SERPINA3, GPR4, GFAP, EDNRA, KLF2, CAV1, TTR, SRGN, MYH11, SALL3, FOXQ1, MT1H |
|
| |
| Downregulated DEGs (85) | GAS7, TAGLN3, RPH3A, SYNGR1, PRKCZ, RASGRF1, KLC1, MICAL2, NEFM, SEZ6L2, VSNL1, COQ4, CRYM, NEFL, GABRB2, SVOP, RPRML, PJA1, SULT4A1, BBS9, DOT1L, ABCC8, TSPY3, ITIH3, TNKS2, PIGV, ATP6V1G2, TMEM174, HPRT1, CXCL3, CORO6, CLMN, RPL36A, PDIA2, DYRK2, GRK4, FGF12, GABRA1, CYP4X1, SCN2A, CDKN2C, UBE2J2, MDK, SNAP25, CKMT1B, GAK, GABRG2, ARRDC2, SCN2B, R3HDM1, CAMTA1, PCDH10, TUBB3, FBXO2, FOXE3, C10orf82, USP20, KRT32, CLEC2L, SH3GL2, CYP1A1, PAK1, KLK11, NRXN3, FGF9, PCSK1, PNMA3, VIP, RGS7, OPCML, INA, ADCYAP1, RGS4, NUDT10, SPHKAP, ST8SIA3, MYT1L, GAD1, ANO3, GPR26, GABRD, NCALD, EIF1AY, CHGB, SYT1 |
3.2. Functional Enrichment Analysis of DEGs
To outline GO and functional enrichments of overlapping DEGs, we applied Metascape and executed BP annotation and KEGG analysis of 73 overlapping and upregulated and 85 overlapping and downregulated DEGs, respectively. The top ten most significant results are shown in Figure 3, except for the downregulated DEGs only enriched in eight terms of the pathways. In the BP category, downregulated genes were mainly involved in anterograde transsynaptic signaling, chemical synaptic transmission, and transsynaptic signaling; upregulated genes were enriched in epithelial cell differentiation involved in kidney development, blood vessel development, and extracellular matrix organization. With regard to KEGG signaling pathway enrichment, downregulated genes were mainly related to nicotine addiction, GABAergic synapse, and morphine addiction; upregulated genes were significantly involved in ECM-receptor interaction, focal adhesion, and Hippo signaling pathways.
Figure 3.
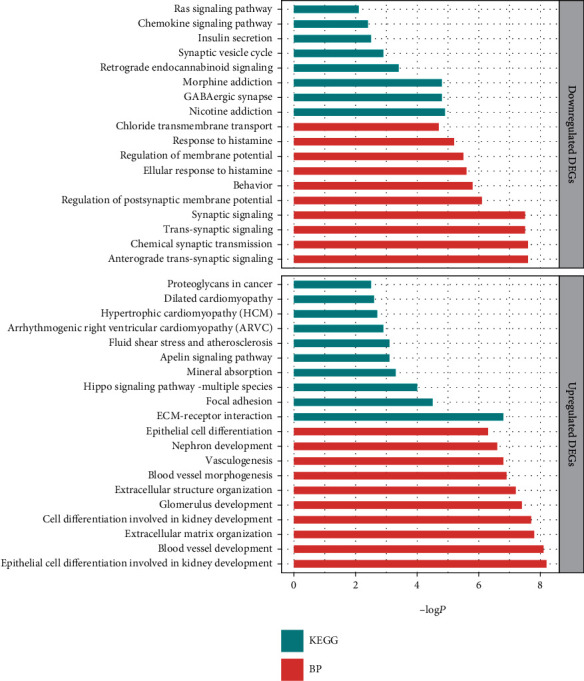
Top 10 BP and KEGG analysis terms of overlapping DEGs. BP: biological process; KEGG: Kyoto Encyclopedia of Genes and Genomes.
3.3. Protein-Protein Interaction Enrichment Analysis
PPI analysis of DEGs was performed in Metascape [15], and two significant gene modules were selected using the MCODE application; each module consisted of three MCODE genes (Table 2). The genes in MCODE_1 were significantly enriched in peptide ligand-binding receptors, class A/1 (rhodopsin-like receptors), and G alpha (i) signaling event processes. The MCODE_2 genes were significantly enriched in the GABA-A receptor and cellular response to histamine processes. The expression of the six MCODE genes in the entorhinal and temporal cortexes is displayed in Figure 4; it contained two upregulated (FPR3 and APLNR) and four downregulated genes (CXCL3, gamma-aminobutyric acid type A receptor subunit beta 2 (GABRB2), gamma-aminobutyric acid type A receptor subunit gamma 2 (GABRG2), and gamma-aminobutyric acid type A receptor subunit alpha 1 (GABRA1)).
Table 2.
Three best-scoring pathway and process enrichment analysis terms of each MCODE component.
| MCODE | Genes | GO | Description | log10(P) |
|---|---|---|---|---|
| MCODE_1 | FPR3 CXCL3 APLNR |
R-HSA-375276 | Peptide ligand-binding receptors | -6.3 |
| R-HSA-373076 | Class A/1 (rhodopsin-like receptors) | -5.6 | ||
| R-HSA-418594 | G alpha (i) signaling events | -5.3 | ||
|
| ||||
| MCODE_2 | GABRB2 GABRG2 GABRA1 |
CORUM:7461 | GABA-A receptor (GABRA1, GABRB2, and GABRG2) | -12.4 |
| CORUM:5809 | GABA-A receptor (GABRA1, GABRB2, and GABRG2) | -12.4 | ||
| GO:0071420 | Cellular response to histamine | -10.6 | ||
Figure 4.
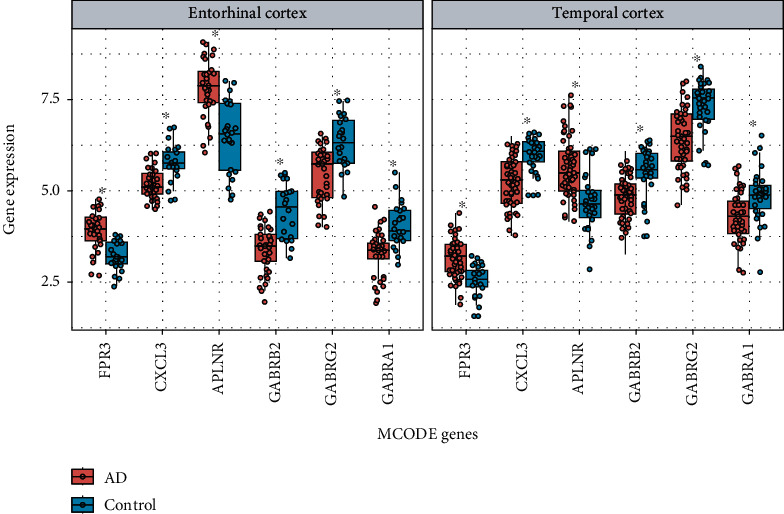
Expression of 6 MCODE genes in the entorhinal cortex and the temporal cortex, respectively (∗P < 0.05).
3.4. Drug-Gene Interaction Analysis
The six MCODE genes clustered in the significant gene module were selected to perform drug-gene interaction analysis, which was aimed at looking for FDA-approved agonists and antagonists in the DGIdb database. We found that there were four target genes to 29 potential existing drugs. Moreover, 3 undefined drugs were removed, and 26 drugs that were agonists or antagonists were obtained, including two for formyl peptide receptor 3 (FPR3), 23 for GABRA1, two for GABRB2, and two for GABRG2. Psychiatric drugs with known indications accounted for the majority. We found that among the obtained drugs, ethchlorvynol and flumazenil act on GABRB2 and GABRG2, respectively; both also act on GABRA1. Meprobamate acts on both GABRB2 and GABRG2 (Figure 5, Table 3).
Figure 5.
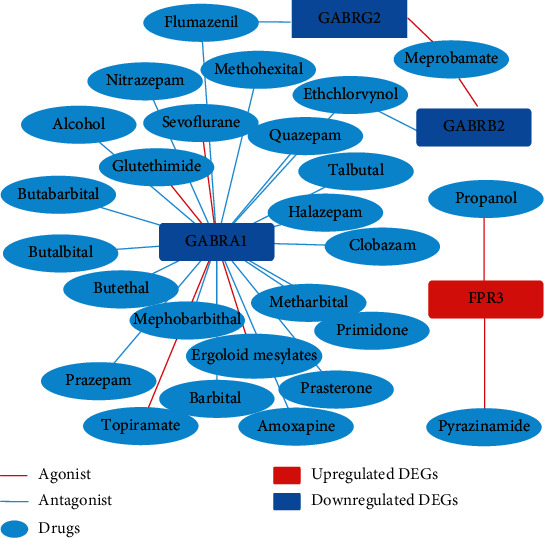
Drug-gene interaction.
Table 3.
Gene-drug interaction information by mapping in the DGIdb database.
| Gene | Drugs | Interaction | Gene | Drugs | Interaction |
|---|---|---|---|---|---|
| FPR3 | Propanol | Agonist | GABRA1 | Prasterone | Antagonist |
| FPR3 | Pyrazinamide | Agonist | GABRA1 | Butethal | Antagonist |
| GABRB2 | Ethchlorvynol | Antagonist | GABRA1 | Mephobarbital | Antagonist |
| GABRB2 | Meprobamate | Agonist | GABRA1 | Clobazam | Antagonist |
| GABRG2 | Meprobamate | Agonist | GABRA1 | Sevoflurane | Agonist |
| GABRG2 | Flumazenil | Antagonist | GABRA1 | Methohexital | Antagonist |
| GABRA1 | Topiramate | Agonist | GABRA1 | Metharbital | Antagonist |
| GABRA1 | Halazepam | Antagonist | GABRA1 | Alcohol | Antagonist |
| GABRA1 | Amoxapine | Antagonist | GABRA1 | Primidone | Antagonist |
| GABRA1 | Butalbital | Antagonist | GABRA1 | Ergoloid mesylates | Agonist |
| GABRA1 | Talbutal | Antagonist | GABRA1 | Nitrazepam | Antagonist |
| GABRA1 | Quazepam | Antagonist | GABRA1 | Butabarbital | Antagonist |
| GABRA1 | Glutethimide | Agonist | GABRA1 | Flumazenil | Antagonist |
| GABRA1 | Prazepam | Antagonist | GABRA1 | Barbital | Antagonist |
| GABRA1 | Ethchlorvynol | Antagonist |
3.5. Model Prediction
In total, 144 results for the gene expression in brain tissues were selected for the model construction using five algorithms and tested using fivefold cross-validation. The performance of the models is displayed in Table 4 and Figure 6. The fivefold cross-validation test showed that the SVM, Naïve Bayes, and Random Forest algorithms performed well. Then, we compared the uniformity of each algorithm's AUC in its category and chose the best performing model. The Naïve Bayes predictive model showed the highest AUC (82.45%) compared to the other two models (SVM: 81.15%, Random Forest: 77.25%), indicating that it had a good capability of predicting individuals with AD.
Table 4.
Prediction results based on different algorithms.
| Algorithms | Accuracy (%) | Precision (%) | Recall (%) | F1 score (%) | AUC (%) |
|---|---|---|---|---|---|
| Naive Bayes | 77.14 | 80.41 | 83.33 | 81.45 | 82.45 |
| SVM | 77.07 | 78.11 | 87.71 | 82.42 | 81.15 |
| Random Forest | 75.71 | 78.46 | 84.38 | 81.07 | 77.25 |
| KNN | 74.29 | 81.59 | 77.65 | 78.72 | 74.77 |
| Decision Tree | 57.04 | 64.45 | 66.54 | 65.26 | 54.18 |
Figure 6.
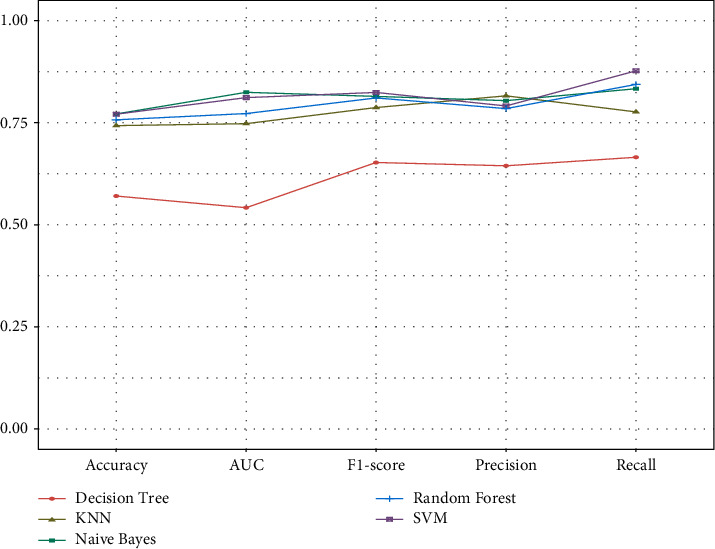
Prediction results based on different algorithms.
4. Discussion
AD is a common dementia with the highest fatality among the elderly, and the incidence of this disease shows a positive correlation trend with the patient's age. Age, gender, and genetics are unregulated factors that affect the occurrence of AD. Genetics plays an important role in the occurrence of AD. Presenilin 1, presenilin 2, and the amyloid precursor protein were identified to contribute or to be responsible for family AD [28]. Amyloid plaques, tau tangles, and neuron loss are characteristics of the AD brain [4], but the molecular changes underpinning these pathological features have not been fully elucidated. In recent years, transcriptomics has played an important role in revealing the pathogenesis of the disease and finding targeted drugs. Revealing the characterization of transcriptional alterations of the brain during disease development might offer some insights into the pathogenesis of AD. The purpose of this study was to discover potential mechanisms and hub genes in AD prognosis through the analysis of the transcriptional alteration in the entorhinal and temporal cortexes between AD and normal samples using bioinformatics methods.
In this study, according to the gene-drug interaction analysis, we found 26 potential drugs for AD treatment, which target four genes (FPR3, GABRB2, GABRG2, and GABRA1). FPR3, also known as FPRL2, is a member of the FPR family localized within the cytoplasm [29]. Human FPRs belong to the G protein-coupled chemoattractant receptors, which are expressed in blood innate immune cells, including neutrophils, monocytes, and natural killer (NK) cells, playing an important role in infection and inflammation. Interestingly, it has been reported that another subtype of the FPR family, FPRL1, can be specifically activated by Αβ42, suggesting that FPRL1 may be involved in the pathological process of neurodegenerative diseases such as AD [30]. GABRB2 encodes the β2 subunit of the gamma-aminobutyric acid type A (GABA-A) receptor, which regulates the intracellular Ca2+ concentration and plays an important role in the nervous system [31]. Some researchers believe that GABRB2 is related to schizophrenia [32, 33], but this view is widely controversial. GABRG2 encodes the GABA-A receptor subunit γ2. Mutation of this gene contributes to the pathogenesis of both febrile seizures and childhood absence epilepsy [34]. GABRA1 encodes the GABA-A receptor subunit α1. It is confirmed that GABRA1 mutation predisposes humans towards a common idiopathic generalized epilepsy syndrome [35].
GABA is the main inhibitory neurotransmitter in the mammalian brain, while the GABA-A receptor is the multi-subunit chloride channel that mediates the fastest inhibitory synaptic transmission in the central nervous system. The genes selected through our research are closely related to the GABA-A receptor. β2, γ2, and α1 subunits, which are encoded by GABAB2, GABAG2, and GABRA1, respectively, are the most abundant receptor forms (α1β2γ2) in the brain. Patients with AD exhibit nonamnestic manifestations, such as depression, anxiety, and sleep disorders, which may be attributed to GABAergic dysfunction [36]. The balance of excitatory and inhibitory signaling governs the function of the nervous system. The destruction of GABAergic neurons and GABA receptors disrupts the excitatory/inhibitory (E/I) balance, which is a crucial mechanism involved in epilepsy and seizures. The seizure rate of patients with AD significantly increases compared with that of normal people [37], and the stability of the neural network in the AD brain is decreased, suggesting that the E/I imbalance is strongly related to the pathogenesis of AD. Researchers have studied the pathogenic factors Aβ, BACAE1, and APOEε4 [38] and hyperactive glial cells [39] and concluded that all result in GABAergic dysfunction and E/I imbalance in AD mouse models [40]. More importantly, correcting the E/I imbalance improves the cognitive dysfunction in mice with AD. Besides, ageing is the strongest risk factor for AD and is related to GABAergic damage, which may lead to cognitive decline in rodents and primates. The prevalence of AD in females is higher than that in males; further, there are obvious sex-based differences in GABAergic signaling and progression of AD. These findings indicate that GABAergic dysfunction may be involved in AD pathogenesis and our work supports this view.
Traditionally, the GABAergic system is believed to be relatively conserved throughout AD progression, while the dysfunction of the glutamatergic system is considered as the major factor responsible for AD. Currently approved clinical drugs for AD are modulators of the cholinergic and glutamatergic targets, but their effects are limited, suggesting that other drugs are needed to restore the E/I imbalance. Presently, the GABAergic dysfunction is thought to be a significant cause of E/I imbalance and pathogenesis in the AD brain, making it a potential therapeutic target. The GABA-A receptor has already been identified as a prolific target for some therapeutic drugs, including benzodiazepines, barbiturates, anesthetics, and ethanol [41]. It has been found that a low dose of benzodiazepine clonazepam (0.05 mg/kg) is beneficial to AD [42], and a daily peritoneal injection of the GABA-A receptor potentiator pentobarbital sodium rescues the learning and memory impairment in ApoE4-Ki mice, while the GABA-A receptor antagonist reverses this rescue [30]. To restore the E/I balance, five agonists (meprobamate, topiramate, glutethimide, sevoflurane, and ergoloid mesylates) targeting the GABA-A receptor are useful in AD, while the rest of the antagonists may be related to the aggravation of the cognitive impairment. Therefore, our work may have important indications in the use of these drugs from a new perspective.
To detect the predictive function in identified AD samples based on the selected MCODE genes and build the predictive model, five different algorithms usually used in machine learning to solve supervised binary classification problems were applied. In total, results from the expression of 144 genes in brain tissues were used for model establishment. According to the 5-fold cross-validation method results, the SVM, Naïve Bayes, and Random Forest algorithms performed well. Among the models, the AUC of the Naïve Bayes algorithm in AD classification was superior to that of the other methods, indicating that this model may be applied in AD diagnosis. It also implied that the MCODE genes might play a critical role in AD prognosis.
5. Conclusions
In conclusion, we obtained six hub genes (FPR3, CXCL3, APLNR, GABRB2, GABRG2, and GABRA1) and 26 FDA-approved existing drugs through the application of an integrated bioinformatics approach. These findings may provide new insights into AD therapy. The risk prediction model we have established can be applied to the early screening of high-risk populations and provide disease management and drug intervention in the early stage. This strategy may significantly delay the development of AD, improve the quality of life of AD patients, and reduce the social burden associated with such conditions. We expect to conduct molecular experiments and clinical trials to confirm the results of this research.
Acknowledgments
The authors are grateful to the providers who submitted the data to the public databases. We acknowledge the National Natural Science Foundation of China (grant number 81600921 to Cheng Li) and the Natural Science Foundation of Shanghai (grant number 20ZR1442900 to Cheng Li) for providing funding support to the current work.
Contributor Information
Xuan Zhao, Email: zhaoxuan1026@hotmail.com.
Cheng Li, Email: chengli_2017@tongji.edu.cn.
Data Availability
The data used to support the findings of this study are from previously reported studies and datasets, which have been cited.
Conflicts of Interest
The authors declare no conflict of interest.
Authors' Contributions
Qi Jing and Hui Zhang had accessed all data in the study and assume responsibility for the integrity of the data and accuracy of the data analysis. Xuan Zhao and Cheng Li conceptualized and designed the study. Qi Jing, Hui Zhang, Xiaoru Sun, Yaru Xu, Silu Cao, and Yiling Fang drafted the figures and manuscript. All authors critically revised the manuscript for important intellectual content. Qi Jing and Hui Zhang contributed equally to this work.
References
- 1.Hu Y., Zhou G., Zhang C., et al. Identify compounds’ target against Alzheimer’s disease based on in-silico approach. Current Alzheimer Research. 2019;16(3):193–208. doi: 10.2174/1567205016666190103154855. [DOI] [PubMed] [Google Scholar]
- 2.Maia M. A., Sousa E. BACE-1 and γ-secretase as therapeutic targets for Alzheimer’s disease. Pharmaceuticals (Basel, Switzerland) 2019;12(1):p. 41. doi: 10.3390/ph12010041. [DOI] [PMC free article] [PubMed] [Google Scholar]
- 3.Jost B. C., Grossberg G. T. The natural history of Alzheimer’s disease: a brain bank study. Journal of the American Geriatrics Society. 1995;43(11):1248–1255. doi: 10.1111/j.1532-5415.1995.tb07401.x. [DOI] [PubMed] [Google Scholar]
- 4.Serrano-Pozo A., Frosch M. P., Masliah E., Hyman B. T. Neuropathological alterations in Alzheimer disease. Cold Spring Harbor Perspectives in Medicine. 2011;1(1, article a006189) doi: 10.1101/cshperspect.a006189. [DOI] [PMC free article] [PubMed] [Google Scholar]
- 5.Xie J., Liang R., Wang Y., Huang J., Cao X., Niu B. Progress in target drug molecules for Alzheimer’s disease. Current Topics in Medicinal Chemistry. 2020;20(1):4–36. doi: 10.2174/1568026619666191203113745. [DOI] [PubMed] [Google Scholar]
- 6.Patel H., Hodges A. K., Curtis C., et al. Transcriptomic analysis of probable asymptomatic and symptomatic Alzheimer brains. Brain, Behavior, and Immunity. 2019;80:644–656. doi: 10.1016/j.bbi.2019.05.009. [DOI] [PubMed] [Google Scholar]
- 7.Price J. L., Ko A. I., Wade M. J., Tsou S. K., McKeel D. W., Morris J. C. Neuron number in the entorhinal cortex and CA1 in preclinical Alzheimer disease. Archives of Neurology. 2001;58(9):1395–1402. doi: 10.1001/archneur.58.9.1395. [DOI] [PubMed] [Google Scholar]
- 8.Gómez-Isla T., Price J. L., McKeel D. W., Jr., Morris J. C., Growdon J. H., Hyman B. T. Profound loss of layer II entorhinal cortex neurons occurs in very mild Alzheimer’s disease. The Journal of Neuroscience. 1996;16(14):4491–4500. doi: 10.1523/JNEUROSCI.16-14-04491.1996. [DOI] [PMC free article] [PubMed] [Google Scholar]
- 9.Du A. T., Schuff N., Amend D., et al. Magnetic resonance imaging of the entorhinal cortex and hippocampus in mild cognitive impairment and Alzheimer’s disease. Journal of Neurology, Neurosurgery, and Psychiatry. 2001;71(4):441–447. doi: 10.1136/jnnp.71.4.441. [DOI] [PMC free article] [PubMed] [Google Scholar]
- 10.Rossini P. M., Di Iorio R., Vecchio F., et al. Early diagnosis of Alzheimer’s disease: the role of biomarkers including advanced EEG signal analysis. Report from the IFCN-sponsored panel of experts. Clinical neurophysiology : official journal of the International Federation of Clinical Neurophysiology. 2020;131(6):1287–1310. doi: 10.1016/j.clinph.2020.03.003. [DOI] [PubMed] [Google Scholar]
- 11.Niu B. Advancement of technology for precision medicine. Current Pharmaceutical Design. 2019;25(40):4221–4222. doi: 10.2174/138161282540191230093056. [DOI] [PubMed] [Google Scholar]
- 12.Ritchie M. E., Phipson B., Di Wu Y. H., Law C. W., Shi W., Smyth G. K. limma powers differential expression analyses for RNA-sequencing and microarray studies. Nucleic Acids Research. 2015;43(7):p. e47. doi: 10.1093/nar/gkv007. [DOI] [PMC free article] [PubMed] [Google Scholar]
- 13.Radoaca A. Simple Venn diagrams for multisets. 2015 17th International Symposium on Symbolic and Numeric Algorithms for Scientific Computing (SYNASC); 2015; Timisoara, Romania. [DOI] [Google Scholar]
- 14.Zhang H., Zhong J., Tu Y., et al. Integrated bioinformatics analysis identifies hub genes associated with the pathogenesis and prognosis of esophageal squamous cell carcinoma. BioMed Research International. 2019;2019:9. doi: 10.1155/2019/2615921.2615921 [DOI] [PMC free article] [PubMed] [Google Scholar]
- 15.Zhou Y., Zhou B., Pache L., et al. Metascape provides a biologist-oriented resource for the analysis of systems-level datasets. Nature Communications. 2019;10(1):p. 1523. doi: 10.1038/s41467-019-09234-6. [DOI] [PMC free article] [PubMed] [Google Scholar]
- 16.Maag J. L. V. gganatogram: an R package for modular visualisation of anatograms and tissues based on ggplot2. F1000Research. 2018;7:p. 1576. doi: 10.12688/f1000research.16409.1. [DOI] [PMC free article] [PubMed] [Google Scholar]
- 17.Li T., Wernersson R., Hansen R. B., et al. A scored human protein-protein interaction network to catalyze genomic interpretation. Nature Methods. 2017;14(1):61–64. doi: 10.1038/nmeth.4083. [DOI] [PMC free article] [PubMed] [Google Scholar]
- 18.Bader G. D., Hogue C. W. An automated method for finding molecular complexes in large protein interaction networks. BMC Bioinformatics. 2003;4:p. 2. doi: 10.1186/1471-2105-4-2. [DOI] [PMC free article] [PubMed] [Google Scholar]
- 19.Cotto K. C., Wagner A. H., Feng Y. Y., et al. DGIdb 3.0: a redesign and expansion of the drug-gene interaction database. Nucleic Acids Research. 2018;46(D1):D1068–d1073. doi: 10.1093/nar/gkx1143. [DOI] [PMC free article] [PubMed] [Google Scholar]
- 20.Shannon P., Markiel A., Ozier O., et al. Cytoscape: a software environment for integrated models of biomolecular interaction networks. Genome Research. 2003;13(11):2498–2504. doi: 10.1101/gr.1239303. [DOI] [PMC free article] [PubMed] [Google Scholar]
- 21.Campbell C. Support vector machines and other kernel-based learning machines. Morgan & Claypool Publishers; 2011. [Google Scholar]
- 22.Friedman J. H. Classification and regression trees [M] Wadsworth International Group; 1984. [Google Scholar]
- 23.Zhang M., Su Q., Lu Y., Zhao M., Niu B. Application of machine learning approaches for protein-protein interactions prediction. Medicinal Chemistry. 2017;13(6):p. 506. doi: 10.2174/1573406413666170522150940. [DOI] [PubMed] [Google Scholar]
- 24.Altman N. S. An introduction to kernel and nearest-neighbor nonparametric regression. American Statistician. 1992;46(3):175–185. doi: 10.1080/00031305.1992.10475879. [DOI] [Google Scholar]
- 25.Langarizadeh M., Moghbeli F. Applying naive Bayesian networks to disease prediction: a systematic review. Acta informatica medica : AIM : journal of the Society for Medical Informatics of Bosnia & Herzegovina : casopis Drustva za medicinsku informatiku BiH. 2016;24(5):364–369. doi: 10.5455/aim.2016.24.364-369. [DOI] [PMC free article] [PubMed] [Google Scholar]
- 26.Kohavi R. A study of cross-validation and bootstrap for accuracy estimation and model selection. International Joint Conference on Artificial Intelligence. 1995;2:1137–1143. [Google Scholar]
- 27.Chen W., Peng J., Hong H., et al. Landslide susceptibility modelling using GIS-based machine learning techniques for Chongren County, Jiangxi Province, China. The Science of the Total Environment. 2018;626:1121–1135. doi: 10.1016/j.scitotenv.2018.01.124. [DOI] [PubMed] [Google Scholar]
- 28.Fenoglio C., Scarpini E., Serpente M., Galimberti D. Role of genetics and epigenetics in the pathogenesis of Alzheimer’s disease and frontotemporal dementia. Journal of Alzheimer's disease : JAD. 2018;62(3):913–932. doi: 10.3233/JAD-170702. [DOI] [PMC free article] [PubMed] [Google Scholar]
- 29.Rabiet M. J., Macari L., Dahlgren C., Boulay F. N-formyl peptide receptor 3 (FPR3) departs from the homologous FPR2/ALX receptor with regard to the major processes governing chemoattractant receptor regulation, expression at the cell surface, and phosphorylation. The Journal of Biological Chemistry. 2011;286(30):26718–26731. doi: 10.1074/jbc.M111.244590. [DOI] [PMC free article] [PubMed] [Google Scholar]
- 30.Le Y., Gong W., Tiffany H. L., et al. Amyloid (beta)42 activates a G-protein-coupled chemoattractant receptor, FPR-like-1. Journal of Neuroscience. 2001;21(2):p. Rc123. doi: 10.1523/JNEUROSCI.21-02-j0003.2001. [DOI] [PMC free article] [PubMed] [Google Scholar]
- 31.Cheng Z. Y., Wang X. P., Schmid K. L., Han X. G. GABAB1 and GABAB2 receptor subunits co-expressed in cultured human RPE cells regulate intracellular Ca2+ via Gi/o-protein and phospholipase C pathways. Neuroscience. 2014;280:254–261. doi: 10.1016/j.neuroscience.2014.09.021. [DOI] [PubMed] [Google Scholar]
- 32.Zhao C., Xu Z., Chen J., et al. Two isoforms of GABA(A) receptor beta2 subunit with different electrophysiological properties: differential expression and genotypical correlations in schizophrenia. Molecular Psychiatry. 2007;11(12):1092–1105. doi: 10.1038/sj.mp.4001899. [DOI] [PubMed] [Google Scholar]
- 33.Mueller T. M., Haroutunian V., Meador-Woodruff J. H. N-glycosylation of GABAA receptor subunits is altered in schizophrenia. Neuropsychopharmacology : official publication of the American College of Neuropsychopharmacology. 2014;39(3):528–537. doi: 10.1038/npp.2013.190. [DOI] [PMC free article] [PubMed] [Google Scholar]
- 34.Wallace R. H., Marini C., Petrou S., et al. Mutant GABAA receptor γ2-subunit in childhood absence epilepsy and febrile seizures. Nature Genetics. 2001;28(1):49–52. doi: 10.1038/ng0501-49. [DOI] [PubMed] [Google Scholar]
- 35.Cossette P., Liu L., Brisebois K., et al. Mutation of GABRA1 in an autosomal dominant form of juvenile myoclonic epilepsy. Nature Genetics. 2002;31(2):184–189. doi: 10.1038/ng885. [DOI] [PubMed] [Google Scholar]
- 36.Jacob T. C., Moss S. J., Jurd R. GABA(A) receptor trafficking and its role in the dynamic modulation of neuronal inhibition. Nature Reviews Neuroscience. 2008;9(5):331–343. doi: 10.1038/nrn2370. [DOI] [PMC free article] [PubMed] [Google Scholar]
- 37.Amatniek J. C., Hauser W. A., DelCastillo-Castaneda C., et al. Incidence and predictors of seizures in patients with Alzheimer’s disease. Epilepsia. 2006;47(5):867–872. doi: 10.1111/j.1528-1167.2006.00554.x. [DOI] [PubMed] [Google Scholar]
- 38.Andrews-Zwilling Y., Bien-Ly N., Xu Q., et al. Apolipoprotein E4 causes age- and tau-dependent impairment of GABAergic interneurons, leading to learning and memory deficits in mice. The Journal of Neuroscience. 2010;30(41):13707–13717. doi: 10.1523/JNEUROSCI.4040-10.2010. [DOI] [PMC free article] [PubMed] [Google Scholar]
- 39.Serrano-Pozo A., Mielke M. L., Gómez-Isla T., et al. Reactive glia not only associates with plaques but also parallels tangles in Alzheimer’s disease. The American Journal of Pathology. 2011;179(3):1373–1384. doi: 10.1016/j.ajpath.2011.05.047. [DOI] [PMC free article] [PubMed] [Google Scholar]
- 40.Sanchez P. E., Zhu L., Verret L., et al. Levetiracetam suppresses neuronal network dysfunction and reverses synaptic and cognitive deficits in an Alzheimer’s disease model. Proceedings of the National Academy of Sciences of the United States of America. 2012;109(42):E2895–E2903. doi: 10.1073/pnas.1121081109. [DOI] [PMC free article] [PubMed] [Google Scholar]
- 41.Zhu S., Noviello C. M., Teng J., Walsh R. M., Jr., Kim J. J., Hibbs R. E. Structure of a human synaptic GABAA receptor. Nature. 2018;559(7712):67–72. doi: 10.1038/s41586-018-0255-3. [DOI] [PMC free article] [PubMed] [Google Scholar]
- 42.Busche M. A., Kekuš M., Adelsberger H., et al. Rescue of long-range circuit dysfunction in Alzheimer’s disease models. Nature Neuroscience. 2015;18(11):1623–1630. doi: 10.1038/nn.4137. [DOI] [PubMed] [Google Scholar]
Associated Data
This section collects any data citations, data availability statements, or supplementary materials included in this article.
Data Availability Statement
The data used to support the findings of this study are from previously reported studies and datasets, which have been cited.


