Abstract
Serratia marcescens is a facultatively anaerobic bacterium and the most recognized producer of the hydrophobic pigment prodigiosin. Previous work has shown that prodigiosin both increases ATP production during population lag phase and approximately doubles the stationary-phase cell yield. Here, we employed both batch and chemostat culture methods to investigate prodigiosin’s role during high rate growth at low cell density as peak cellular ATP levels decline. Batch culture experiments utilizing artificial pigment induction showed an ATP reduction during low cell density growth. In addition, pigment induction during fixed growth rate chemostat culture revealed a negative correlation between cellular levels of prodigiosin and ATP (r = −0.95). Variable growth rate chemostat experiments showed an inverse relationship between ATP per cell and prodigiosin per cell during low-density growth but a direct relationship during high-density growth. Rate modeling of chemostat data quantified the pigment’s effect on cellular levels of ATP for both population growth phases. Finally, prodigiosin production in a heterologous bacterium led to ATP decline. These data with intact cells complement the established in vitro proton import function of prodigiosin pigment and may indicate an energy-spilling function during high rate, low cell density growth.
Keywords: Serratia marcescens, prodigiosin, energy spilling
Résumé :
Serratia marcescens est une bactérie anaérobie facultative et le producteur le plus reconnu de prodigiosine, un pigment hydrophobe. Des travaux antérieurs ont révélé que la prodigiosine accroît la production d’ATP durant la phase de latence de la population et qu’elle double presque le rendement cellulaire en phase stationnaire. Les auteurs ont utilisé ici la culture discontinue et en chemostat pour examiner le rôle de la prodigiosine durant la croissance à taux élevé et à faible densité cellulaire, lorsque les niveaux cellulaires maximaux d’ATP diminuent. Les expériences en culture discontinue réalisées avec l’induction de pigments artificiels ont révélé une réduction d’ATP durant la croissance à faible densité cellulaire. De plus, l’induction de pigments durant la culture en chemostat à un taux de croissance fixe a révélé une corrélation négative entre les niveaux cellulaires de prodigiosine et d’ATP (r = −0,95). Les expériences en chemostat à un taux de croissance variable ont montré une relation inverse entre la quantité d’ATP et de prodigiosine par cellule lors de la croissance à faible densité cellulaire, mais une relation directe lors de la croissance à haute densité. La modélisation du taux des données en chemostat a permis de quantifier l’effet du pigment sur les niveaux cellulaires d’ATP pour les deux phases de croissance de la population. Finalement, la production de prodigiosine dans une bactérie hétérologue a donné lieu à une diminution de l’ATP. Ces données récoltées de cellules intactes complètent la fonction établie d’import de protons in vitro de la prodigiosine et peuvent indiquer l’existence d’une fonction de dispersion d’énergie pendant la croissance à taux élevé et à faible densité de cellules.
Mots-clés : Serratia marcescens, prodigiosine, dispersion d’énergie
Introduction
Serratia marcescens is a common Gram-negative soil bacterium known for producing the red, cell-associated pigment prodigiosin. The antibiotic function of prodigiosin has received significant attention due to its activity against fungi, protozoa, and mammalian tumor cells as well as bacteria (reviewed in Darshan and Manonmani 2015; You et al. 2019). Several informative studies on the mechanisms of bacterial antibiosis have been performed. Prodigiosin activity against Escherichia coli included an inhibition of cell multiplication and outer membrane disruption, as shown by enhancement of periplasmic enzyme release (Danevćić et al. 2016b). This same study revealed a negative effect on cellular respiration as a decrease in carbon dioxide production. Prodigiosin toxicity against the Gram-positive bacterium Bacillus subtilis (Danevćić et al. 2016a) required the action of cellular autolysins, whose activity is known to be upregulated by dissipation of the transmembrane proton motive force. As determined by cytoplasmic enzyme release, the membrane integrity of B. subtilis was compromised by prodigiosin treatment. A more comprehensive analysis of biomolecule release from prodigiosin-treated bacterial cells (Suryawanshi et al. 2017) further supports prodigiosin’s function as a membrane chaotropic agent.
Although the steps in prodigiosin biosynthesis have been known for many years (reviewed in Gerber 1975 and Williamson et al. 2006), studies of pigment function for the producing cell have been sporadic and incomplete. This hydrophobic and membrane-bound molecule is synthesized under aerobic growth conditions (Heinemann et al. 1970) up to temperatures of 32 °C (Williams et al. 1971). Membrane preparations containing prodigiosin were found to consume less respiratory oxygen than those isolated from nonpigmented cells (Kobayashi and Ichikawa 1985), suggesting a negative function for the pigment in respiratory ATP production. Two subsequent in vitro studies established that prodigiosin is an H+/Cl− symporter (Sato et al. 1998; Seganish and Davis 2005). Prodigiosin does improve resistance of a marine Vibrio bacterium to ultraviolet irradiation in a growth-phase-specific fashion (Borić et al. 2011), but it is unclear whether this function is ecologically relevant to bacterial survival. Prodigiosin production by many Serratia organisms is induced by a quorum-sensing mechanism (reviewed in van Houdt et al. 2007); work with S. marcescens strain Nima (Haddix and Shanks 2018) has identified low cellular ATP as another inducer.
Our early studies of prodigiosin function during in vitro batch culture (Haddix et al. 2008) defined lag, low-density, and high-density S. marcescens population phases. Prodigiosin augments lag-phase ATP production (Haddix and Shanks 2018). Low-density exponential growth follows lag phase and proceeds at a relatively high rate while cellular levels of ATP exponentially decline. Increased low-density growth rates are associated with more rapid rates of cellular pigmentation decline (Haddix et al. 2008). Similarly, pigmented cells showed both reduced growth rates and reduced cellular ATP levels during low-density growth (Haddix and Shanks 2018); these data support a negative function for prodigiosin pigment in cellular energy production during low-density growth. We noted that the respiratory inhibitor cyanide increased the lag-phase time of pigmented cells but also increased low-density growth rate and ATP production, perhaps by interfering with prodigiosin function(s) (Haddix et al. 2008). High-density growth follows an ATP per cell minimum at the conclusion of low density, proceeds at a slower rate, and is marked by both prodigiosin production and an increase in ATP per cell (Haddix et al. 2008). High-density growth is more rapid in pigmented (Pig+) vs. nonpigmented (Pig−) cells, and Pig+ cells grow to higher yields in both batch and chemostat culture (Haddix and Shanks 2018).
To more fully characterize the native biological function of prodigiosin in situ, we performed both artificial prodigiosin induction and growth rate modulation experiments to assess the relationship between prodigiosin and ATP. In this report we provide further associative evidence supporting a negative effect of prodigiosin on low-density cellular ATP levels and offer the testable hypothesis that prodigiosin serves an energy-spilling role.
Materials and methods
Bacterial strains and growth conditions
Mutant S. marcescens strains used for this study are derivatives of the wild-type pigmented strain Nima; their relevant properties have been described earlier (Haddix and Shanks 2018). Briefly, strain CMS2119 is nonpigmented and harbors a deletion within the pigA gene, while strain CMS1827 expresses the pig operon under the control of the l-arabinose inducible promoter PBAD. Serratia marcescens is unable to use l-arabinose as a source of energy and carbon (Grimont and Grimont 1984), and this was verified for strain Nima by carbohydrate fermentation testing in Difco semisolid oxidation-fermentation deeps (Becton Dickinson and Company; data not shown).
Pseudomonas putida strains KT2440 (Nelson et al. 2002; Belda et al. 2016) and pig-r2 (Domröse et al. 2015) were kind gifts of Thomas Drepper and Anita Loeschcke. The former strain is a nonpigmented soil bacterium, and the latter is a derivative engineered to produce prodigiosin via the TREX expression system (Loeschcke et al. 2013) by genomic integration of the S. marcescens prodigiosin biosynthetic genes. Prodigiosin production by P. putida pig-r2 proceeds under the transcriptional control of a ribosomal RNA promoter.
Frozen stocks of bacterial cultures were maintained in 2% peptone and 20% glycerol at −80 °C. Bacteria were routinely cultivated at 30 °C in base complex medium alone (Haddix et al. 2008) or in base complex medium supplemented with carbohydrates. Base complex medium is 0.5% peptone and 0.3% beef extract. Glycerol complex broth and glycerol + l-arabinose complex broth additionally contain those carbohydrates at 0.5%. Agar was added to 1.5% for growth on slanted solid media.
Batch culture growth and assay of cells, ATP, and prodigiosin
Slant pre-growth cultures maintained at 27 to 30 °C were washed with the corresponding broth medium, and the optical density at 750 nm (OD750) was determined for the pooled material. Fifty millilitres of sterile broth in 250 mL Erlenmeyer flasks was then inoculated to a calculated initial OD750 and cultivated with rotary shaking at 250 r/min at 26 °C. Enhanced batch culture pigmentation was achieved by shaking at 300–325 r/min. Culture aliquots were removed from continuously aerated broth cultures for cell, ATP, and prodigiosin assays at 0.25, 0.33, or 0.50 h intervals over 10–12 h experiments.
Measurements of cell, ATP, and prodigiosin were performed as previously reported (Haddix et al. 2008). Cell concentration was measured as OD750 to avoid error due to absorbance by cell-associated prodigiosin. ATP levels were measured by a chemiluminescence assay in which cells were lysed in a cocktail of detergent, luciferin, and luciferase. The optimal ATP release time for each strain in BactiterGlo ATP chemiluminescence assay reagent (Promega, Madison, WI, USA) was empirically determined and reported elsewhere (Haddix and Shanks 2018). Light measurements as relative light units (RLU) were performed with a Promega GloMax 20–20 tube luminometer over a 3 s integration period. Prodigiosin levels were measured at 536 nm as acid-ethanol extractable pigment in a 1 mL volume (Slater et al. 2003; Haddix et al. 2008). ATP per cell and prodigiosin per cell are ATP and prodigiosin measurements, respectively, divided by culture OD750. The first-order kinetic rate constant measuring the maximum batch culture cell growth rate under given conditions of medium and temperature was designated kcell. Similarly, the first-order rate constant for changes in ATP concentration was designated kATP (Haddix et al. 2008).
Chemostat culture and inhibition of respiratory ATP production
Calibration and routine operation of a Wheaton Science Products Cell Optimizer System as a 500 mL volume bacterial chemostat has been detailed (Haddix and Shanks 2018). Considering the kcell growth rate constants above as 100% values, lesser percentages were calculated for chemostat culture as described (Haddix and Shanks 2018). Aeration that produced moderate levels of chemostat pre-growth culture pigmentation was achieved by sparging filtered air through a 1-mm-diameter tube directly into the culture with stirring at 175 r/min. When enhanced pigmentation was desired, the pre-growth culture was aerated with microbubble sparging.
Chemostat experiments designated “time course” held the population growth rate constant over time at a specific percentage kcell, thereby producing roughly constant ATP per cell and pigment per cell levels prior to prodigiosin induction. Here, the chemostat pre-growth broth was inoculated to an OD750 of ~0.05 from pooled slant wash material, and the culture was grown at temperature with stirring and moderate aeration. Following entry into the low-density growth phase, as indicated by OD750 readings, chemostat culture replacement with sterile medium was activated for overnight equilibration to a target percentage kcell. Assays of cell density and ATP and prodigiosin levels were performed in duplicate at 0.33 or 0.67 h intervals and are reported as n = 2 means. Inhibition of ATP production by oxidative phosphorylation was achieved by spiking 1/100 volume of 4% potassium cyanide into actively growing chemostat cultures to a final concentration of 0.04% (Nakajima 1965; Haddix et al. 2008).
Chemostat experiments identified as “growth rate” employed the range of 0%–90% kcell values to modulate cellular levels of ATP and prodigiosin (Haddix and Shanks 2018). These were additionally designated either “forward” or “reverse” experiments with respect to the growth phase progression from the start of the experiment. Forward growth rate experiments began with lag-phase cells and proceeded through low-density and high-density growth phases. Here, the chemostat vessel was inoculated with pooled slant wash material, and moderate aeration with stirring was begun. Following entry into the low-density phase, the culture growth rate was progressively lowered from 100% to 0% kcell by 10% increments by means of proportional reductions in the rate of culture replacement with sterile medium. Culture replacement was omitted for the 0% kcell condition, while aeration and stirring continued. The low-density to high-density phase transition was identified as the ATP per cell minimum of the experiment (Haddix and Shanks 2018).
Reverse growth rate chemostat experiments were begun with 15–18 h stationary-phase broth pre-growth populations. Moderate pre-growth culture aeration produced an intermediate level of pigmentation, while enhanced aeration produced highly pigmented cultures to begin the experiments. Culture optical density, ATP, and pigmentation were then assayed during the growth rate progression from 0% to 90% kcell. Zero percent kcell for reverse experiments represents the average of triplicate assays of the stationary-phase broth pre-growth culture prior to activation of culture replacement.
After 30 min of equilibration to a new growth rate for both forward and reverse growth rate experiments, OD750, ATP, and prodigiosin were each measured five times at 15 min intervals. Reported values are n = 5 averages at each percentage kcell growth rate. When present, single outliers were identified by the Grubbs’ test (GraphPad QuickCalcs; https://www.graphpad.com/quickcalcs/Grubbs1. cfm). Outliers appeared at frequencies less than 5% of all measured values and were removed prior to mean calculation.
Statistical analyses
Most calculations were performed using Microsoft Excel 2013 spreadsheet software. Some averages are reported plus and minus their standard deviations. Linear regression slopes from plots of natural logarithm versus time identified the first-order rate constants kcell and kATP (Haddix et al. 2008) for batch culture experiments. Similarly, linear regression slopes from plots of (1/(ATP/cell)G–1/(ATP/cell)0) versus G identified the second-order rate constants kG for chemostat experiments, where G is a percentage kcell growth rate. Resolution was limited to 10% kcell for growth rate chemostat experiments, and this restricted the measurement of second-order rate constants to regression slopes from plots of three to five points.
Results
Prodigiosin induction downregulates ATP during batch culture
As an initial assessment of low-density-phase prodigiosin function, we compared rates of population growth and ATP for pigmented and nonpigmented S. marcescens batch cultures. In these experiments, as well as under all conditions of strain and medium examined to date for the low-density phase, growth rates exceeded the rates of ATP production and created a net exponential decline in ATP per cell (Table 1 and data not shown). ATP was consumed by wild-type, pigmented cells at 26 °C, but this energy storage molecule accumulated in the nonpigmented mutant. This indicates a negative effect of pigmentation during low-density batch culture growth. ATP was consumed by both strains during exponential growth at 37 °C (Table 1), a condition which promotes rapid growth and minimizes pigmentation in wild-type cells (Haddix et al. 2008).
Table 1.
Serratia marcescens Nima (Pig+) and CMS2119 (ΔpigA) rates of low-density growth and ATP in batch culture.
| Strain (phenotype) | Growth temp. (°C) | kcella | kATPa | kATP/cellb |
|---|---|---|---|---|
| Nima (Pig+) | 26 | 0.675±0.07 | −0.299±0.03 | −0.974 |
| 37 | 0.768±0.07 | −0.397±0.06 | −1.165 | |
| CMS2119 (Pig−) | 26 | 0.782±0.09 | 0.112±0.05 | −0.670 |
| 37 | 0.668±0.10 | −0.347±0.11 | −1.015 |
Average first-order rate constants from four to eight experiments ± standard deviation are reported.
Calculated as kATP − kcell (Haddix et al. 2008).
Figure 1 shows the effect of l-arabinose-inducible pigmentation on ATP levels in strain CMS1827 (PBAD::pig). ATP declined from 5.00 to 6.50 h during low-density-phase pigment induction, a result which is consistent with the net increase in low-density ATP by the nonpigmented mutant (Table 1). Following entry into high density, ATP increased through 9.25 h in the context of continued prodigiosin biosynthesis. As shown by the noninduced control culture, prodigiosin is not required for ATP accumulation during either low-density or high-density growth.
Fig. 1.
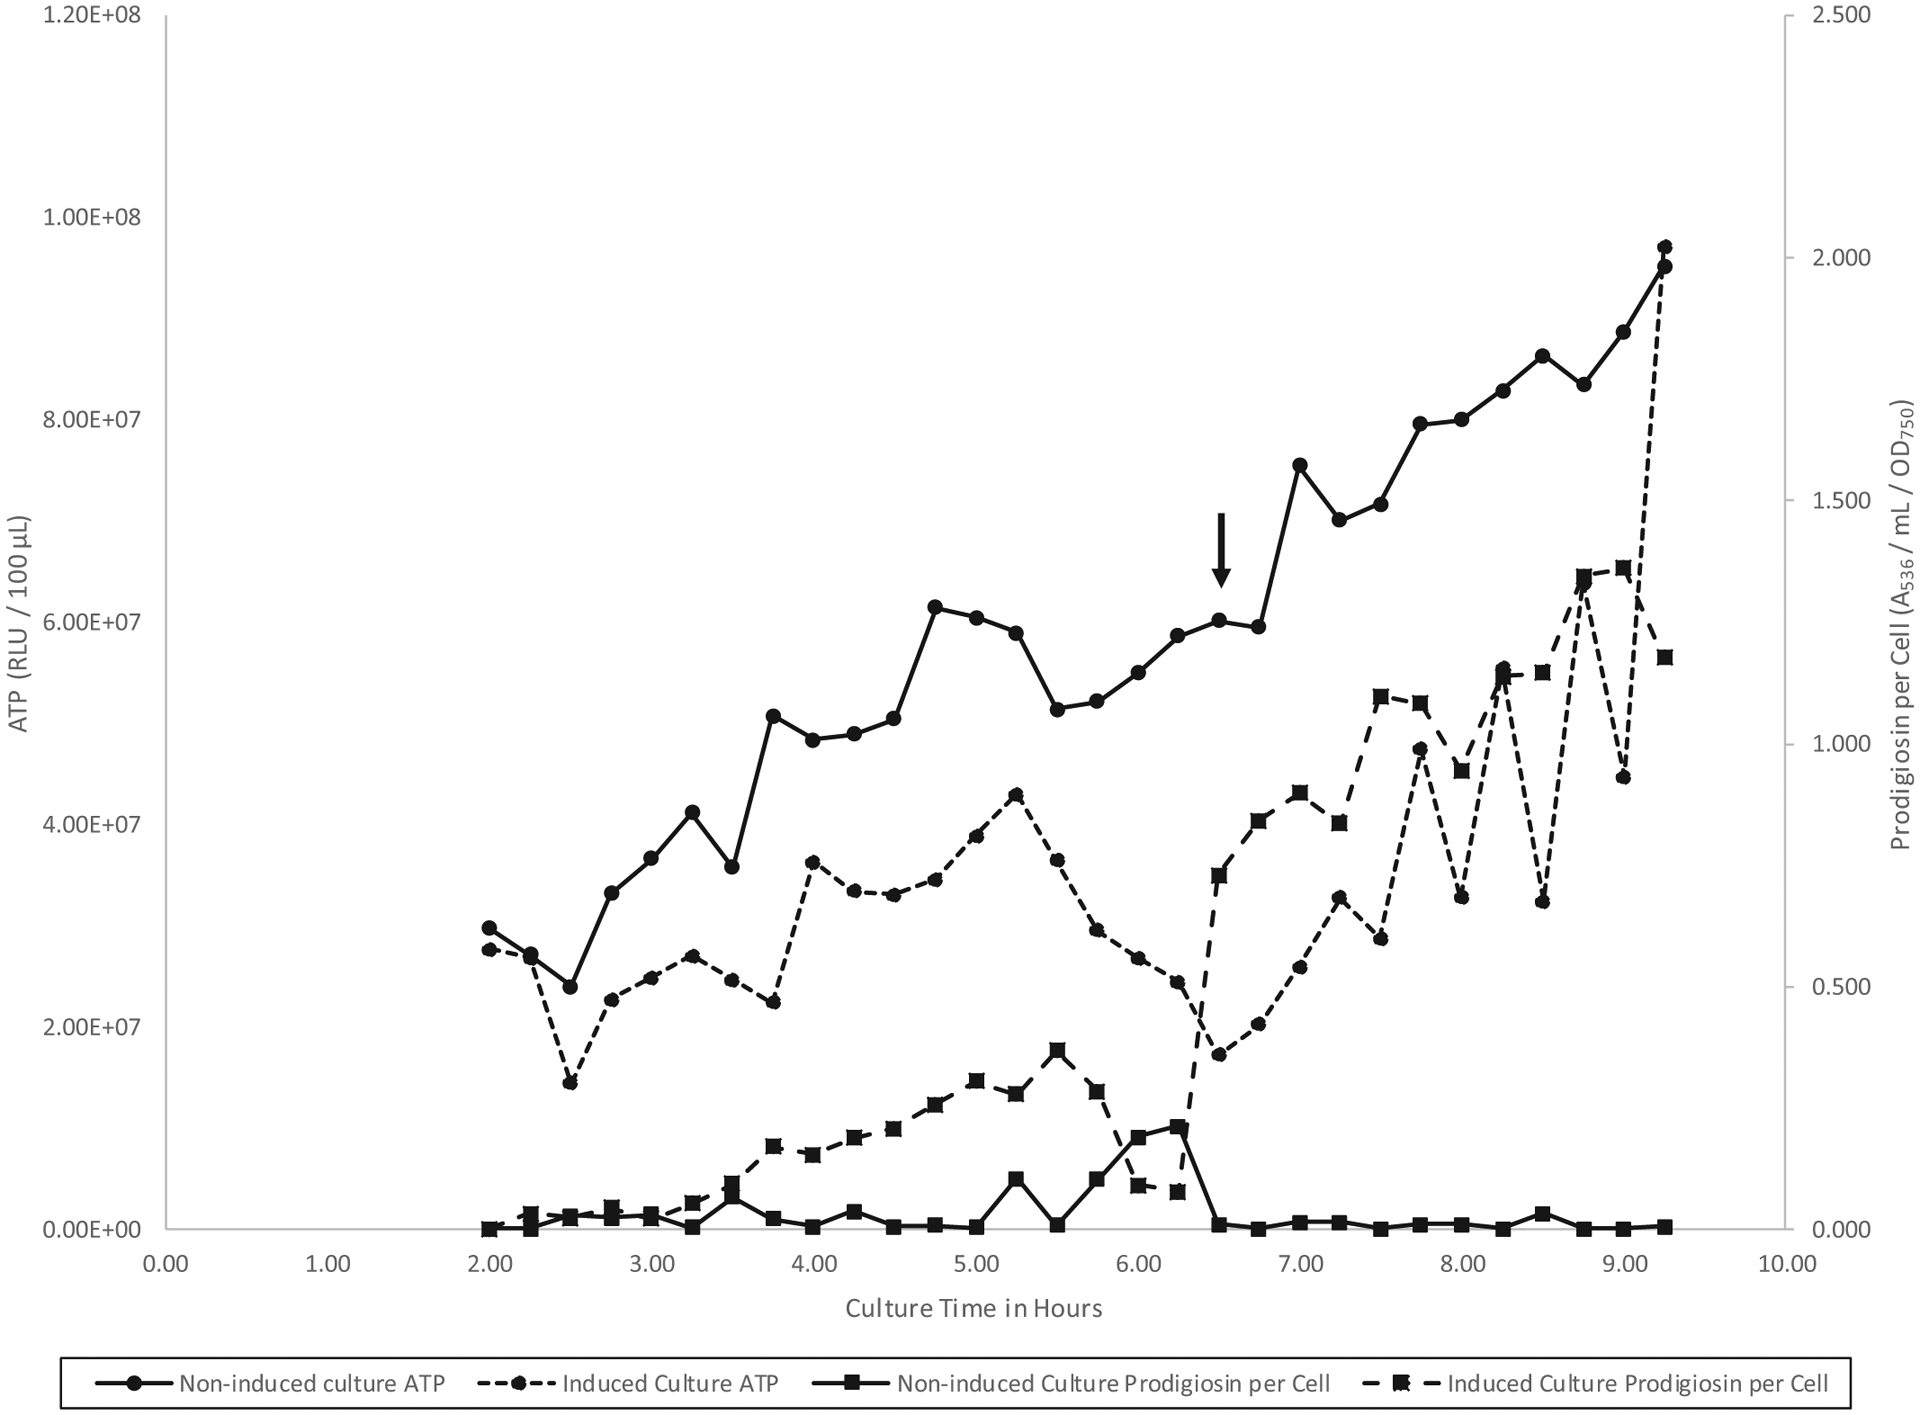
ATP and prodigiosin per cell during batch culture growth of Serratia marcescens CMS1827 (PBAD::pig) in glycerol complex broth at 26 °C under prodigiosin-inducing (+0.5% l-arabinose) and noninducing (no addition) conditions. The down arrow indicates the left to right low-density to high-density growth phase transition at 6.50 h for both cultures.
Prodigiosin and ATP during time course chemostat culture
Time course chemostat experiments hold the population growth rate and cell density constant over time during continuous replacement of culture with sterile medium. Therefore, time course experimentation enables measurements of ATP and prodigiosin levels following artificial induction by l-arabinose in strain CMS1827 (PBAD::pig). It was initially unclear, however, whether the intermediate population growth rates characteristic of time course experiments represented low- or high-density population physiology. Cyanide spikes into l-arabinose induced CMS1827 (Pig+), noninduced CMS1827 (Pig−), and CMS2119 (Pig−) all transiently downregulated then upregulated cellular ATP (data not shown), suggesting low-density physiology without the inhibitor. Under the equilibrium conditions of time course chemostat culture, unless respiratory ATP production is inhibited, ATP per cell apparently does not decline to the minimum needed for the transition to the high-density phase (Haddix and Shanks 2018).
A time course chemostat experiment in which prodigiosin biosynthesis was induced by l-arabinose in strain CMS1827 is presented in Fig. 2. There was a clear negative correlation between cellular levels of prodigiosin and ATP over 8 h of culture (n = 15; r = −0.95). ATP per cell declined to an average minimum value of 1.96 × 10⁷ RLU/100 μL/OD750 (Fig. 2).
Fig. 2.
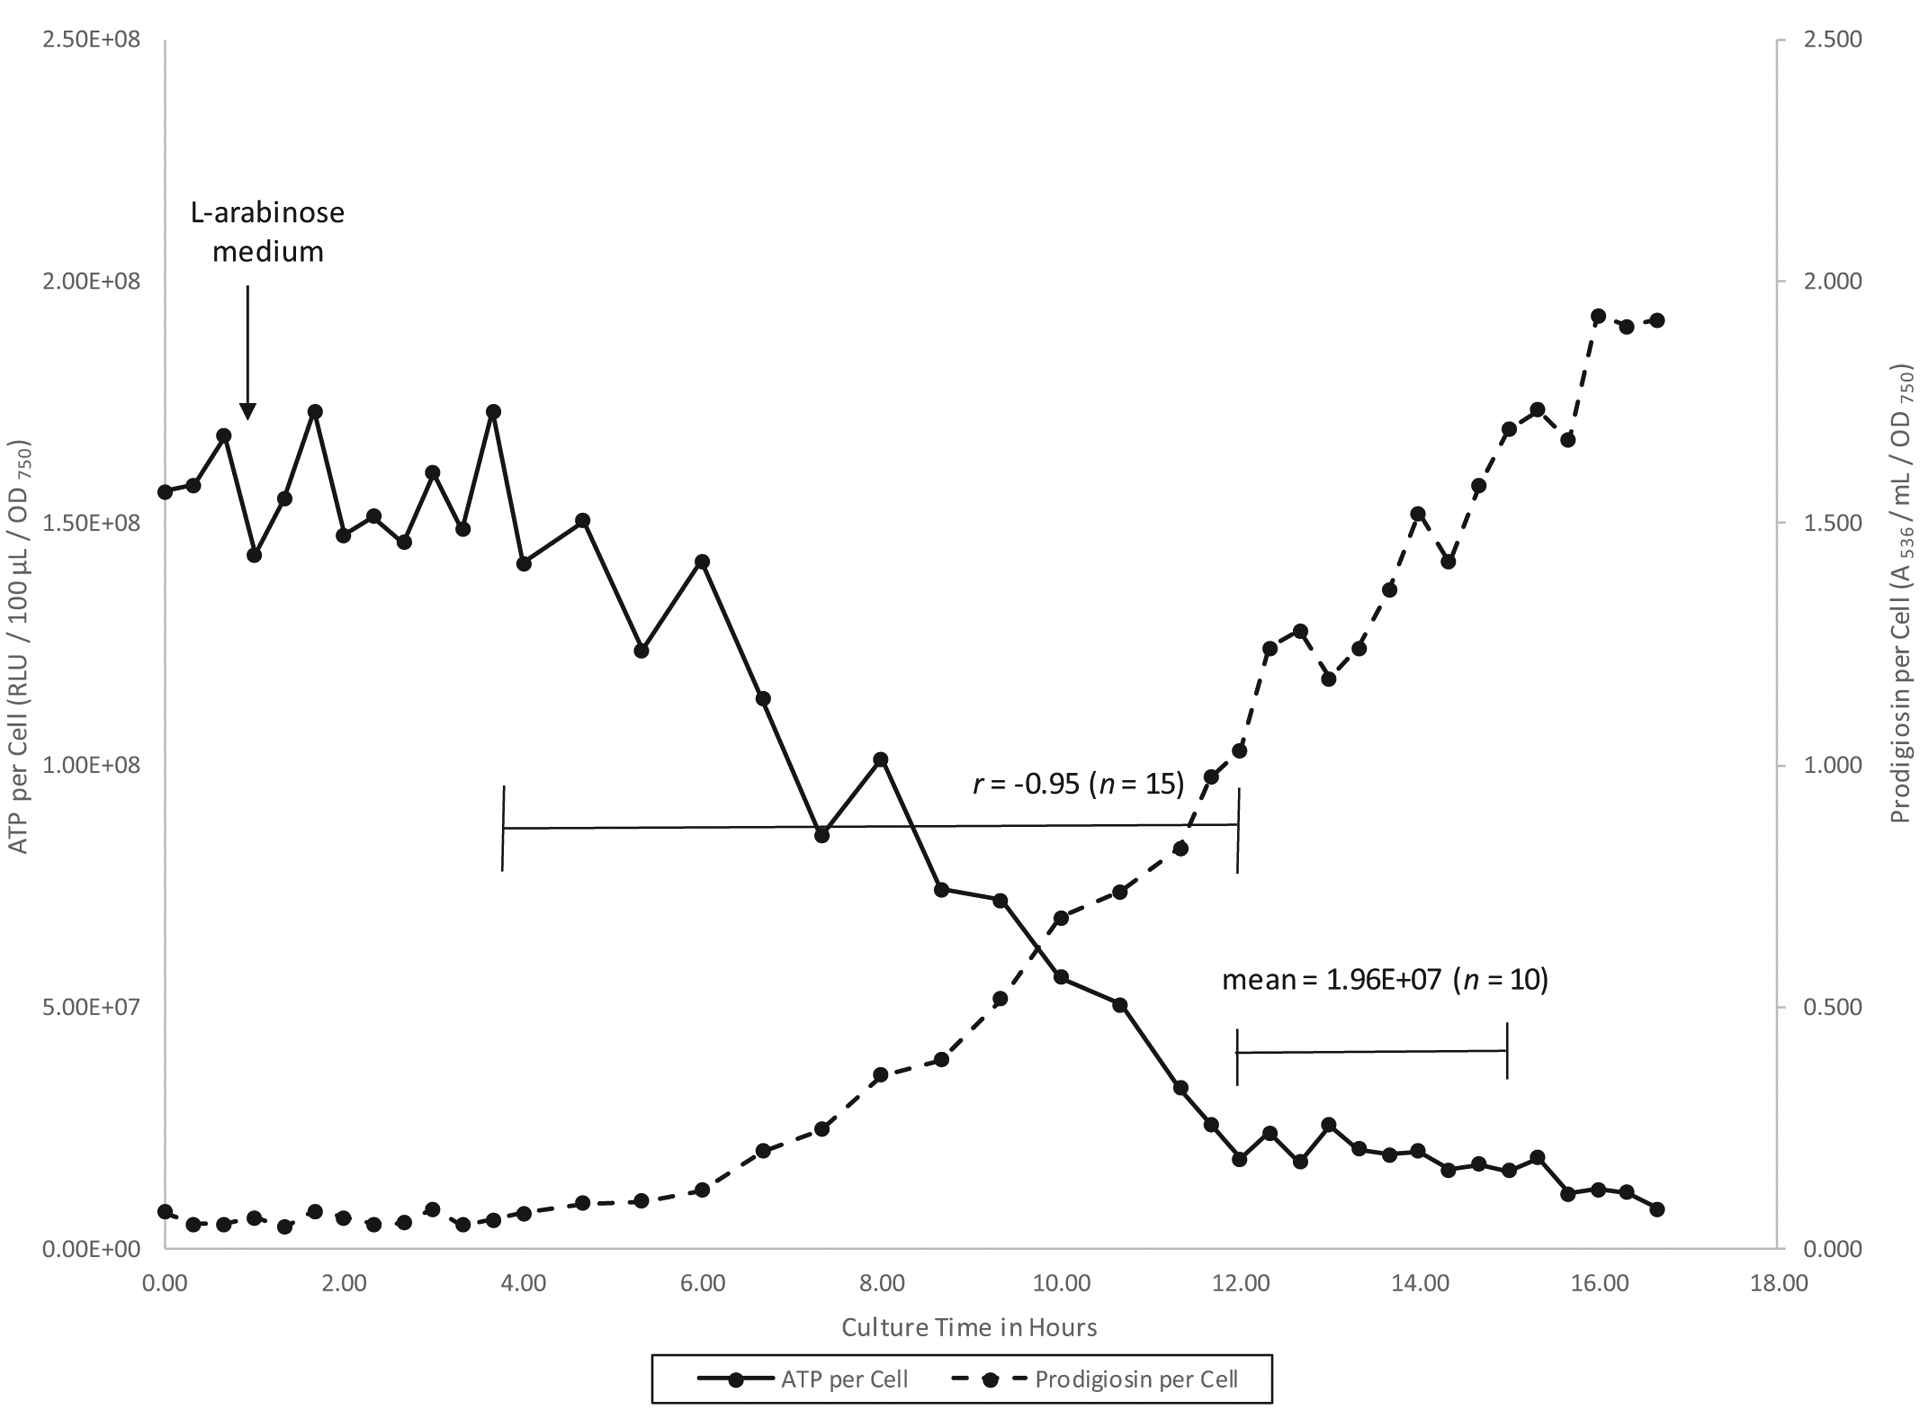
Ten percent kcell time course chemostat culture of Serratia marcescens CMS1827 (PBAD::pig) at 26 °C in glycerol complex broth. At the time indicated by the down arrow, the culture replacement medium was changed from glycerol complex broth to glycerol + l-arabinose complex broth.
Prodigiosin and ATP during forward growth rate chemostat culture
A forward growth rate chemostat experiment, in which the growth rate of wild-type cells was progressively lowered from that of batch culture low density (100% kcell) to zero, is shown in Fig. 3. The low-density phase was identified from 60% to 30% kcell by a correlation between ATP per cell and prodigiosin per cell (n = 4; r = 0.92; Haddix et al. 2008). Prodigiosin per cell was minimized in the context of high and relatively stable cellular ATP, again suggesting a reciprocal relationship between prodigiosin and ATP during the low-density phase (Fig. 3). The high-density phase was the ATP per cell minimum at 20% kcell plus the two lower growth rates. Both growth phases could also be precisely delineated by the mathematical methods described below. Unfortunately, generally poor pigmentation renders the forward growth rate approach of limited value for pigment functional studies. However, Fig. 3 does show an increase in ATP per cell during high-density growth; significant pigment induction is apparently not required for ATP production during high density.
Fig. 3.
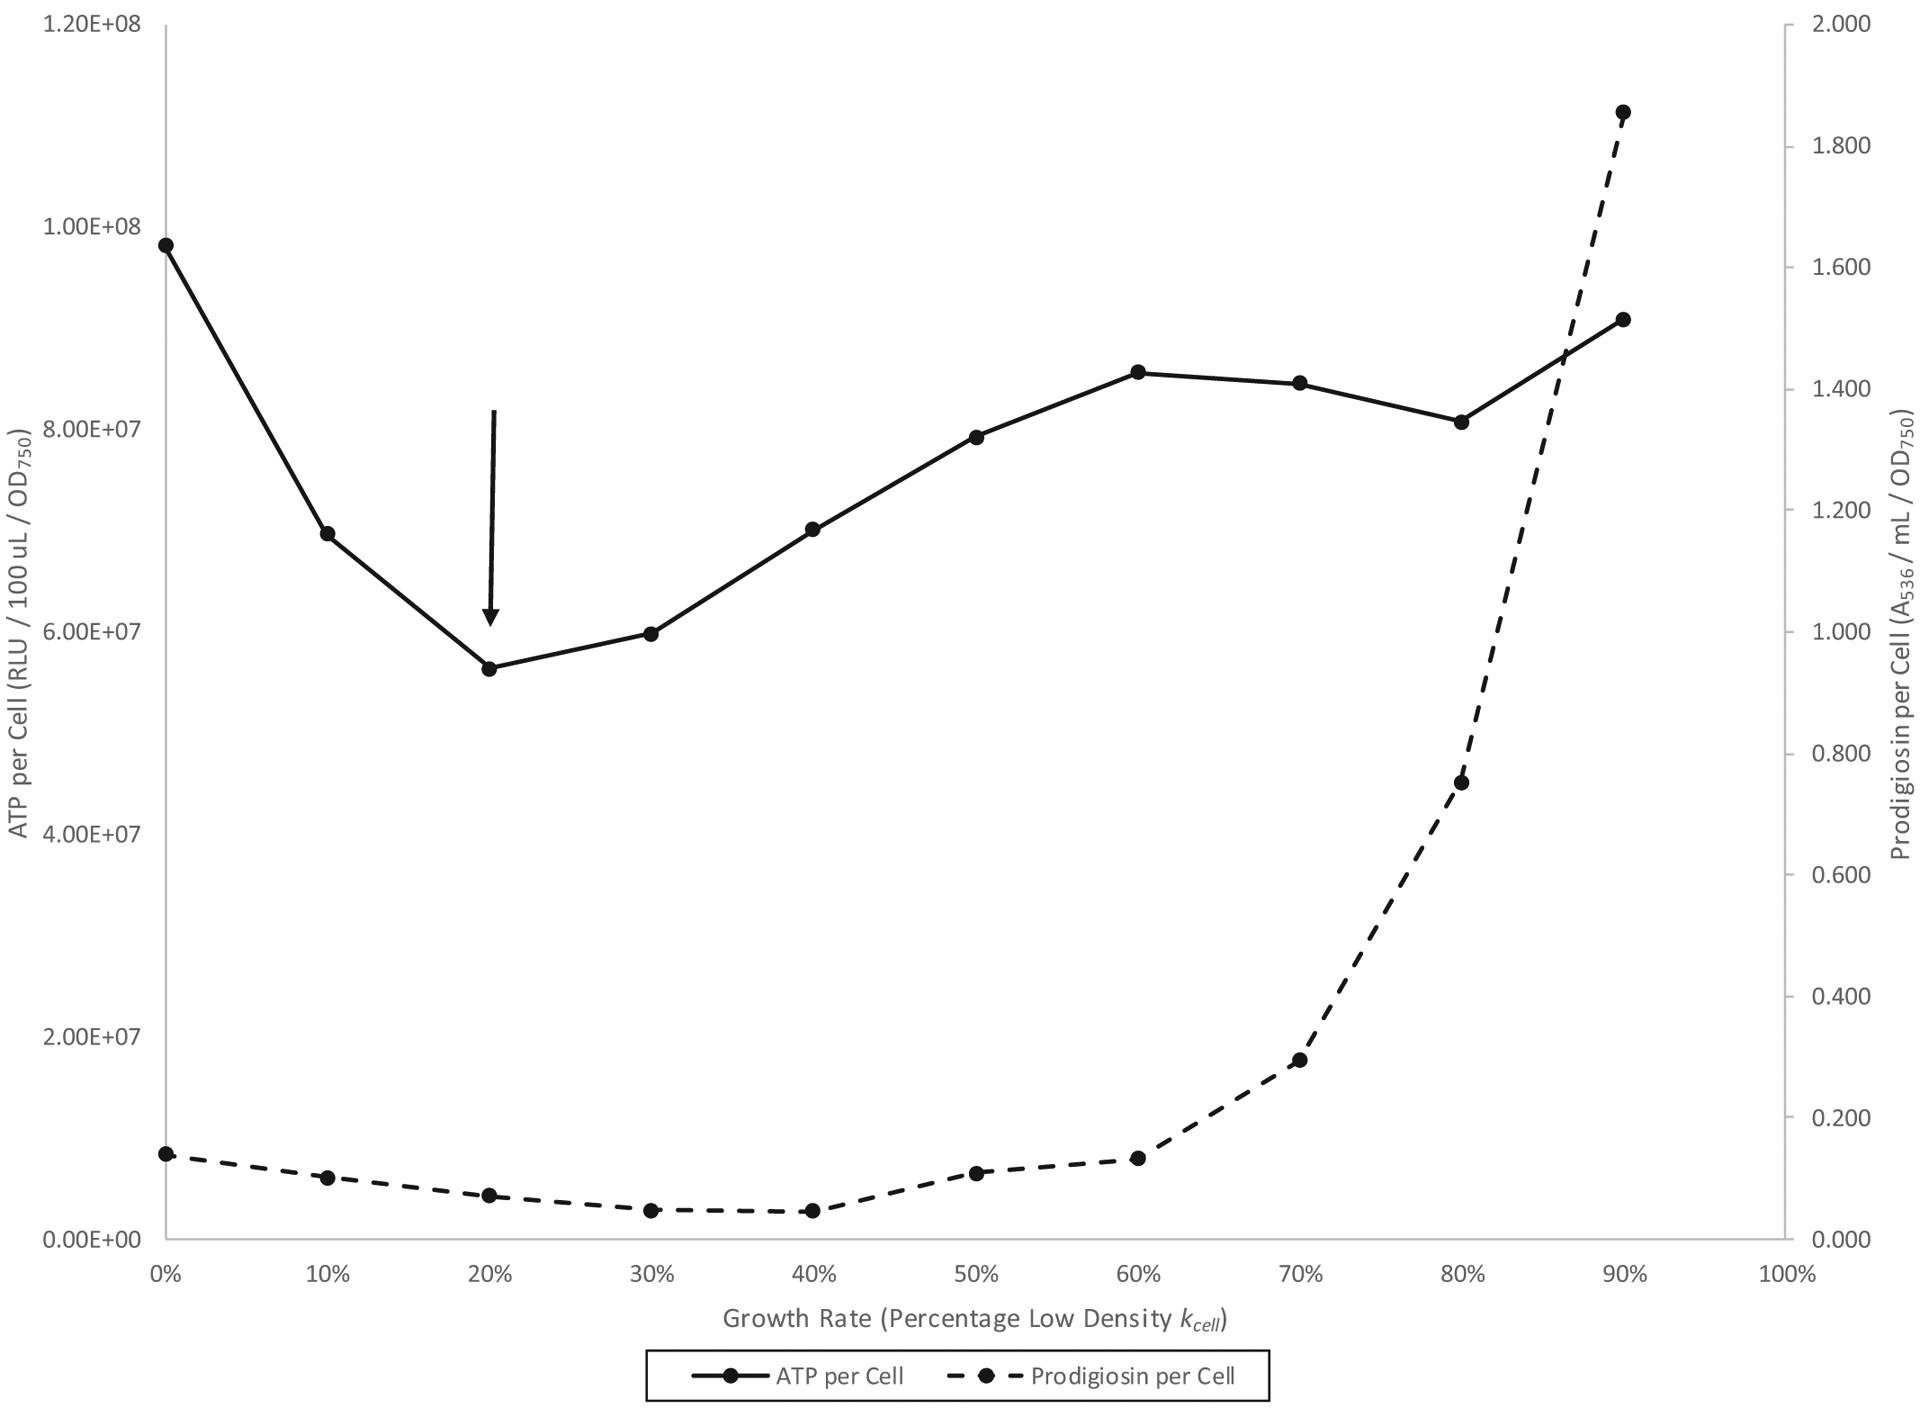
Serratia marcescens Nima (Pig+) forward growth rate chemostat culture in glycerol complex broth at 26 °C. The down arrow represents the left to right high-density to low-density growth phase transition.
Prodigiosin and ATP during reverse growth rate chemostat culture
Reverse growth rate chemostat culture, in which stationary-phase broth pre-growth populations are incrementally increased from 0% to 90% kcell, proved to be the more reliable method for experimentally addressing the relationship between pigmentation and ATP. This is likely due to the high prodigiosin per cell levels that are achievable during culture pre-growth through high cell density to early stationary phase.
A reverse growth rate chemostat experiment from a highly pigmented S. marcescens Nima (Pig+) pre-growth culture is shown in Fig. 4. The figure shows an inversely proportional relationship between ATP per cell and prodigiosin per cell during low density (80% to 60% kcell) but a directly proportional relationship between these quantities during high density (60% to 40% kcell). In addition, the range 30% to 0% kcell tentatively characterizes stationary phase as a period of coordinated ATP and prodigiosin per cell decline. Figure 5 shows a similar experiment employing a less-pigmented pre-growth culture. Here, the inverse relationship for the 50% to 30% kcell low-density phase is more readily apparent. Finally, a reverse growth rate chemostat experiment of the nonpigmented strain CMS2119 (ΔpigA) is presented in Fig. 6. As Fig. 1 revealed for batch culture, Fig. 6 similarly shows that pigmentation is not required for the increase in ATP per cell seen during the 30% to 10% kcell high-density growth phase.
Fig. 4.
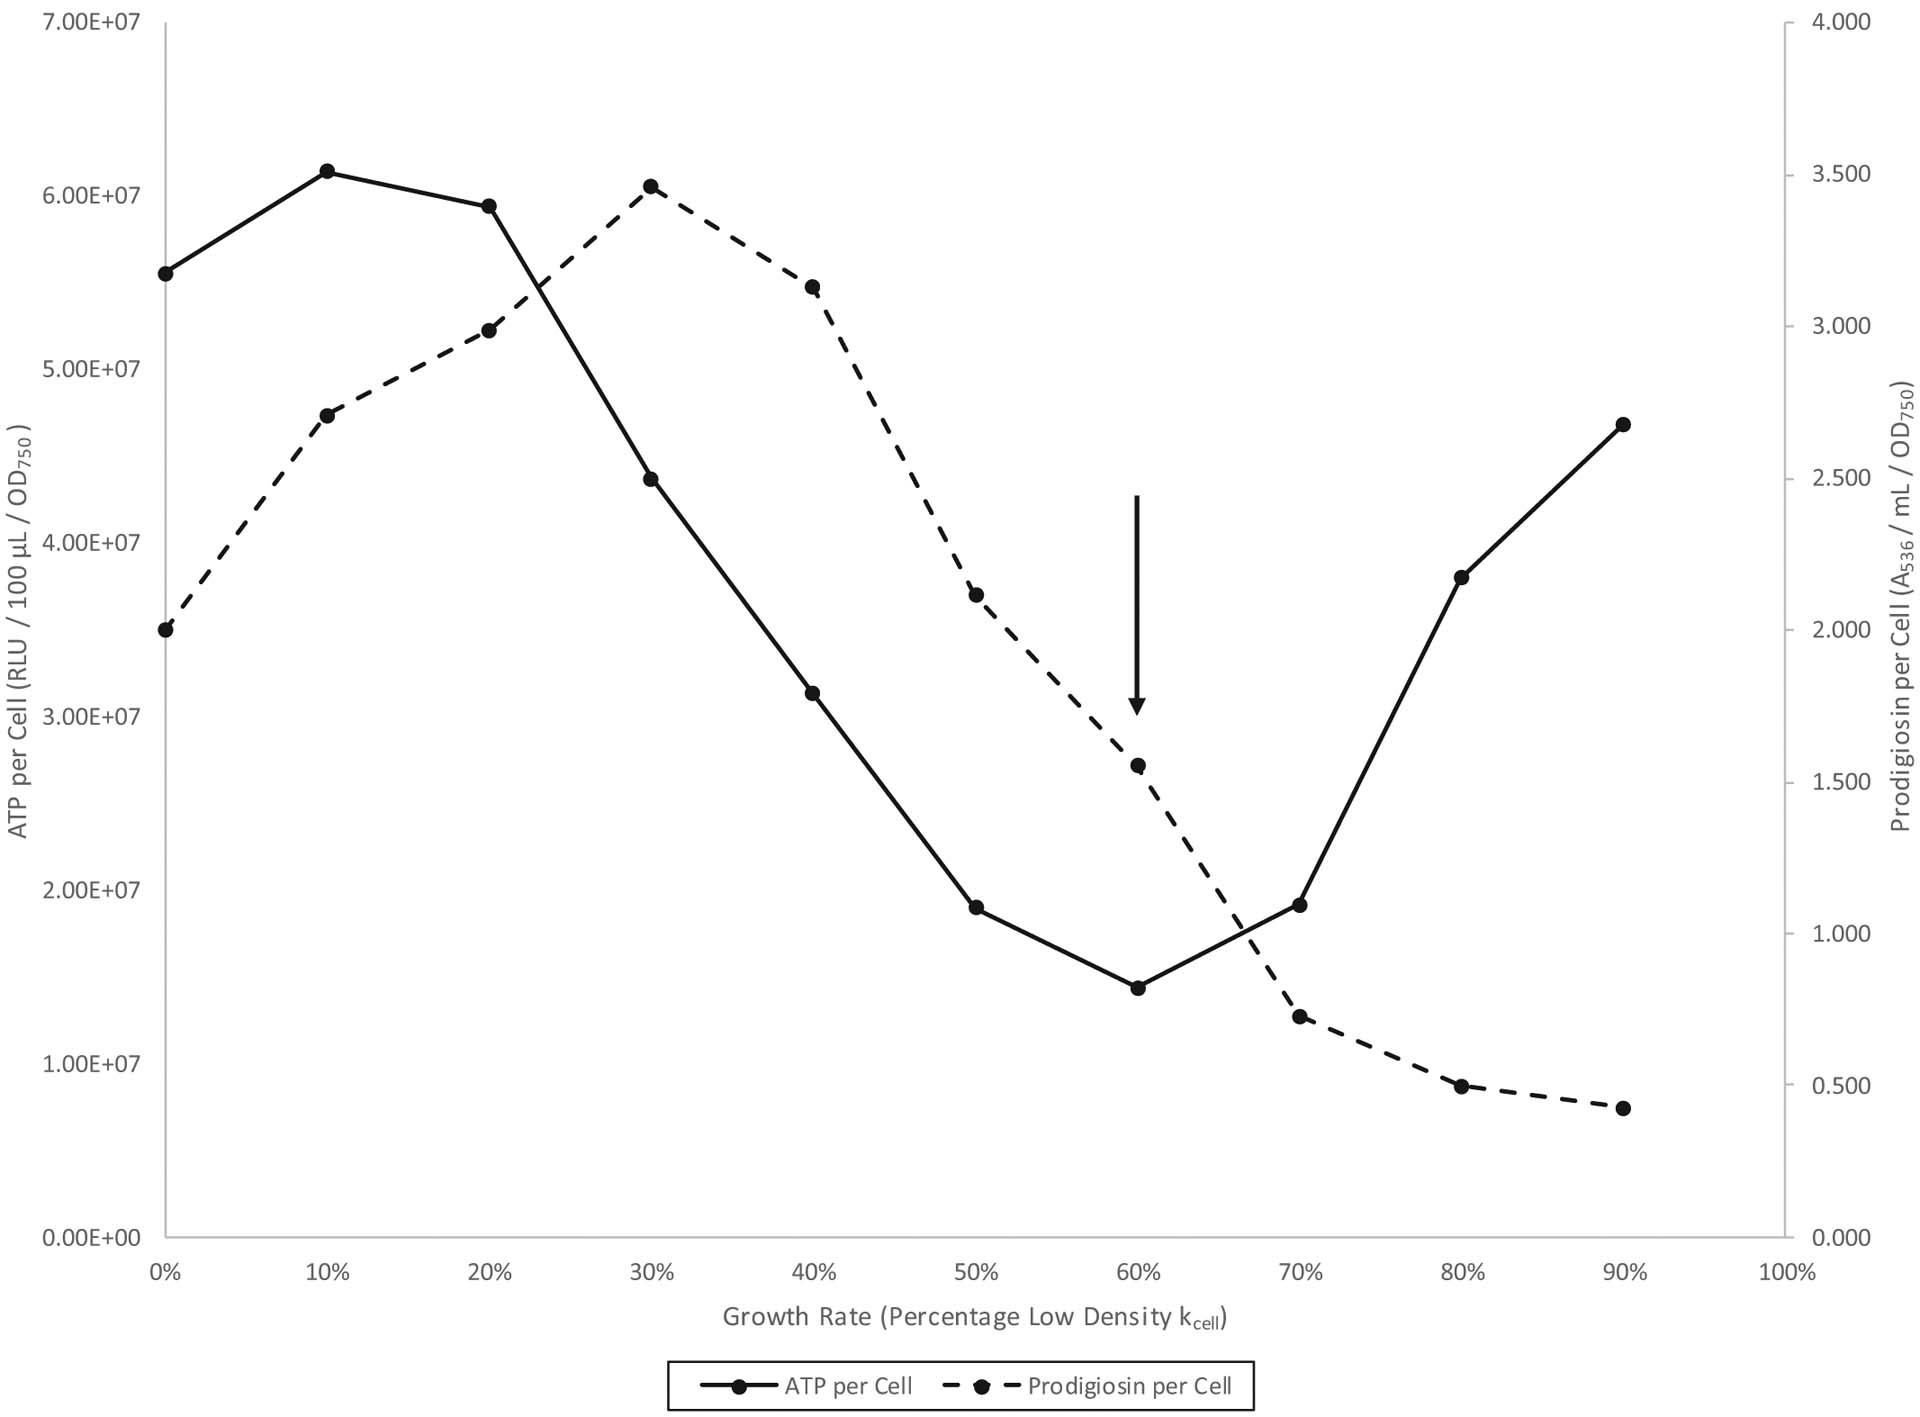
Serratia marcescens Nima (Pig+) reverse growth rate chemostat culture from a highly pigmented pre-growth. Cells were grown in glycerol complex broth at 26 °C. The down arrow indicates the left to right high-density to low-density growth phase transition.
Fig. 5.

Serratia marcescens Nima (Pig+) reverse growth rate chemostat culture from a moderately pigmented pre-growth. Cells were grown in glycerol complex broth at 26 °C. The down arrow indicates the left to right high-density to low-density growth phase transition.
Fig. 6.
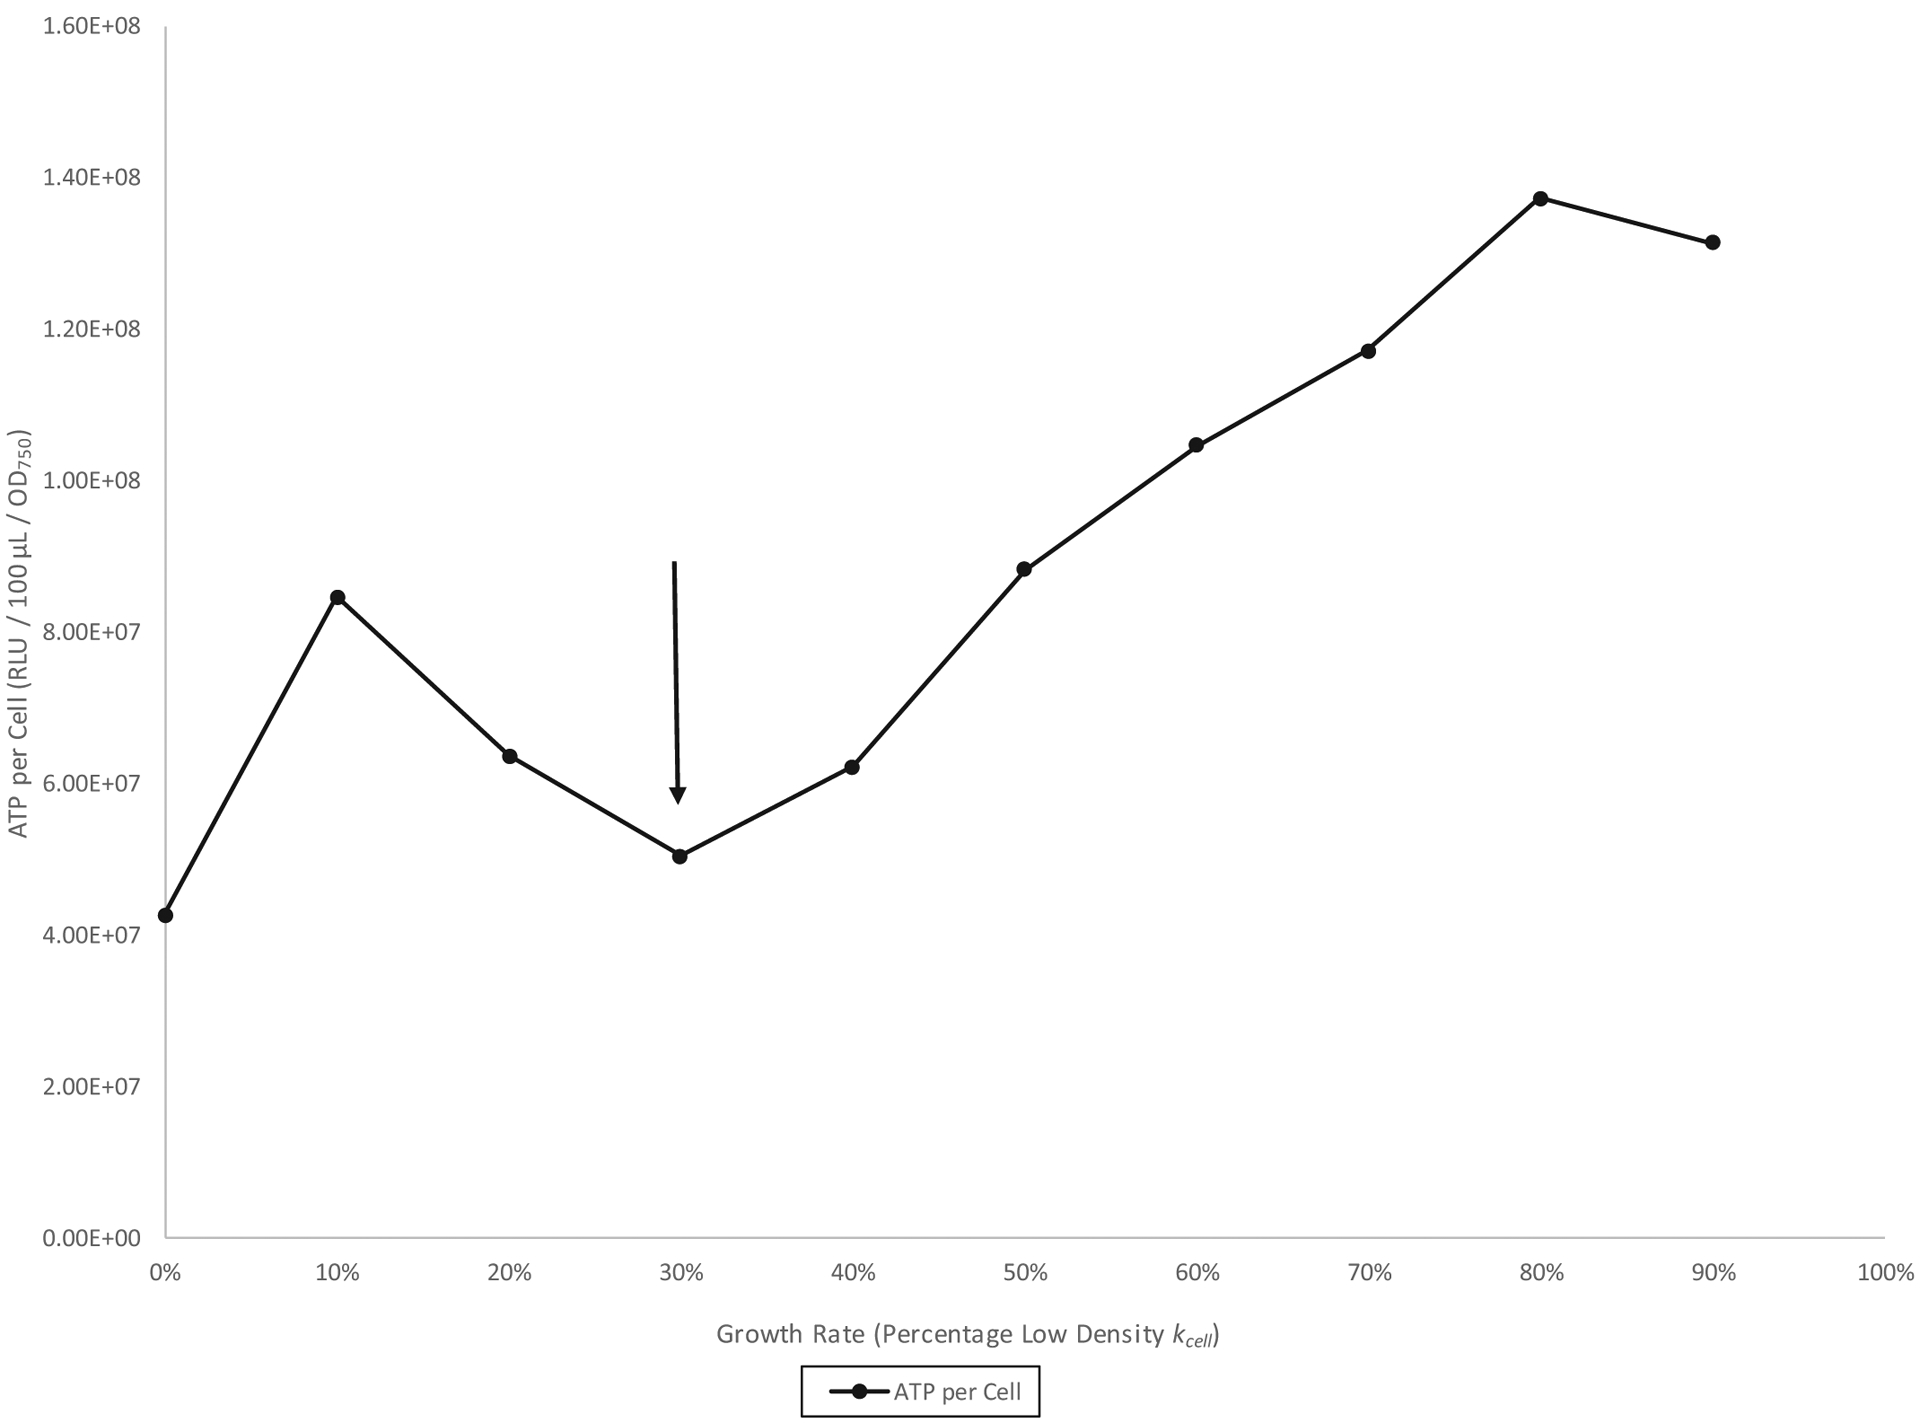
Serratia marcescens CMS2119 (Pig−) reverse growth rate chemostat culture in glycerol complex broth at 26 °C. The down arrow indicates the left to right high-density to low-density growth phase transition.
Mathematical modeling of chemostat growth rate data
Analysis of data from variable growth rate experiments was undertaken to assess the relationship between ATP per cell and prodigiosin per cell using growth rate as a third, independent variable. This analysis, which is illustrated by Fig. 7, considers ATP per cell levels during both growth phases and enables more precise definition of each phase using easily calculable rate constants.
Fig. 7.
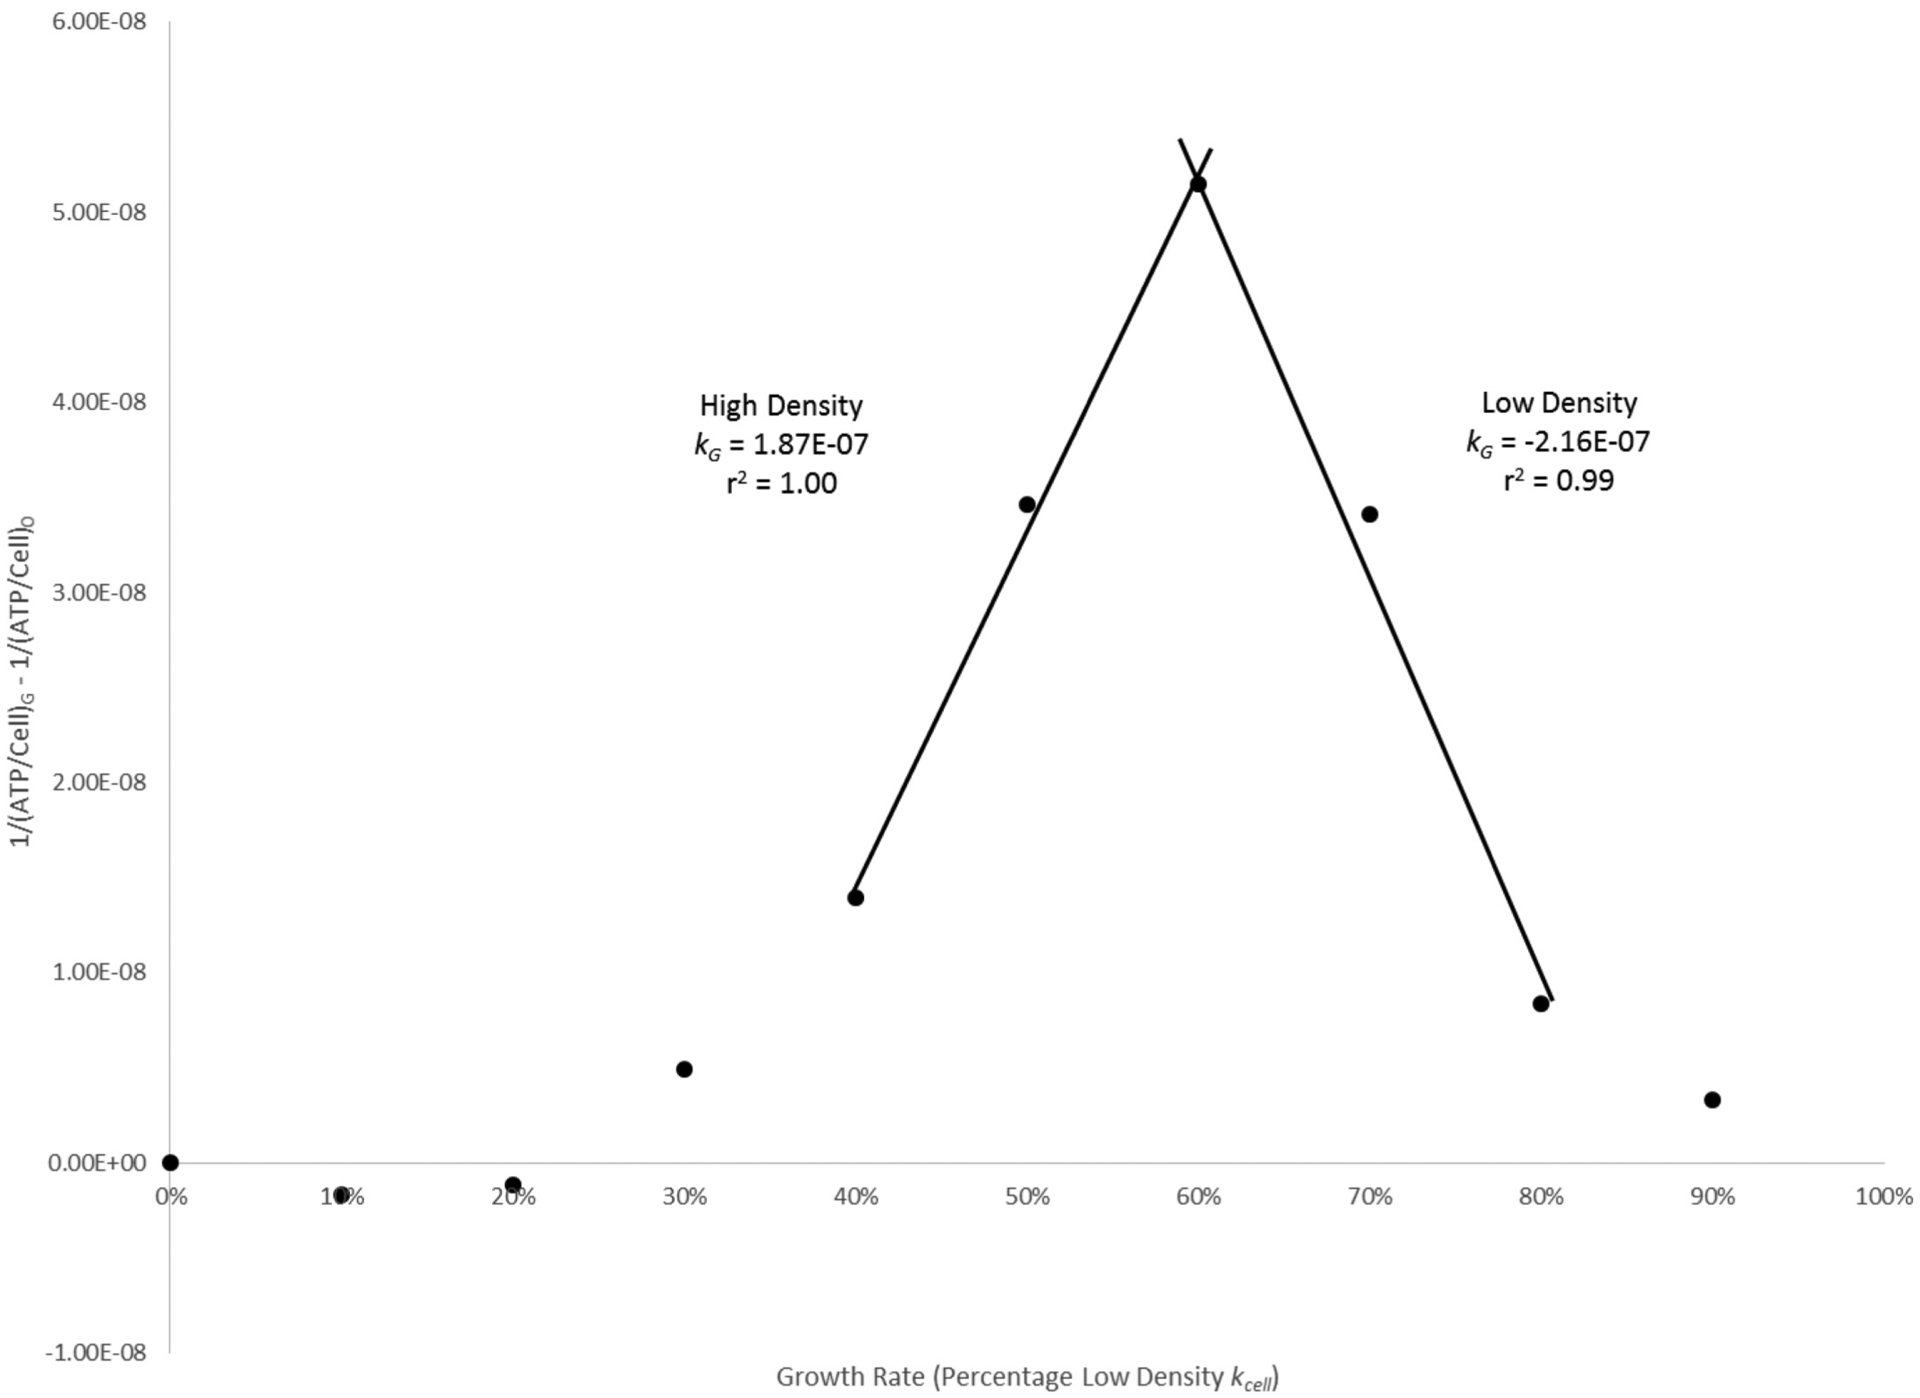
Second-order kinetic modeling of Serratia marcescens Nima (Pig+) ATP per cell data from Fig. 4.
We modeled the rate of change of cellular ATP as a function of the growth rate G in both low-density and high-density terms and included a second-order proportionality constant kG. Since ATP per cell alternately declines and increases with increasing chemostat growth rate throughout the biphasic S. marcescens growth cycle (Figs. 3–6), the relationship may be generally represented as
Rearrangement and integration of this equation produces
where G is a percentage kcell growth rate greater than zero, and 0 represents 0% kcell. As culture growth rate increases, plots of the integrated relationship produce positive kG rate constants for high density, negative kG rate constants for low density, and regions of near zero slope where the growth rate has no clear effect on cellular ATP (e.g., Fig. 7). Units for kG are OD750·h/RLU, and larger values of kG represent greater changes in cellular ATP with respect to growth rate. Examination of the kG rate constants compiled in Table 2 reveals that these vary with the extent of cellular pigmentation: low-density constants become more negative, while their corresponding high-density constants become more positive with increasing culture average high-density pigmentation.
Table 2.
Effect of pigmentation on growth rate chemostat culture second-order rate constants.
Prodigiosin production in a heterologous host
Artificial production of prodigiosin in the nonpigmented soil bacterium P. putida has been described (Domröse et al. 2015). We therefore tested whether pigment production was associated with reduced ATP levels during reverse growth rate chemostat culture in this nonnative cellular background. Figure 8 shows cellular ATP levels for strains KT2440 (wild type; nonpigmented) and pig-r2 (Pig+) as functions of their respective kcell growth rates: 0.604/h for the wild type and 0.515/h for pig-r2 in glycerol complex broth at 26 °C. Although the ATP per cell curves are not directly comparable due to the strains’ growth rate difference, Fig. 8 does show a linear increase in ATP per cell for nonpigmented cells (n = 10; r2 = 0.99) but a sigmoidal increase for the pigmented strain that is consistent with second-order kinetics. Pig-r2 produced prodigiosin evenly across the range of growth rates (Fig. 8), with a mean prodigiosin per cell value of 1.066 ± 0.141 (n = 10). Second-order modeling of the data in Fig. 8 shows a nearly 10-fold greater rate of ATP per cell decline in the presence of prodigiosin pigment at low growth rates (Fig. 9), providing additional support for the negative association between prodigiosin and ATP.
Fig. 8.
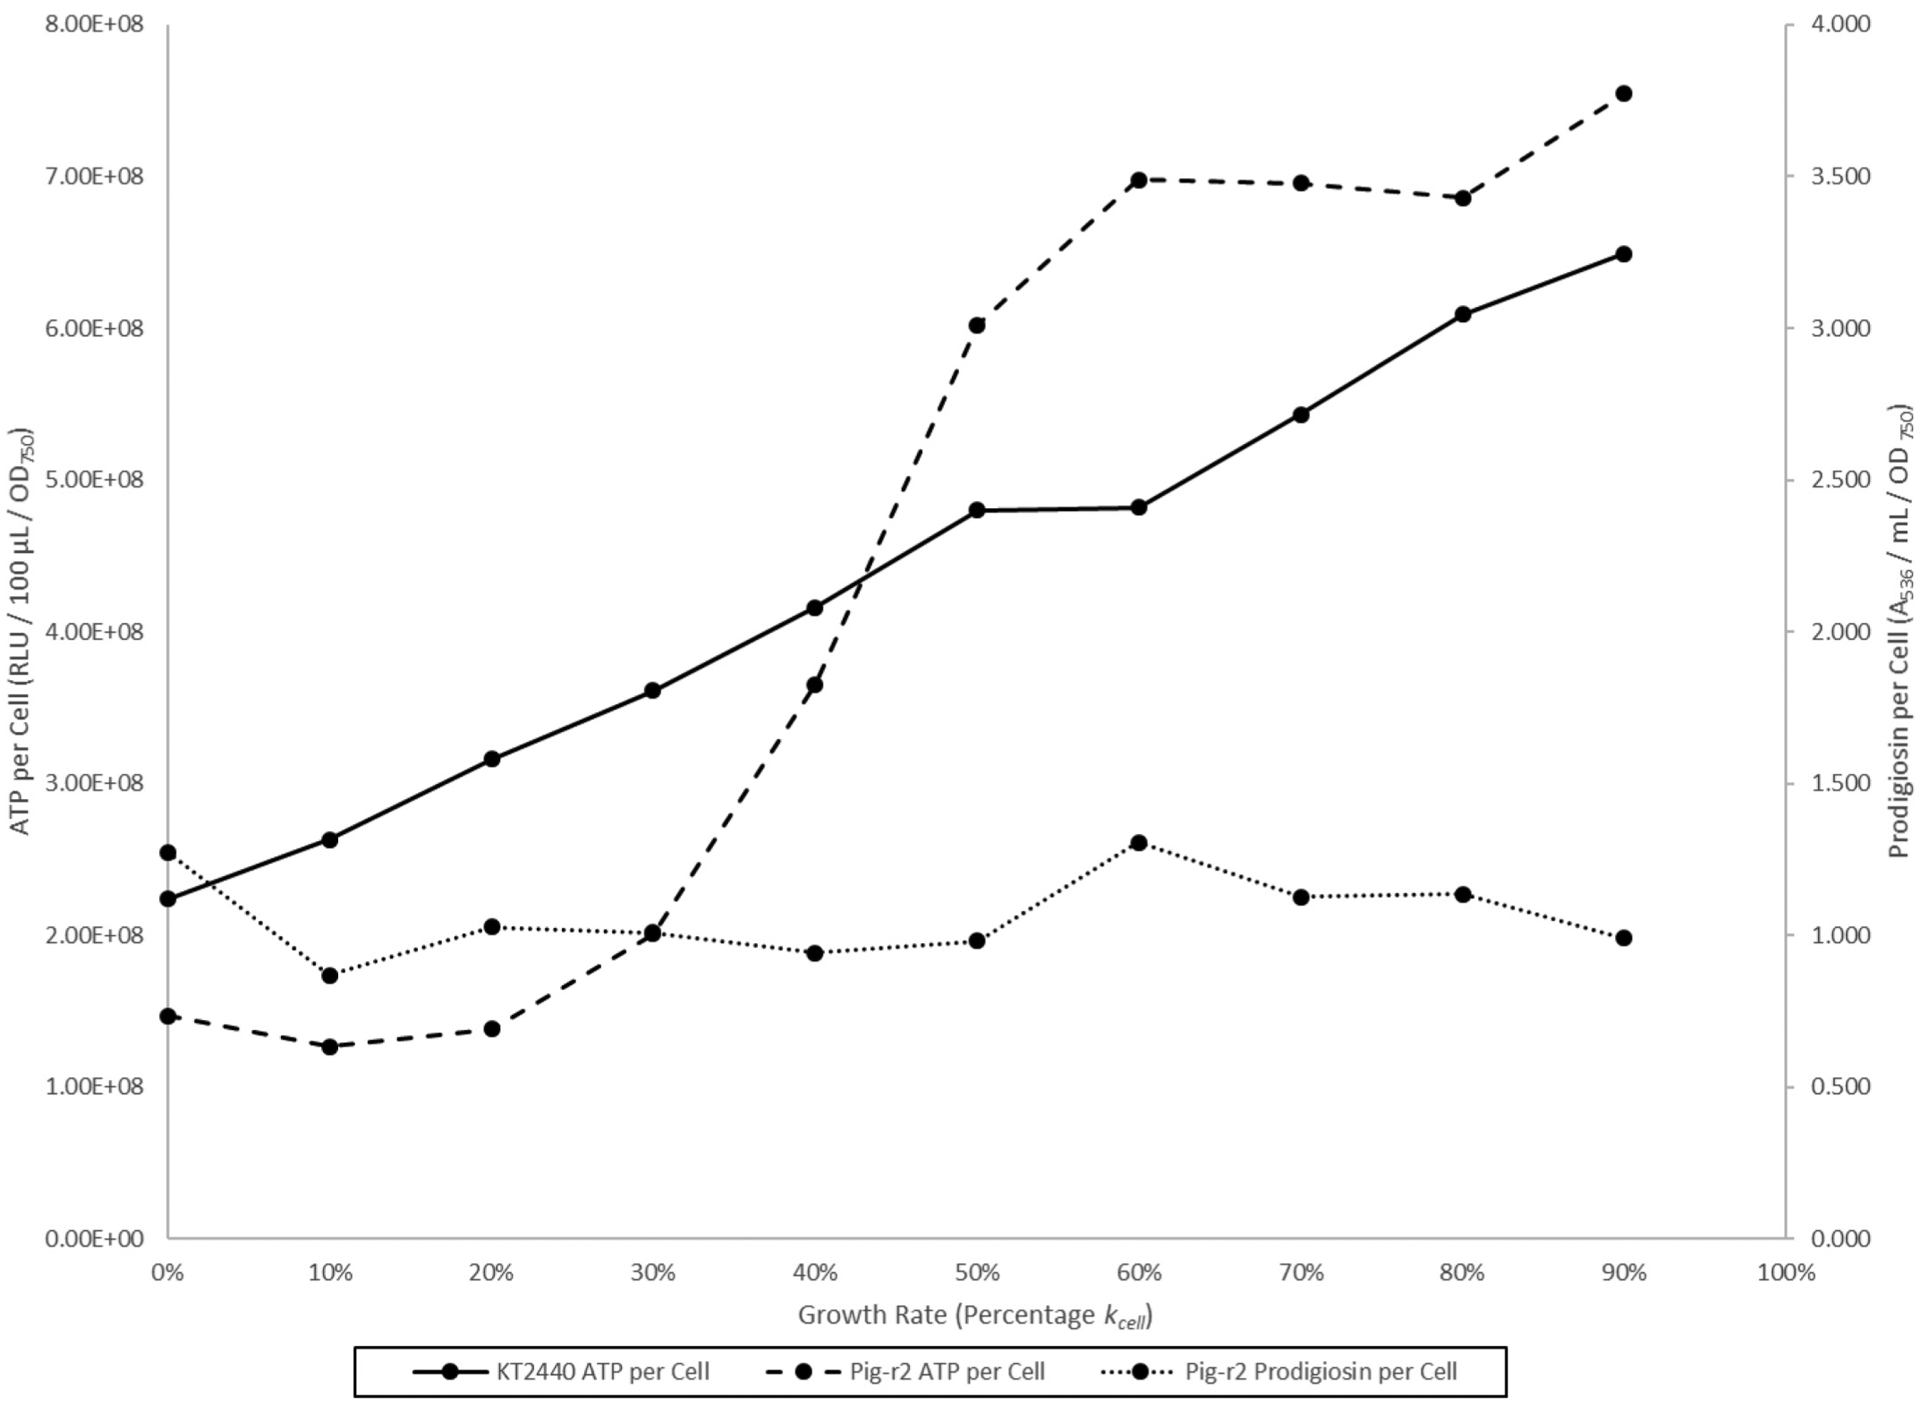
Pseudomonas putida KT2440 (wild type) and pig-r2 (Pig+) ATP per cell curves during growth rate chemostat culture. The figure is a composite from two distinct growth rate chemostat experiments performed in glycerol complex broth at 26 °C. Prodigiosin per cell measurements for strain KT2440 were negligible and are not shown.
Fig. 9.
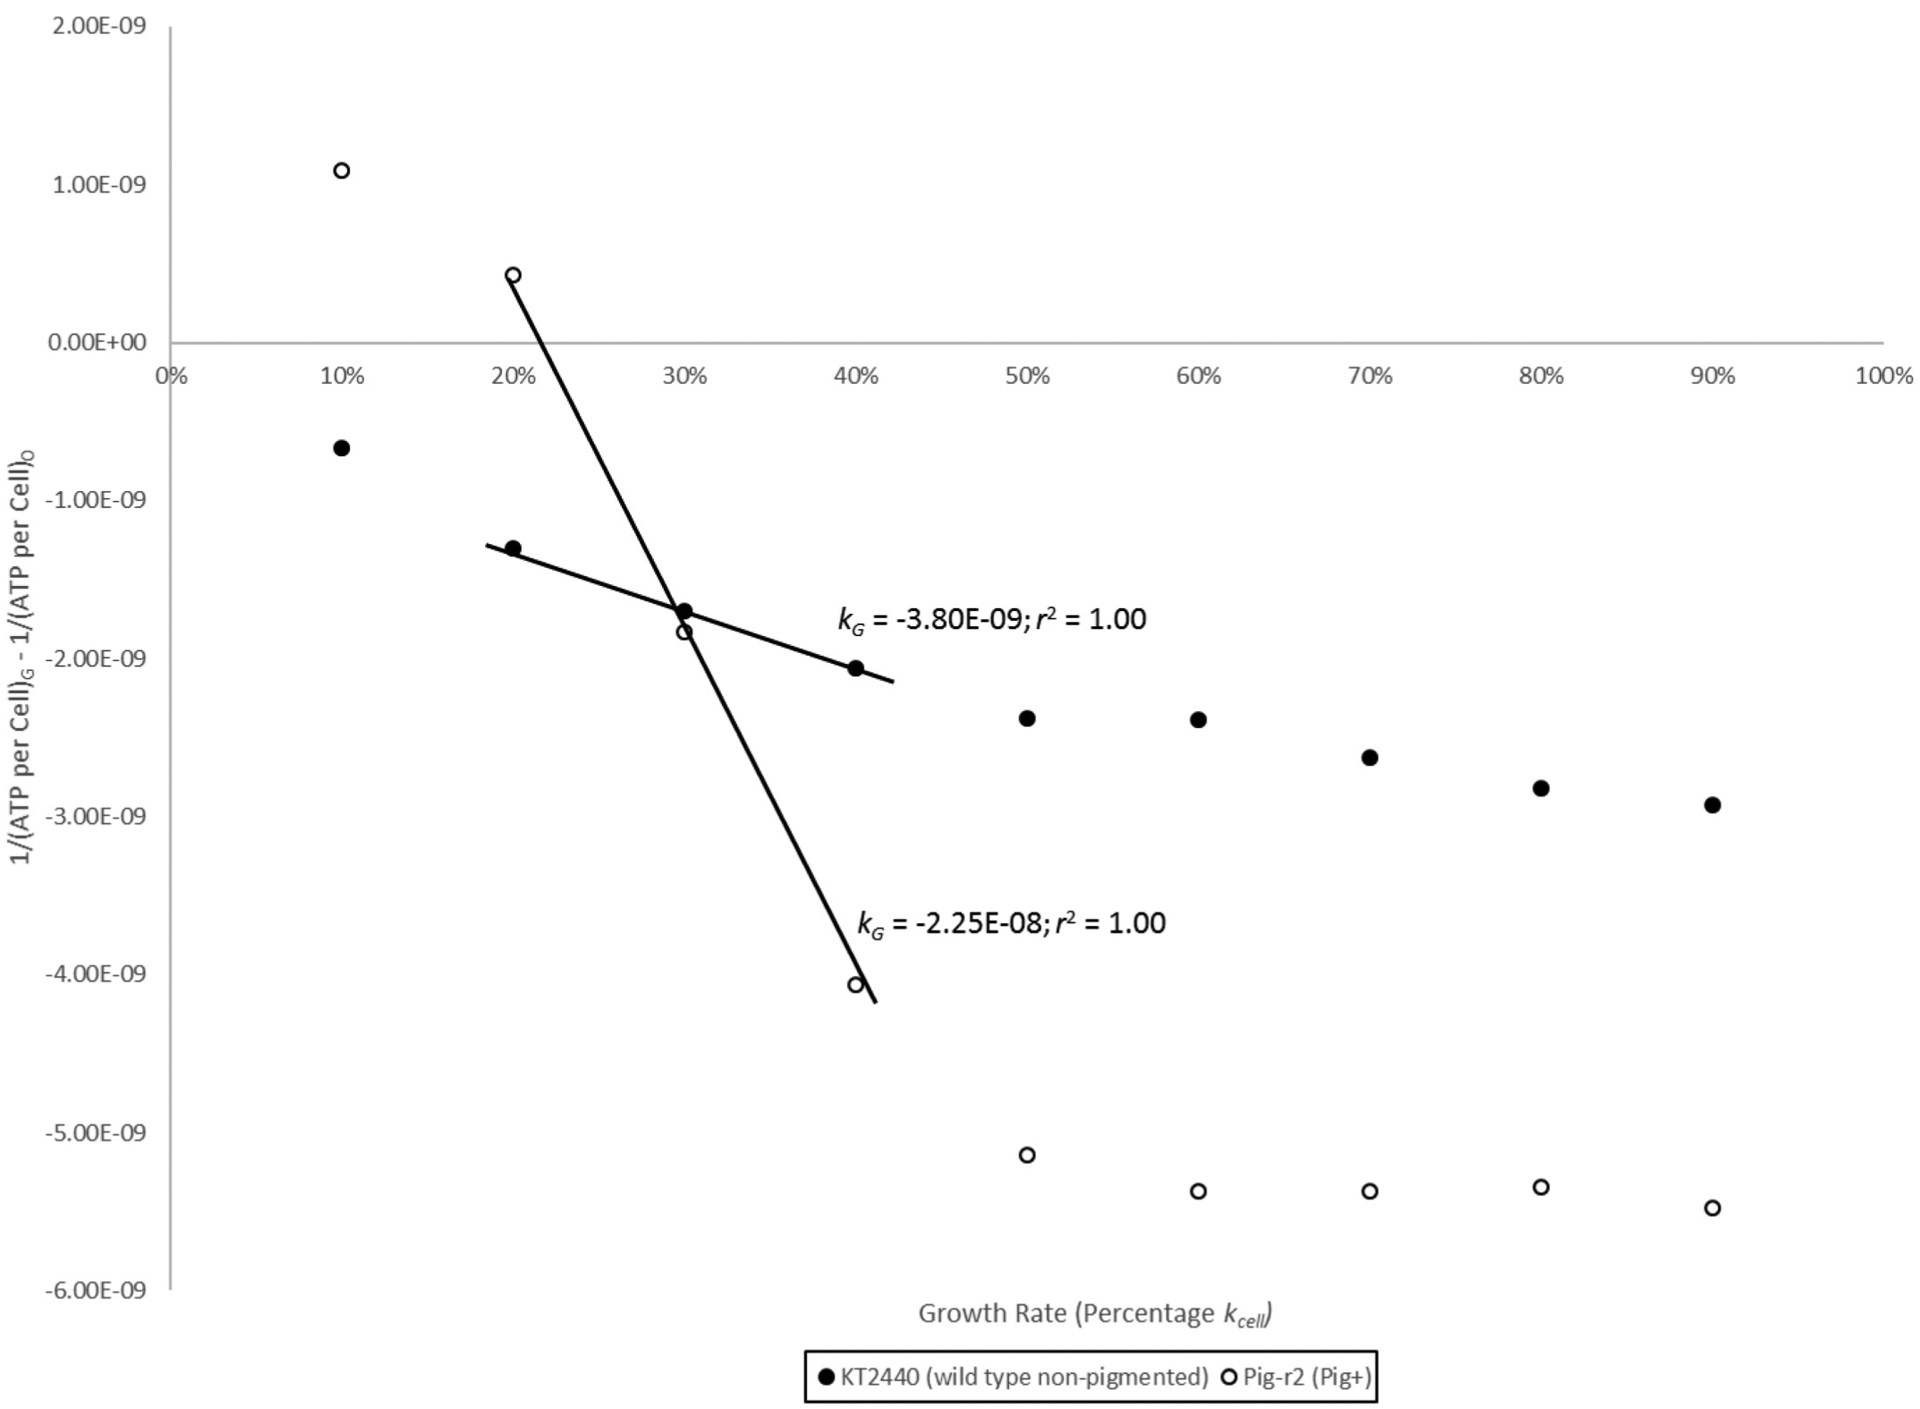
Second-order kinetic modeling of Pseudomonas putida KT2440 (wild-type, nonpigmented) and pig-r2 (Pig+) data from Fig. 8.
Discussion
The experiments described in this work establish a negative correlation between prodigiosin production and cellular levels of ATP in Serratia marcescens under aerobic growth conditions. Artificial prodigiosin induction during both batch and chemostat culture revealed an inversely proportional relationship between these metabolites under high-rate, low cell density growth conditions. Kinetic analysis of data from growth rate-modulated experiments and prodigiosin production in a heterologous bacterium further supported this negative association. Taken together, these results suggest the testable hypothesis that prodigiosin’s in vitro proton import activity is responsible for restricting ATP production by dissipation of the transmembrane proton motive force in the cellular milieu.
Though the possibility exists that prodigiosin’s low-density-phase negative effect on cellular ATP levels (Figs. 1 and 2) reflects an energy drain to synthesize the pigment, two considerations argue against this. First, conversion of the Fig. 2 linear range data to micromoles of analyte per OD750 per hour revealed a 42-fold micromolar excess of prodigiosin production over ATP decline. Because one mole of pyruvate is required per mole of prodigiosin produced (Gerber 1975; Williamson et al. 2006), significant diversion of pyruvate toward prodigiosin production and away from ATP synthesis is unlikely. Second, the maximum S. marcescens batch culture growth rate, which is achieved during low-density growth, remains constant as cellular ATP levels are exponentially reduced (Haddix et al. 2008), implying an energy excess during low-density growth. Final proof of this putative energy-spilling function awaits direct thermal energy release measurements by calorimetric methods.
In a general context, the negative correlation between prodigiosin production and cellular ATP levels suggests that the pigment may function as a molecular mediator of cellular energy spilling. The concept of energy spilling was proposed in 1987 (Tempest and Neijssel 1987) as a mechanism for ridding the cell of excess energy, which is not stored in adenine nucleotides. Investigations by Russell and colleagues into this phenomenon employed Streptococcus bovis, an organism which possesses a membrane-bound F1F0 ATPase but which produces ATP only by substrate-level phosphorylation. These studies (reviewed in Russell 2007) showed that energy spilling in Streptococcus bovis involves ATP hydrolysis by the membrane-bound enzyme to establish a transmembrane proton gradient. Energy is consumed in a futile cycle as protons are then imported by a still unknown mechanism. An interesting study by Tabata et al. (2013) using infrared imaging surveyed colonies of various soil microbes for excess thermal energy relative to the surrounding growth medium. A strain of P. putida was isolated for which growth at a suboptimal rate was accompanied by increased heat production; colony temperature increased with medium richness without a significant increase in cell growth rate. The observation that a mixed population of rumen normal microbiome bacteria can produce measurable thermal energy when challenged with excess glucose (Hackmann et al. 2013) further supports the possible ubiquity of heat-release energy-spilling processes. Beyond bacteria, the mitochondria of eukaryotic cells are known to produce proteins that uncouple the respiratory proton gradient (Sluse 2012). Our observation that pigmented cells grow to reduced yield during the low-density phase (Haddix and Shanks 2018) may indicate an energy-spilling process, but this must be confirmed with measurements of heat release.
The cellular ATP minimum at which the prodigiosin biosynthetic operon is induced was first estimated in a nonpigmented pigA::lacZ mutant strain (Haddix and Shanks 2018). The contribution of prodigiosin to the measurement of the operon induction level was made separately as part of the same study; a 41% overestimation was observed in the absence of prodigiosin. The n = 10 ATP per cell minimum of Fig. 2, which was measured in the context of cell pigmentation, provides a better estimate of the point of pigment induction at high cell density. Using the conversion factors cited in our previous study, the intracellular ATP concentration at which prodigiosin is induced is here more accurately estimated as 260 μmol/L.
The prodigiosin biosynthetic operon is induced at the ATP per cell minimum defining the boundary between low-density and high-density growth phases, implying that prodigiosin’s most fundamental function is manifest at high cell density. Pigmented cells grow to a higher biomass yield (Haddix and Shanks 2018), and ATP accumulates during high-density growth (Figs. 1, 3, and 4). However, an increase in cellular ATP appears to be associated with the high-density condition itself and does not require prodigiosin (Figs. 1 and 6). This situation begs the question of prodigiosin function during high-density growth. Considered broadly, the data are consistent with two possibilities: simple mitigation of a putative low-density negative function during the high-density phase or a functional reversal toward actual supplementation of high-density-phase ATP production. The possibility of a high-density positive function was raised by our previous study (Haddix and Shanks 2018), which showed that prodigiosin enhances the rate of ATP production under the similarly low cellular ATP condition of batch culture lag phase. More detailed studies of ATP production in high-density S. marcescens cultures are underway to provide a fuller picture of the possible effect(s) of prodigiosin on cellular ATP levels throughout the S. marcescens in vitro aerobic growth cycle.
Acknowledgements
The authors thank the following persons for valuable technical support: Mallory O’Connor Anderson, Eric York, Haley Butterbaugh, and D’Ondrea Jaha. PLH was supported by the Research Council of Auburn University Montgomery (AUM) through the equipment and research grant-in-aid programs as well as by the AUM Biology Department. RMQS was supported in part by the Eye and Ear Foundation of Pittsburgh, unrestricted funds to prevent blindness, and the National Institutes of Health grants EY027331 and EY08098.
Contributor Information
Pryce L. Haddix, Department of Biology, Auburn University at Montgomery, P.O. Box 244023, Montgomery, AL 36124-4023, USA.
Robert M.Q. Shanks, Charles T. Campbell Laboratory, Department of Ophthalmology, University of Pittsburgh School of Medicine, 203 Lothrop Street, Pittsburgh, PA 15213, USA.
References
- Belda E, van Heck RG, José Lopez-Sanchez M, Cruveiller S, Barbe V, Fraser C, et al. 2016. The revisited genome of Pseudomonas putida KT2440 enlightens its value as a robust metabolic chassis. Environ. Microbiol 18(10): 3403–3424. [DOI] [PubMed] [Google Scholar]
- Borić M, Danevćić T, and Stopar D 2011. Prodigiosin from Vibrio sp. DSM 14379: a new UV-protective pigment. Microb. Ecol 62(3): 528–536. [DOI] [PubMed] [Google Scholar]
- Danevćić T, Borić Vezjak M, Tabor M, Zorec M, and Stopar D 2016a. Prodigiosin induces autolysins in actively grown Bacillus subtilis cells. Front. Microbiol 7: 27. [DOI] [PMC free article] [PubMed] [Google Scholar]
- Danevćić T, Borić Vezjak M, Zorec M, and Stopar D 2016b. Prodigiosin — a multifaceted Escherichia coli antimicrobial agent. PLoS One, 11(9): e0162412. [DOI] [PMC free article] [PubMed] [Google Scholar]
- Darshan N, and Manonmani HK 2015. Prodigiosin and its potential applications. J. Food Sci. Technol 52(9): 5393–5407. [DOI] [PMC free article] [PubMed] [Google Scholar]
- Domröse A, Klein AS, Hage-Hülsmann J, Thies S, Svensson V, Classen T, et al. 2015. Efficient recombinant production of prodigiosin in Pseudomonas putida. Front. Microbiol 6: 972. [DOI] [PMC free article] [PubMed] [Google Scholar]
- Gerber NN 1975. Prodigiosin-like pigments. CRC Crit. Rev. Microbiol 3(4): 469–485. [DOI] [PubMed] [Google Scholar]
- Grimont PAD, and Grimont F 1984. Family I Enterobacteriaceae. Genus VIII. Serratia Bizio, 1823, 288AL In Bergey’s manual of systematic bacteriology. Vol. 1 Edited by Kieg NR. Williams & Wilkins, Baltimore, Md., USA: pp. 474–484. [Google Scholar]
- Hackmann TJ, Diese LE, and Firkins JL 2013. Quantifying the response of mixed rumen microbes to excess carbohydrate. Appl. Environ. Microbiol 79(12): 3786–3795. [DOI] [PMC free article] [PubMed] [Google Scholar]
- Haddix PL, and Shanks RMQ 2018. Prodigiosin pigment of Serratia marcescens is associated with increased biomass production. Arch. Microbiol 200(7): 989–999. [DOI] [PMC free article] [PubMed] [Google Scholar]
- Haddix PL, Jones S, Patel P, Burnham S, Knights K, Powell JA, and LaForm A 2008. Kinetic analysis of growth rate, ATP and pigmentation suggests an energy-spilling function for the pigment prodigiosin of Serratia marcescens. J. Bacteriol 190(22): 7453–7463. [DOI] [PMC free article] [PubMed] [Google Scholar]
- Heinemann B, Howard AJ, and Palocz HJ 1970. Influence of dissolved oxygen levels on production of l-asparagine and prodigiosin by Serratia marcescens. Appl. Microbiol 19(5): 800–804. [DOI] [PMC free article] [PubMed] [Google Scholar]
- Kobayashi N, and Ichikawa Y 1985. Decrease in respiration activity related to prodigiosin synthesis in Serratia marcescens. Microbiol. Immunol 29(4): 301–308. [DOI] [PubMed] [Google Scholar]
- Loeschcke A, Markert A, Wilhelm S, Wirtz A, Rosenau F, Jaeger K-E, and Drepper T 2013. TREX: a universal tool for the transfer and expression of biosynthetic pathways in bacteria. ACS Synth. Biol 2(1): 22–33. [DOI] [PubMed] [Google Scholar]
- Nakajima M 1965. The mechanism of prodigiosin biosynthesis 1. External factors for prodigiosin biosynthesis. Bull. Osaka Med. Sch 11(1): 39–55. [PubMed] [Google Scholar]
- Nelson KE, Weinel C, Paulsen IT, Dodson RJ, Hilbert H, Martins dos Santos VA, et al. 2002. Complete genome sequence and comparative analysis of the metabolically versatile Pseudomonas putida KT2440. Environ. Microbiol 4(12): 799–808. [DOI] [PubMed] [Google Scholar]
- Russell JB 2007. The energy spilling reactions of bacteria and other organisms. J. Mol. Microbiol. Biotechnol 13(1–3): 1–11. [DOI] [PubMed] [Google Scholar]
- Sato T, Konno H, Tanaka Y, Kataoka T, Nagai K, Wasserman H, and Ohkuma S 1998. Prodigiosins as a new group of H+/Cl− symporters that uncouple proton translocators. J. Biol. Chem 273(34): 21455–21462. [DOI] [PubMed] [Google Scholar]
- Seganish JL, and Davis JT 2005. Prodigiosin is a chloride carrier that can function as an anion exchanger. Chem. Commun. (Camb.) 46: 5781–5783. [DOI] [PubMed] [Google Scholar]
- Slater H, Crow M, Everson L, and Salmond GPC 2003. Phosphate availability regulates biosynthesis of two antibiotics, prodigiosin and carbapenem, in Serratia via both quorum-sensing-dependent and -independent pathways. Mol. Microbiol 47(2): 303–320. [DOI] [PubMed] [Google Scholar]
- Sluse FE 2012. Uncoupling proteins: molecular, functional, regulatory, physiological and pathological aspects. Adv. Exp. Med. Biol 942: 137–156. [DOI] [PubMed] [Google Scholar]
- Suryawanshi RK, Patil CD, Koli SH, Hallsworth JE, and Patil SV 2017. Antimicrobial activity of prodigiosin is attributable to plasma-membrane damage. Nat. Prod. Res 31(5): 572–577. [DOI] [PubMed] [Google Scholar]
- Tabata K, Hida F, Kiriyama T, Ishizaki N, Kamachi T, and Okura I 2013. Measurement of soil bacterial colony temperatures and isolation of a high heat-producing bacterium. BMC Microbiol. 13: 56. [DOI] [PMC free article] [PubMed] [Google Scholar]
- Tempest DW, and Neijssel OM 1987. Growth yield and energy distribution In Escherichia coli and Salmonella typhimurium: cellular and molecular biology. Edited by Neidhardt FC. American Society for Microbiology Press, Washington, DC, USA: pp. 797–806. [Google Scholar]
- van Houdt R, Givskov M, and Michiels CW 2007. Quorum sensing in Serratia. FEMS Microbiol. Rev 31(4): 407–424. [DOI] [PubMed] [Google Scholar]
- Williams RP, Gott CL, Qadri SM, and Scott RH 1971. Influence of temperature of incubation and type of growth medium on pigmentation in Serratia marcescens. J. Bacteriol 106(2): 438–443. [DOI] [PMC free article] [PubMed] [Google Scholar]
- Williamson NR, Fineran PC, Leeper FJ, and Salmond GPC 2006. The biosynthesis and regulation of bacterial prodiginines. Nat. Rev. Microbiol 4(12): 887–899. [DOI] [PubMed] [Google Scholar]
- You Z, Zhang S, Liu X, Zhang J, Wang Y, Peng Y, and Wu W 2019. Insights into the anti-infective properties of prodiginines. Appl. Microbiol. Biotechnol 103(7): 2873–2887. [DOI] [PubMed] [Google Scholar]


