

Abstract
Transcriptional regulation plays a central role in controlling neural stem and progenitor cell proliferation and differentiation during neurogenesis. For instance, transcription factors from the nuclear factor I (NFI) family have been shown to co-ordinate neural stem and progenitor cell differentiation within multiple regions of the embryonic nervous system, including the neocortex, hippocampus, spinal cord and cerebellum. Knockout of individual Nfi genes culminates in similar phenotypes, suggestive of common target genes for these transcription factors. However, whether or not the NFI family regulates common suites of genes remains poorly defined. Here, we use granule neuron precursors (GNPs) of the postnatal murine cerebellum as a model system to analyse regulatory targets of three members of the NFI family: NFIA, NFIB and NFIX. By integrating transcriptomic profiling (RNA-seq) of Nfia- and Nfix-deficient GNPs with epigenomic profiling (ChIP-seq against NFIA, NFIB and NFIX, and DNase I hypersensitivity assays), we reveal that these transcription factors share a large set of potential transcriptional targets, suggestive of complementary roles for these NFI family members in promoting neural development.
Keywords: NFIX, NFIA, NFIB, Cerebellum, External granular layer, Granule neuron
Introduction
Transcription factors are integral to nervous system development, orchestrating a broad range of processes including cell proliferation, migration, differentiation and maturation. The nuclear factor I (NFI) family of transcription factors (NFIA, NFIB, NFIC and NFIX) mediate several of these processes in the developing rodent nervous system [1–3]. For example, during embryogenesis, NFIs regulate cellular proliferation and differentiation in the neocortex, hippocampus, spinal cord and cerebellum [4–12]. Given these key roles of NFIs in the developing nervous system, it is perhaps unsurprising that their expression is highly overlapping. Indeed, NFIs are expressed by a broad range of cell types in the developing central nervous system, including radial glia, intermediate progenitors and neurons [3, 13–16]. In the developing cerebellum, NFIA, NFIB and NFIX are expressed by granule neuron precursors (GNPs) at postnatal day (P) 6 [3]. Thus, the expression of NFIs across key cellular populations, and within multiple brain regions, enables these transcription factors to co-ordinate nervous system development.
The role of the NFIs in nervous system development is also evident through the analysis of knockout mouse models. The phenotypes of Nfi knockout mice are markedly similar. For example, neuroanatomical defects are evident in Nfia, Nfib and Nfix knockout mice, including aberrant development of the corpus callosum and hippocampus [8, 10, 13, 17, 18]. Midline glial populations also fail to develop correctly in Nfia, Nfib and Nfix knockout mice [13, 17, 18], reflecting altered astrocytic development. Indeed, with regard to the development of the neocortex and hippocampus, mice lacking Nfia, Nfib and Nfix show delayed differentiation of radial glial stem cells into mature neurons and glia [8–10, 19], in part due to delayed generation of intermediate progenitor cells [7]. In the cerebellum, NFIX was recently shown to promote GNP differentiation [20], and, whilst the role of other NFI family members in GNP biology is unclear, the expression of NFIA and NFIB by GNPs at P6 [3] is indicative of a role in regulating GNP differentiation. Moreover, NFIs have been shown to bind to the same DNA recognition motif [21]. Collectively, these data suggest that these transcription factors regulate the expression of similar cohorts of genes.
Despite much work outlining the expression and proposed function of NFIs in brain development, whether NFI family members actually regulate similar gene targets is poorly defined. To date, there has been one published report highlighting overlapping NFIA and NFIB gene targets in the developing forebrain [22]. This analysis, whilst insightful, did not include epigenomic data to refine potential gene targets and was performed on a heterogeneous population of cells. We therefore sought to overcome these limitations and examined if NFIs regulate similar gene targets using the developing cerebellum as a model system. In the rodent brain, cerebellar development begins at approximately embryonic day (E) 12, when ATOH1-expressing GNPs are generated in the rhombic lip [23]. These GNPs then proliferate and migrate tangentially, forming a transient germinal zone called the external granule layer (EGL) [23–25]. Cerebellar development continues postnatally, with GNPs proliferating and differentiating into immature neurons, which ultimately migrate radially through the molecular layer, becoming mature granule cells within the internal granule layer (IGL) of the cerebellum [26]. Whilst NFIA, NFIB and NFIX are expressed in GNPs [3], it remains an open question whether or not the NFIs are co-expressed in these cells. Moreover, it is unclear whether these transcription factors share any common gene targets during cerebellar development. Here, we reveal co-expression of the NFI transcription factor family within GNPs of the EGL. Moreover, using a combination of transcriptomic and epigenomic profiling, we reveal that a significant proportion of potential target genes are common between the NFI family members, highlighting the functional complementarity within this group of transcription factors.
Materials and Methods
Animals
All the mice used in this study were maintained on a C57Bl/6 background. Nfia null mice on this genetic background are embryonically lethal. As such, we used a conditional Nfia allele (Nfiafl/fl) crossed to an Atoh1 cre line [27]. This line enabled the ablation of Nfia from ATOH1-expressing cells from embryonic day 9 [25] including the cells of the rhombic lip that will ultimately give rise to GNPs within the EGL of the postnatal cerebellum. Knockout animals were Nfiafl/fl; Atoh1-cre+; controls were Nfiafl/fl; Atoh1-cre−. Animals were used with approval from the University of Queensland Animal Ethics Committee (AEC approval numbers: QBI/143/16/NHMRC/ARC and QBI/149/16/ARC). Animals were genotyped by PCR; primer sequences are available on request. All experiments were performed according to the Australian Code of Practice for the Care and Use of Animals for Scientific Purposes. Pregnant females were acquired by placing male and female mice together overnight. The next day, females were inspected for the presence of a vaginal plug and, if present, this day was designated as E0. The day of birth was designated as P0. Mice were housed in Optimice IVC caging, with double HEPA filters and built-in ventilation. Food and water was available ad libitum, and materials were provided for nesting and enrichment.
Immunohistochemistry
To analyse the cell type-specific expression of NFIA, NFIB and NFIX, we performed co-immunofluorescence labelling, as described previously [14]. Briefly, postnatal mice at P3, P7 or P15 were anesthetised with pentobarbital and perfused transcardially with phosphate-buffered saline (PBS), followed by 4% paraformaldehyde, then postfixed for 48–72 h before long-term storage in PBS at 4 °C. Cerebella were isolated and embedded in Noble agar (3%) and sectioned (50 μm) in a sagittal plane using a vibratome. Sections were placed sequentially across the wells of a 6-well plate to ensure appropriate sampling from different mediolateral regions of the cerebellum. Sections were mounted on SuperFrost Plus (Thermo Scientific) slides, before heat-mediated antigen retrieval was performed in 10 mM sodium citrate solution (pH 6.0) at 95 °C for 15 min. Sections were blocked for 2 h in a solution containing 2% serum and 0.2% Triton X-100 in PBS. Sections were then incubated overnight at 4 °C with primary antibodies against the target proteins (Table 1). Subsequently, sections were rinsed in PBS then incubated with the relevant secondary antibodies (Table 1) for 2 h in the dark at room temperature. Sections were rinsed in PBS then were counterstained with 4′,6-diamidino-2-phenylindole (DAPI) and mounted in fluorescent mounting media (DAKO). For all experiments, at least three animals at each age were analysed.
Table 1.
Antibodies used in this study
| Antibody | Source species | Company | Catalogue number | Dilution used |
|---|---|---|---|---|
| NFIX | Mouse | Sigma-Aldrich | SAB1401263 | 1/200 |
| NFIA | Rabbit | Sigma-Aldrich | HPA008884 | 1/400 |
| NFIB | Rabbit | Sigma-Aldrich | HPA003956 | 1/400 |
| S100β-Alexa647 | Rabbit | ABCAM | AB196175 | 1/400 |
| PAX6 | Rabbit | DAKO | Z0334 | 1/400 |
| Ki67 | Mouse | BD Pharmingen | 550,609 | 1/400 |
Cerebellar Imaging
Fluorescent immunolabelling was visualized using a Nikon × 20 Air objective on a spinning disk confocal microscope (Diskovery; Andor Technology, UK) on a Nikon Ti-E body (Nikon Corporation, Japan), equipped with a Zyla 4.2 10-tap sCMOS camera (Andor Technologies). For comparative sections, identical imaging parameters were used including pin-hole size (70 μm), laser power and exposure time. We took 10 consecutive 1-μm-thick optical sections to generate a 10-μm-thick z-stack. In all cases, the 10-μm z-stack was taken from the middle of the section to minimize potential artefacts arising from the sectioning process such as damage to the tissue. Image acquisition, tiling and stitching were performed using NIS-Elements Advanced Research Imaging software (Nikon Corporation, Japan). All brightfield images were captured using an Aperio ScanScope XT Slide scanner (Leica Biosystems, Germany) with a double × 20 objective (× 40 magnification overall; Nikon Corporation, Japan) and visualized using Aperio ImageScope software.
For analysis of wild-type, Nfiafl/fl; Atoh1 Cre+ and Nfiafl/fl; Atoh1 Cre− mice, high-magnification images were taken of the same lobule of the cerebellum, using at least three biological replicates at each of the ages assessed. For quantification of granule neuron and proliferative markers (PAX6 and Ki67, respectively), three 200-μm regions of the EGL were quantified for each section. This ensured a more representative count of the EGL thickness across the whole lobule. One-micrometre-thick optical sections were viewed in Fiji, and the ‘cell counter’ plugin was used to mark and quantify cells expressing respective markers in each fluorescent channel. Cells co-expressing markers (for example, PAX6 and Ki67) were also quantified this way, and DAPI was used to visualize the cell nucleus, to ensure accuracy, especially in areas of high cell density.
Granule Cell Isolation
To isolate GNPs from the cerebellum of P7 Nfix+/+ and Nfix−/− mice and of P7 Nfiafl/fl; Atoh cre+ and Nfiafl/fl; Atoh cre− mice, we used a technique originally described by Lee and colleagues [28]. To do this, we isolated the cerebellum from wild-type and knockout mice, carefully removing the choroid plexus and meningeal tissue. Cerebellar tissue was dissociated using a 20 units/mL papain solution at 37 °C for 15 min. A single cell suspension was obtained by trituration with a serum-coated P1000 pipette tip, and nuclear membranes were removed using an albumin-ovomucoid inhibitor gradient. GNPs were separated from other cells using a 30–60% Percoll gradient. GNPs were lysed using TRIzol (Ambion). We next used an RNeasy miniprep kit (Qiagen) to isolate RNA from lysed GNPs.
RNA-Seq Analysis
RNA sequencing was performed on the samples using the Illumina NextSeq High-Output system (Illumina; 150-bp-read length, paired-end reads). We isolated cells from three P7 Nfiafl/fl; Atoh cre− mice and three P7 Nfiafl/fl; Atoh cre+ mice. RNA-seq analysis was performed on RNA isolated from P7 cerebella as described previously. Briefly, the three replicates for each cohort were aligned by TopHat2 (v2.0.9) [29] to the Mus musculus, UCSC, mm10 reference transcriptome and FASTA annotation downloaded from the TopHat index and annotations page (https://ccb.jhu.edu/software/tophat/igenomes.shtml). Cufflinks (v2.1.1) [29] was used to assemble each replicate’s transcripts from the alignment file generated by TopHat. Cuffmerge was used to create a single assembly containing transcripts across all samples and replicates. Cuffdiff was run using the merged set of transcripts and the three replicate TopHat2 bam files from each sample.
ChIP-Seq
ChIP-seq was performed on chromatin isolated from P7 wild-type C57Bl/6 GNPs as described [20]. We used antibodies against NFIA, NFIB or NFIX, for which specificity has previously been demonstrated [30]. For chromatin immunoprecipitation, litters of P7 pups were pooled for GNP isolation. Isolated GNPs were crosslinked with 1% formaldehyde for 10 min then were quenched with glycine. Cells were lysed in RIPA buffer supplemented with protease and phosphatase inhibitors (Roche) and sonicated with a Bioruptor (Diagenode) for six 15-min intervals of 30 s on, 30 s rest. Chromatin immunocomplexes were isolated with protein G agarose beads (Roche) and washed once for 5 min with buffers 1 through 4. Crosslinking was reversed by incubation with proteinase K (Roche) at 60° overnight. DNAwas isolated by phenol-chloroform extraction then incubated with RNase A (Roche) for 30 min before final cleanup with PCR columns (Qiagen). Sequencing libraries were constructed using the standard protocol for the NEB Next Ultra II DNA Library Prep Kit (New England BioLabs). Pooled libraries were sequenced on an Illumina HiSeq 2000 (Illumina; 30-bp single-end read).
ChIP-Seq Analysis
Alignment was performed on the NFIA, NFIB and NFIX ChIP-seq datasets by bowtie2 [31] to mm10. Unaligned reads and reads which aligned to multiple locations were removed, leaving only uniquely mapped reads. MACS2 [32] was used to call narrow peaks with default parameters for both datasets. Each experiment contained two biological replicates, and if both biological replicates shared a peak, it was recorded using the maximum boundaries of the supporting peaks to generate a merged set of peaks for each experiment.
Annotation of ChIP-Seq Peaks
A set of target genes was identified for NFIA, NFIB and NFIX by the following method. A promoter region was defined as 2000 bp either side of a transcription start site. ChIP-seq binding sites located in a promoter region were annotated as proximal, whilst sites outside the promoter region but overlapping gene boundaries (transcription start to stop site) were labelled as genic. All remaining binding sites were labelled as distal. A binding site annotated as proximal was assigned to the nearest gene as a target whilst genic binding sites were assigned to the overlapping gene as a target. Distal binding sites are difficult to assign target genes to, as they are not necessarily regulating the nearest gene (by genomic distance) and proximal and genic sites are also capable of regulating a gene other than the nearest. Whilst distal binding sites were also annotated to the nearest gene, where available, CisMapper was used to provide a secondary annotation to all sites, with resulting links filtered to a threshold of 0.05 [33]. Both the CisMapper annotation and nearest gene annotation were used where available.
After identifying a gene target for each NFI binding site, the associated p value from both the Nfix and Nfia RNA-seq differential expression analyses was recorded. Genes targeted by both NFIX and NFIA with a significant (p < 0.05) change in expression in both experiments were extracted. Genes showing co-ordinated positive or negative log fold change values across both experiments were selected to generate a putative set of genes under the control of NFIX and NFIA. Functional annotation was performed using DAVID (6.8) on target genes identified for NFIX, target genes identified for NFIA and target genes under the control of both NFIX and NFIA [34, 35].
DNase I Hypersensitivity Analysis
The DNase I hypersensitivity (DHS) data from Frank et al. [36] (GEO: GSE60731) was accessed for comparison of our transcriptomic and epigenomic profiling. These data contain peaks from whole cerebellar tissue at P7 across three replicates. UCSC LiftOver was used to convert the mm9 files to mm10. Maximum boundaries of the supporting peaks were used to generate a merged DHS peak file, with the stipulation that peaks need to be shared by at least two replicates. Given that transcription factors preferentially bind to regions of accessible chromatin [37, 38], DHS was used to extract NFI ChIP-seq peaks occurring in accessible regions.
qPCR Analysis of Target Genes
RNA isolated from P7 GNPs from the cerebella of Nfix+/+, Nfix−/−, Nfiafl/fl; Atoh cre− or Nfiafl/fl; Atoh cre+ mice was used to prepare cDNA as described previously [9]. qPCR was performed with QuantiFast SYBR Green (Qiagen) to detect gene expression levels of the genes identified in the RNA-seq analysis. The primers for these genes are listed in Table 2. Gene expression was calculated using the 2−ΔΔCt method relative to the housekeeping gene glyceraldehyde 3-phosphate dehydrogenase (Gapdh). All the samples were tested in triplicate within each experiment, and each experiment was repeated three times. qPCR was run using the QuantStudio 7 Flex Real-Time PCR system (Applied Biosystems, USA).
Table 2.
qPCR primers used in this study
| Gene | Forward | Reverse |
|---|---|---|
| Id3 | CTGTCGGAACGTAGCCTGG | GTGGTTCATGTCGTCCAAGAG |
| Wnt5a | CAACTGGCAGGACTTTCTCAA | CCTTCTCCAATGTACTGCATGTG |
| Gas6 | GACCCCGAGACGGAGTATTTC | TGCACTGGTCAGGCAAGTTC |
| Kalrn | AAGACCTACGGAAACTTGTGACG | CCCCGCATGTCGATGATGAC |
| Etv5 | TCAGTCTGATAACTTGGTGCTTC | CTACAGGACGACAACTCGGAG |
| FoxO6 | TCATGGACAGTGACGAAATGG | ACCCAGCTCTGGTTAGGGG |
| Gapdh | GCACAGTCAAGGCCGAGAAT | GCCTTCTCCATGGTGGTGAA |
Results
NFIA and NFIX Are Co-expressed in the Developing Cerebellum
NFI transcription factors are expressed across the developing and adult central nervous system. This includes the cerebellum, where NFIX is broadly expressed in the embryonic, postnatal and adult cerebellum [11, 14] and where it regulates postnatal GNP differentiation [20]. NFIA is also critical for cerebellar development and is expressed by GNPs [3, 39, 40]. Given the broad roles of NFI transcription factors in progenitor cell differentiation and that their protein expression overlaps in other brain regions [22, 41], we first examined whether NFIA and NFIX were co-expressed in GNPs. We used co-immunofluorescence to analyse NFIX and NFIA expression across postnatal cerebellar development (P3, P7 and P15). We found that not only do GNPs in the EGL express NFIX, in agreement with our previous data [14], but we also found that these cells co-express NFIA (Fig. 1). Indeed, analysis at P7 revealed that over 90% of cells within the EGL co-expressed NFIA and NFIX at this age. Expression of Nfi family members is also seen within the embryonic rhombic lip (Supp. Fig. 1).
Fig. 1.
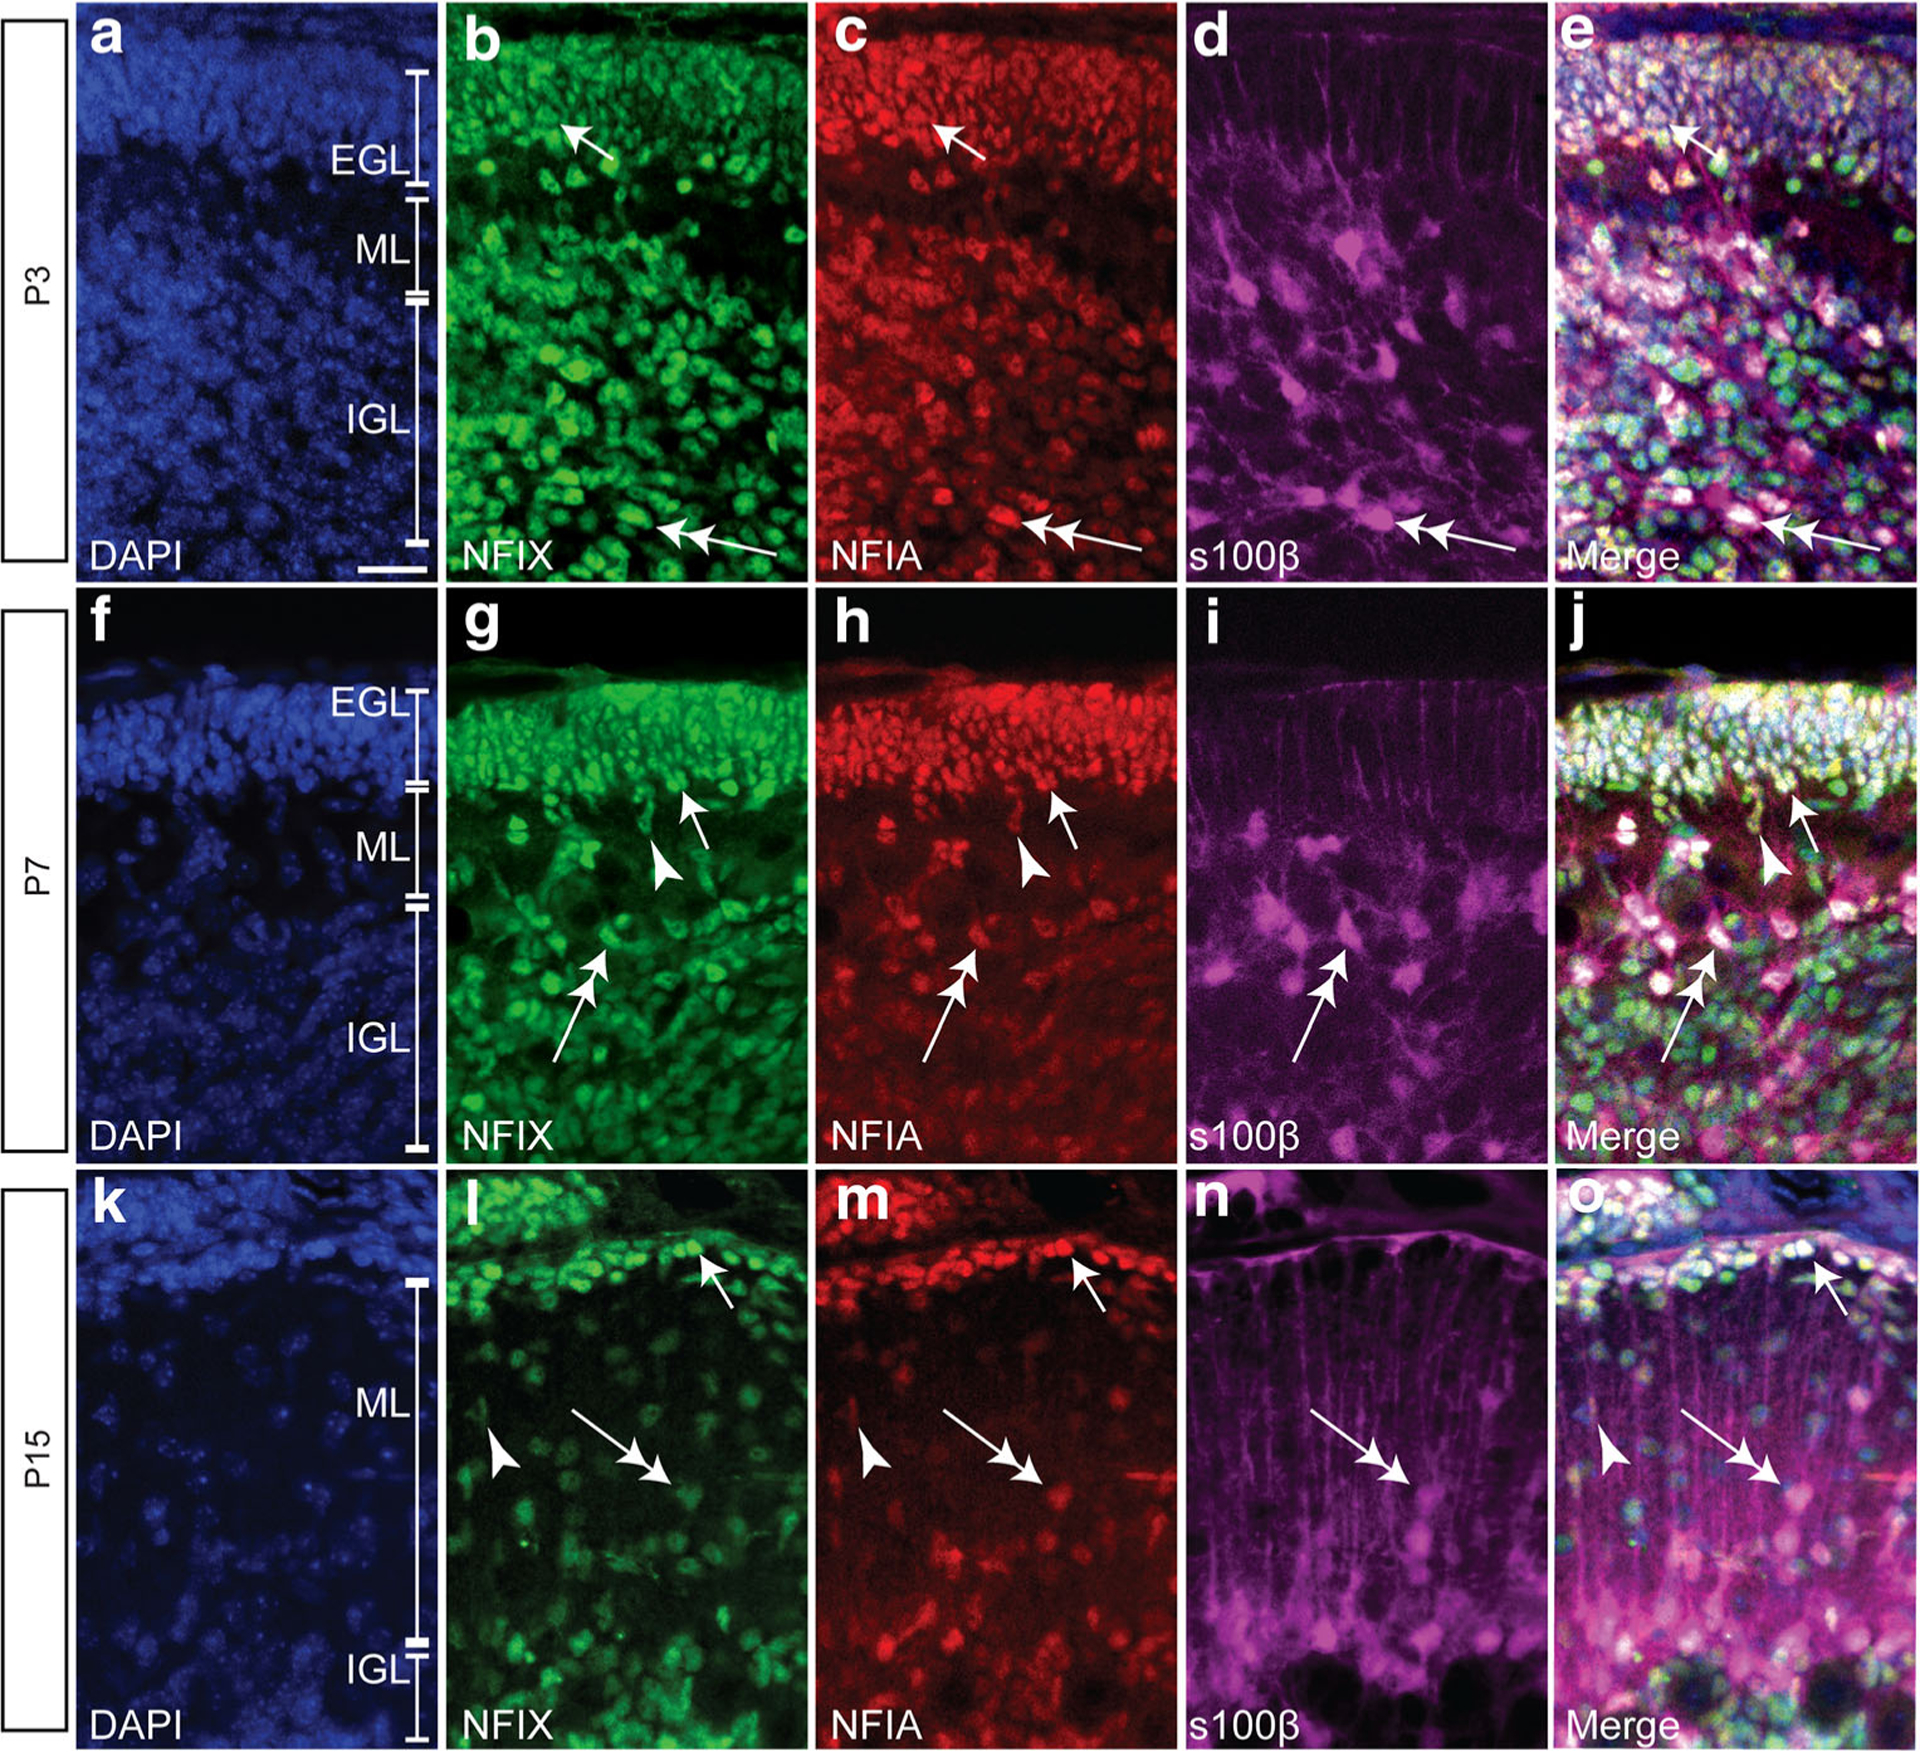
NFIX and NFIA are co-expressed by various cellular populations in the developing mouse postnatal cerebellum. Sagittal cerebellar sections showing the nuclear marker DAPI (blue), NFIX (green), NFIA (red) and s100β expression (magenta) in P3 (a–e), P7 (f–j) and P15 (k–o) wild-type mice. NFIX and NFIA are co-expressed by GNPs within the external granule layer (EGL; arrows in b–e, g–j, l–o). NFIX and NFIA are also co-expressed by s100β-positive glial cells (double-headed arrows in b–e, g–j, l–o). These transcription factors are also expressed by cells leaving the EGL (arrowheads in g–j, l–o); these are likely immature neurons migrating to the internal granule layer (IGL). ML molecular layer. Scale bar (in A) = 20 μm
NFIX expression is also detected within astrocytes within the emerging cerebellum [14]. We also labelled sections with an antibody against the astrocytic marker s100β and revealed that astrocytes within the IGL were immunoreactive for both NFIX and NFIA (Figs. 1 and 2). Moreover, we also found co-expression of NFIX and NFIA in Bergmann glia across these ages (Fig. 2); indeed, we observed that over 95% of s100β-expressing Bergmann glia at P15 were also immunopositive for both NFIA and NFIX. These analyses also revealed that granule neurons within the IGL also co-express NFIA and NFIX (Fig. 2). Finally, to verify the expression of NFIA in GNPs in the EGL, we performed co-immunofluorescence labelling with the progenitor cell marker PAX6 and the proliferation marker Ki67. We found co-expression of NFIA and PAX6 within the EGL (Fig. 3a–d). Consistent with this, those proliferating cells in the EGL were also immunopositive for NFIA (Fig. 3e–h). These data suggest that NFIA, in addition to driving the development of mature cerebellar neurons [3], may also contribute to GNP proliferation and differentiation. Collectively, these data demonstrate that NFIX and NFIA expression is overlapping in the developing cerebellum, with both transcription factors expressed by GNPs within the postnatal EGL. This led us to hypothesise that these transcription factors drive GNP differentiation in the postnatal cerebellum through regulation of common target genes. We sought to address this hypothesis via co-ordinate analysis of transcriptomic and epigenomic profiling datasets.
Fig. 2.

NFIX and NFIA are co-expressed in Bergmann glia and astrocytes in the developing cerebellum. High magnification sagittal cerebellar sections showing the nuclear marker DAPI (blue), NFIX (green), NFIA (red) and s100β expression (magenta) in P3 (A–J), P7 (K–T) and P15 (U–DD) wild-type mice. NFIX and NFIA are co-expressed in IGL white matter astrocytes at these ages (arrows in B–D, L–O, V–Y). NFIX and NFIA are also co-expressed in Bergmann glia at P3, P7 and P15 (arrowheads in G–J, Q–T, AA–DD). The NFI factors are also co-expressed in mature granule neurons within the IGL (double-headed arrows in B–D, L–O, V–Y). IGL inner granule layer, ML molecular layer. Scale bar (in A) = 10 μm
Fig. 3.

PAX6-positive EGL progenitors express NFIA. a–d Expression of the nuclear marker DAPI (blue, a), PAX6 (green, b) and NFIA (red, c) reveals NFIA expression in PAX6-positive EGL progenitor cells (arrows in b–d). NFIA is also expressed in IGL granule neurons (double-headed arrows in b–d) and migrating cells exiting the EGL (arrowheads in b–d). e–h Expression of the nuclear marker DAPI (blue, e), Ki67 (green, f) and NFIA (red, g) also shows NFIA expression in proliferating EGL progenitor cells (arrows in f–h). EGL external granule layer, ML molecular layer, IGL inner granule layer. Scale bar (in a) = 20 μm
Nfia cKO Mice Exhibit Cerebellar Abnormalities
To determine the extent of overlap in function between NFI family members in cerebellar GNPs, we first sought to define the cohort of genes potentially under direct control of NFIA. To do this, we used a number of transcriptomic and epigenomic sequencing approaches, as well as utilising published DNase I hypersensitivity analyses detailing chromatin accessibility within the whole cerebellum at P7 [36]. As Nfia null mice on a C57Bl/6 are embryonically lethal [17], we employed a conditional Nfia allele (Nfiafl/fl) crossed to an Atoh1 cre line [27]. ATOH1 is expressed by progenitor cells within the nascent rhombic lip from E9 [25] and thus enables the removal of Nfia from these cells, as well as their progeny, including GNPs. We crossed the Nfiafl/fl line to the Atoh1 cre and analysed NFIA expression in GNPs within the postnatal cerebellum (P7) to validate ablation of Nfia. Immunolabelling with NFIA, and PAX6, revealed that NFIA expression was still present within cells at the border of the IGL (likely Bergmann glia that are not derived from Atoh1-expressing progenitor cells within the embryonic brain) and within the IGL (Fig. 4). However, expression of NFIA was dramatically reduced within the EGL of Nfiafl/fl; Atoh1 cre+ mice (hereafter referred to as Nfia cKO mice). Interestingly, the ablation of Nfia was not fully penetrant within all of the lobes of the cerebellum, with GNPs within lobe X retaining a higher percentage of NFIA expression in comparison to lobes IV–V and VIII (Fig. 4(E–G)). Incomplete ablation of a conditional Nfib allele was recently reported [7], suggesting that some cells may escape Cre-mediated depletion when this strategy is used to ablate Nfi family members. Thus, the NFIA-expressing cells within the IGL of Nfia cKO mice likely comprise astrocytes (Fig. 2) and granule neurons derived from EGL progenitors in which Nfia was not deleted. Despite this caveat, these data suggest that this is a valid model in which to study the role of NFIA in GNP biology.
Fig. 4.
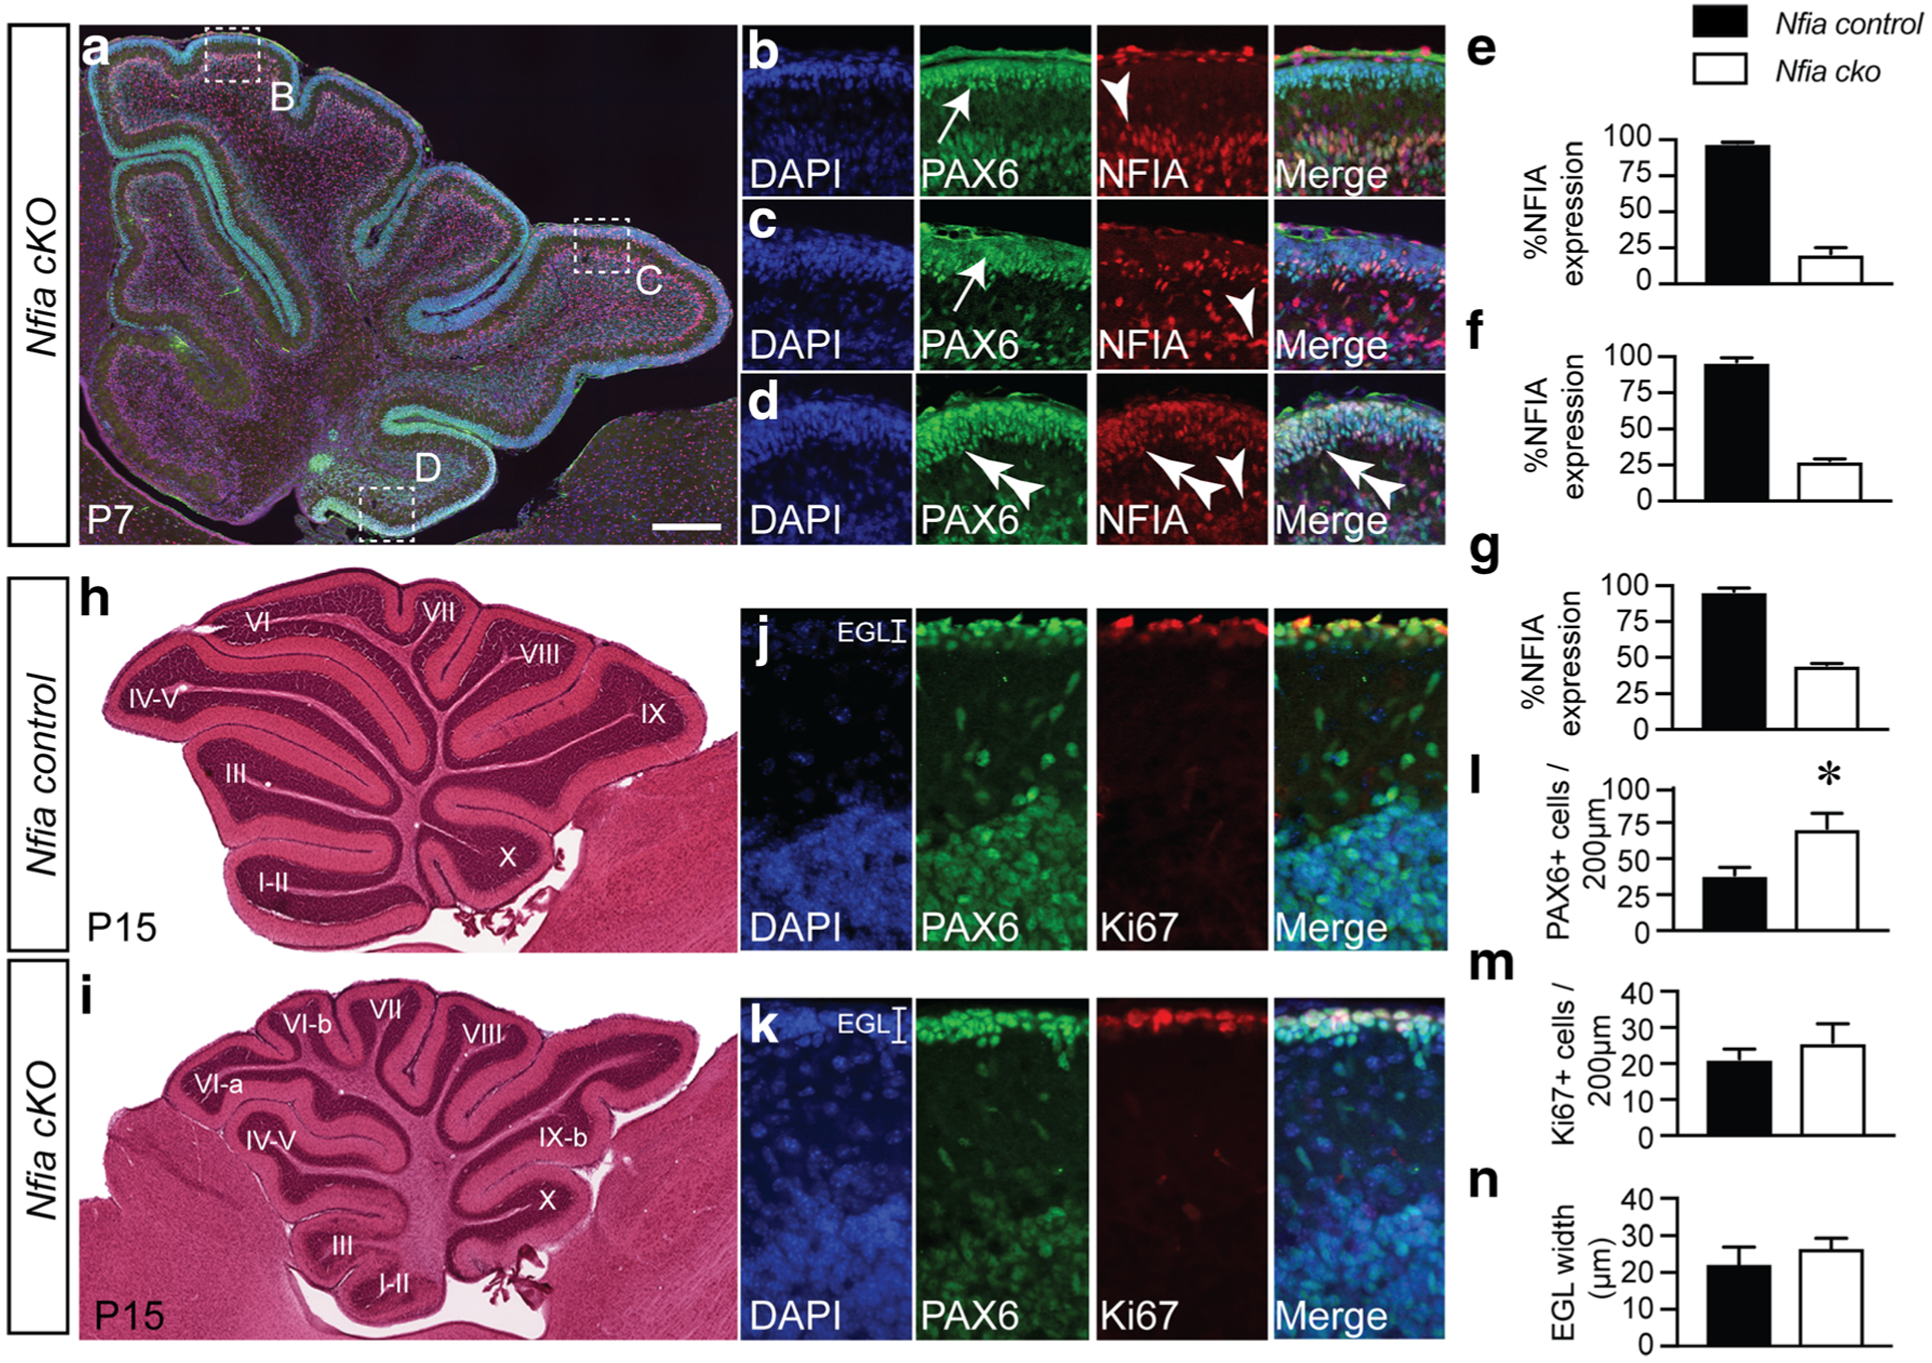
Conditional ablation of NFIA from EGL progenitors using Atoh1-cre. (A) Sagittal cerebellar section in a P7 Nfiafl/fl; Atoh1-cre+ mouse (Nfia cKO). Co-expression of PAX6 and NFIA was examined in different cerebellar lobes and is shown in the respective high-magnification panels (B–D). (B–D) DAPI (blue), PAX6 (green) and NFIA (red) expression revealed that cells at the margin of the molecular layer and IGL expressed NFIA (arrowheads in B–D). Importantly, the majority of cells in the EGL of lobes VI and IX were immunopositive for PAX6 but did not express NFIA (arrows in B, C). Within lobe X, there were more cells within the EGL that had not undergone Cre-mediated ablation and hence retained NFIA expression (double arrowheads in D). (E–G) Quantification of the percentage of cells within the EGL of lobes VI (E), IX (F) and X (G) that expressed NFIA. (H, I) Haematoxylin staining of Nfia control and Nfia cKO cerebella at P15. The cerebellum of mice lacking Nfia was dysmorphic, with elevated foliation of the cerebellar lobes evident. Expression of DAPI, PAX6 and Ki67 in Nfia control (J) and Nfia cKO (K) cerebella at P15 revealed significantly more PAX6-positive cells within the EGL of the mutant (L), although the number of proliferating cells (M), and the width of the EGL (N), was not significantly different between sample groups. *p < 0.05, t test. Scale bar = 250 μm, in A; 400 μm, in H and I; 30 μm, in B–D; and 25 μm, in J and K
The role of NFIA in cerebellar development has been studied almost exclusively through the prism of the migration and maturation of postmitotic granule neurons [39, 40, 42]. In other regions of the nervous system, such as the developing hippocampus, Nfia−/− mice exhibit very similar phenotypes to Nfix−/− mice [8, 10]. Given that a delay in the differentiation of GNPs is evident in the cerebellum of P15 Nfix−/− mice, we posited that a similar delay would be evident in Nfia cKO mice. We firstly analysed the gross morphology of the cerebellum in Nfia control and Nfia cKO mice. In contrast to Nfix−/− mice [20], haematoxylin staining at the level of the vermis revealed increased foliation in Nfia cKO mice in comparison to the controls, with lobe VI showing the clearest phenotype (Fig. 4(H, I)). Critically, however, PAX6 and Ki67 labelling revealed there were more PAX6-positive cells within the EGL of the mutant at this age in comparison to controls (Fig. 4(J–M)), although the width of the EGL was comparable between mutant and control animals at this age (Fig. 4(N)). These data reveal that the retention of PAX6-expressing GNPs within the EGL is a shared phenotype between mice lacking either Nfia or Nfix.
Transcriptomic Profiling in GNPs Reveals Common Gene Targets of the NFI Transcription Factor Family
The co-expression of NFIA and NFIX (Fig. 1), coupled with the retention of GNPs within the EGL at P15 in both strains (Fig. 4) [20] led us to posit that these transcription factors may regulate a common set of genes during GNP development. We have recently detailed transcriptomic profiling (RNA-seq) of Nfix−/− P7 GNPs, coupled with genome-wide analysis of NFIX binding (ChIP-seq) [20]. To determine the extent of shared targets between NFIA and NFIX, we repeated these analyses with NFIA. Firstly, we isolated P7 control and Nfia cKO GNPs and performed RNA-seq. Analysis of these datasets revealed 2267 genes as being significantly misregulated in the absence of Nfia (Fig. 5a, Supp. Table 1). Profiling of these data using the Gene Ontology and Pathway tool in DAVID [34, 35] revealed a suite of different biological processes (e.g. cell adhesion, nervous system development), cellular components (e.g. membrane, proteinaceous extracellular matrix) and molecular functions (e.g. calcium ion binding, integrin binding) (Fig. 5b, Supp. Table 2).
Fig. 5.
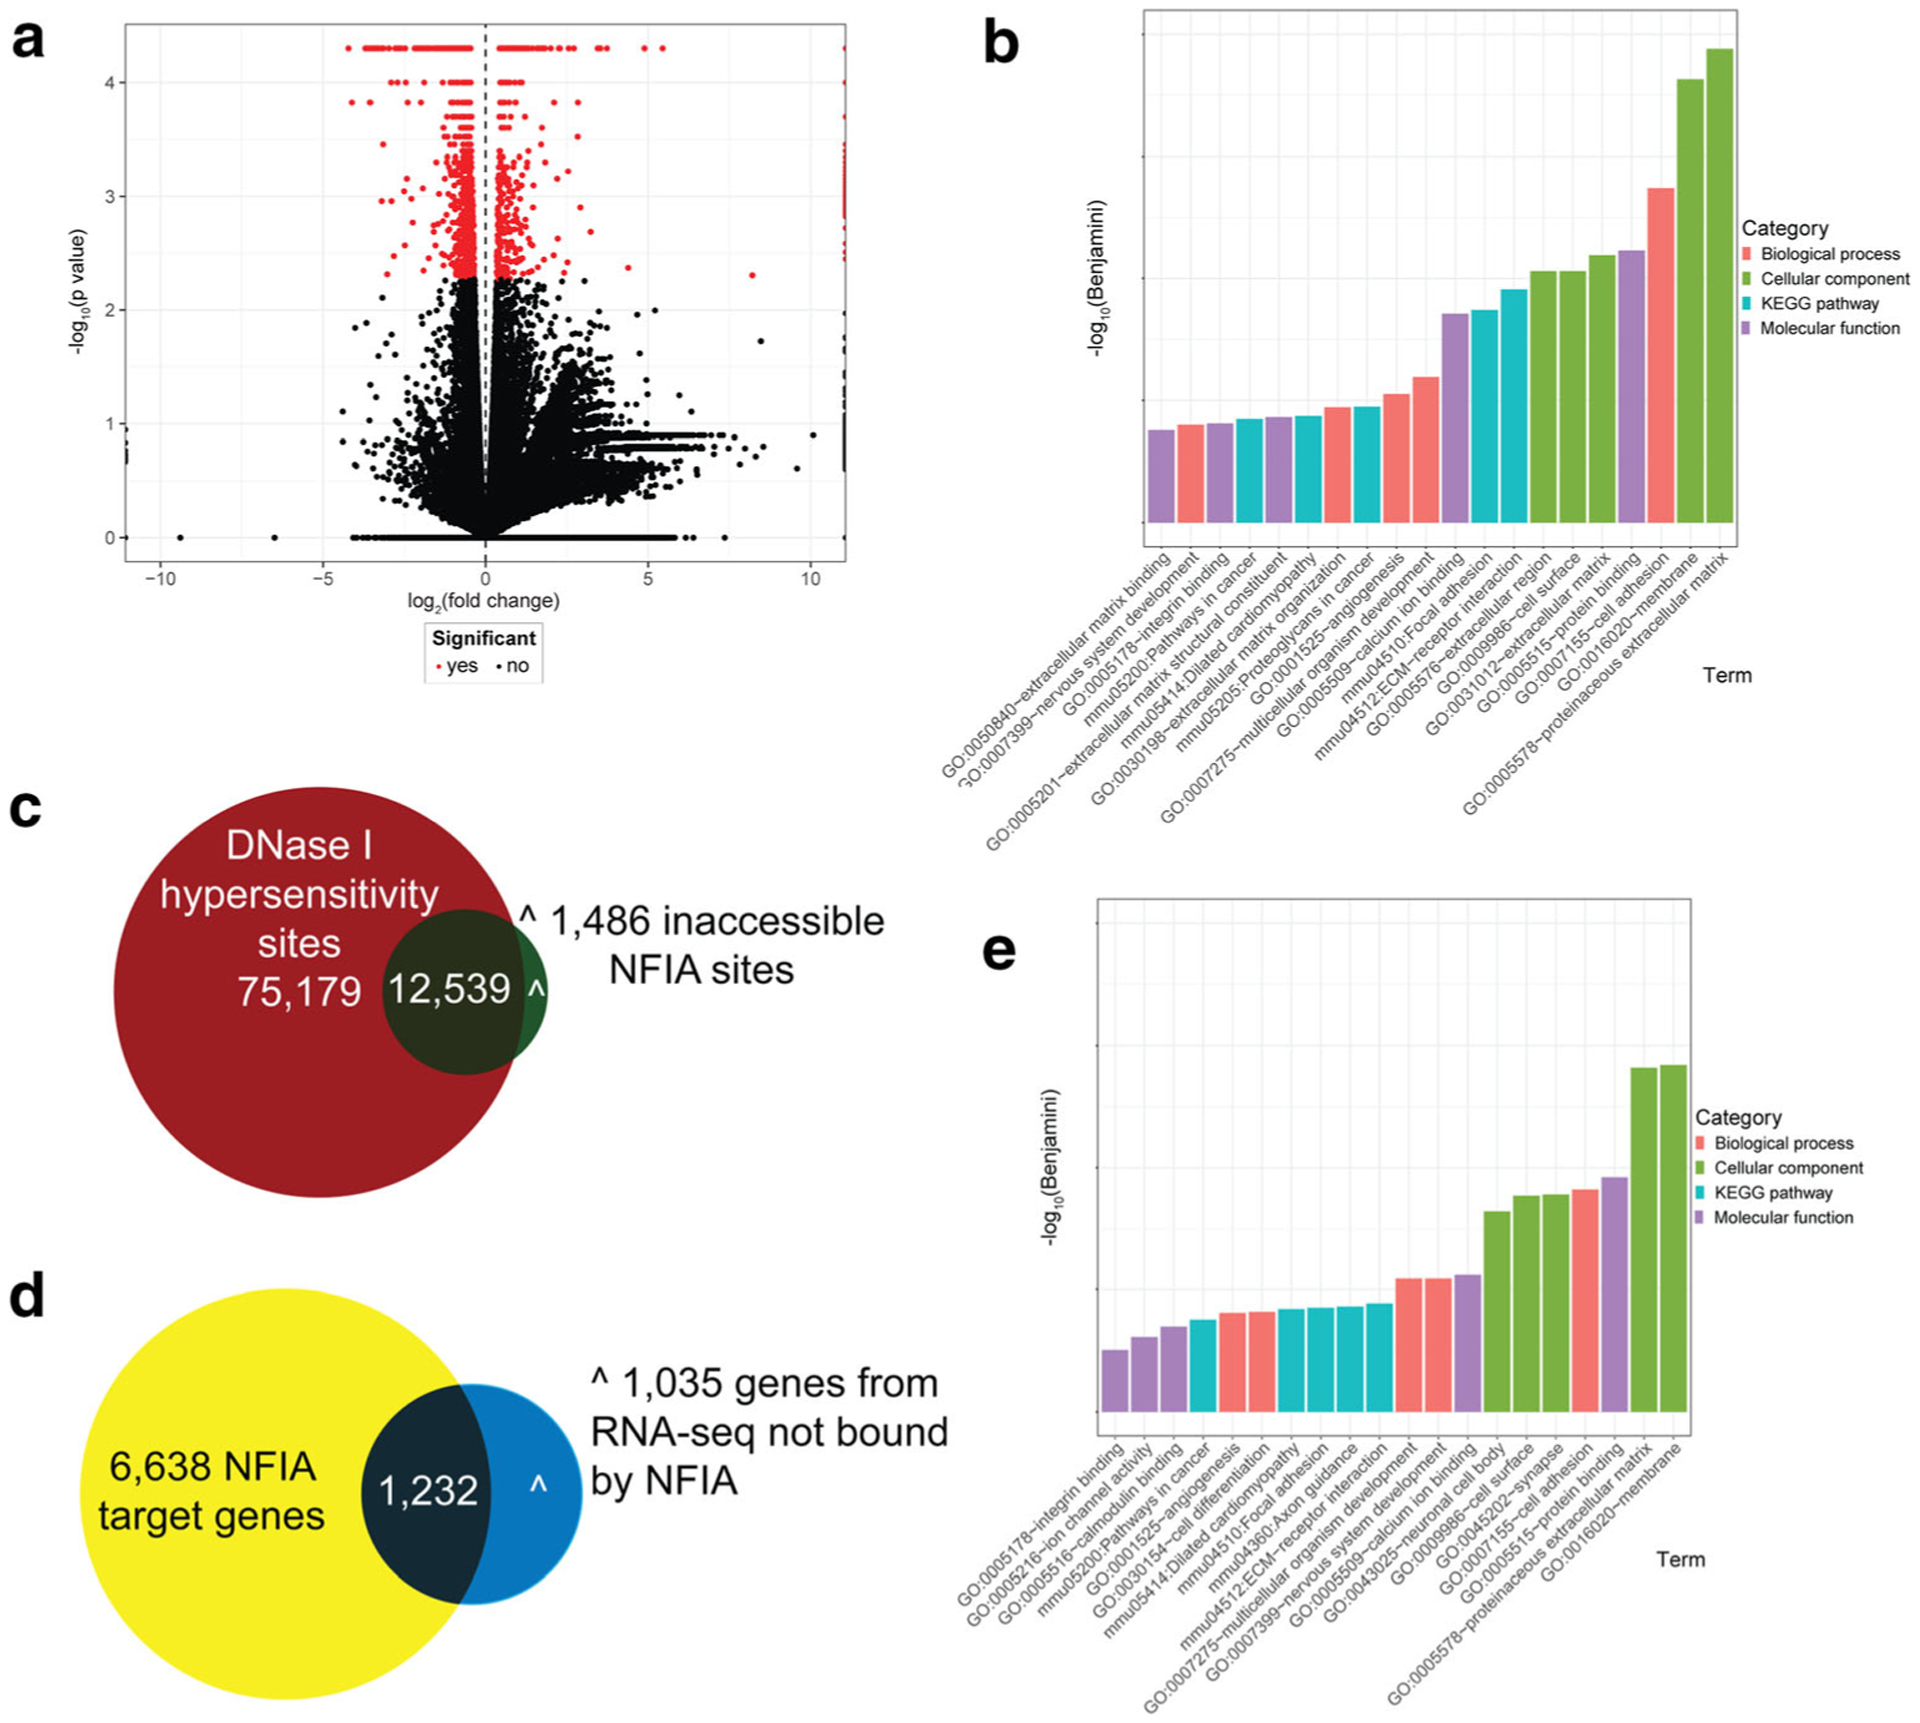
Transcriptomic profiling of GNPs in Nfiafl/fl; Atoh1-cre+ mice. a Volcano plot of misregulated genes following RNA-seq in P7 Nfia cKO mice GNPs in comparison to Nfia controls. Red dots represent the 2267 genes misregulated in Nfia mutant GNPs. b Gene Ontology (DAVID 6.8) analysis identifying biological processes, cellular components, KEGG pathways and molecular functions as misregulated in P7 Nfia cKO mice GNPs in comparison to controls. Only the top five items for each category are shown; full details can be found in Supp. Table 2. The p value was corrected using the Benjamini-Hochberg method. c To narrow the list of potential NFIA target genes, we performed ChIP-seq on wild-type P7 GNPs with an anti-NFIA antibody. This revealed 14,025 NFIA binding peaks (green circle). We compared this with a published DNase I hypersensitivity analysis of P7 cerebellar tissue (red circle) [36]. Of the 14,025 NFIA ChIP peaks, 12,539 were in regions of accessible chromatin. d We then compared the 7870 genes (yellow circle) associated with these 12,539 NFIA peaks with our RNA-seq data (blue circle). This analysis identified 1232 potential direct NFIA target genes. e DAVID Gene Ontology analysis was performed again following refinement of our target gene list. The top five categories for the NFIA targetome from each of biological processes, cellular components, KEGG pathways and molecular functions identified are shown; full details can be found in Supp. Table 2
To begin to refine this potential list of NFIA target genes, we performed ChIP-seq with an NFIA-specific antibody [30], using GNPs isolated from wild-type P7 cerebella. This profiling identified 14,025 NFIA binding peaks (Supp. Table 3). Cross correlation of these data with published chromatin accessibility data (DNase I hypersensitivity analysis) from P7 cerebellum [36] revealed that 12,539 of these NFIA binding peaks were in accessible regions of chromatin, whereas 1486 were in closed regions of chromatin (Fig. 5c). Interestingly, the 12,539 NFIA ChIP-seq peaks in regions of accessible chromatin correlated to 7870 NFIA-bound genes. When we took this cohort of 7870 genes and compared it to the list of differentially regulated genes within Nfia cKO GNPs (Fig. 5a), we determined that 1232 of the 2267 genes that were significantly misregulated also contained a NFIA ChIP binding peak (Fig. 5d, Supp. Table 4), highlighting them as strong candidates for direct regulation by NFIA. Critically, DAVID analysis on this NFIA targetome of 1232 genes identified many processes and functions previously identified in our analysis of Nfix-deficient GNPs [20], including many associated with neural function (e.g. axon guidance, neuronal cell body, cell adhesion) (Fig. 5d, Supp. Table 2), indicative of potential shared functions of these transcription factors.
Finally, to define whether or not NFIA and NFIX regulate a common cohort of genes, we compared our refined NFIA targetome (1232 targets; Fig. 5) with an analysis performed the same way but targeting NFIX (578 targets) [20]. This analysis revealed that 304 genes were high-confidence targets for both NFIA and NFIX in P7 GNPs, and, moreover, that more than 93% of these (283 out of 304) were co-ordinately regulated by both NFIA and NFIX (i.e. gene was downregulated in both Nfia cKO and Nfix−/− datasets or upregulated in both) (Fig. 6, Supp. Table 5).
Fig. 6.

Identification of co-regulated targets of NFI family members in GNP development. a Cross comparison of our NFIA targetome (red circle) with a similar analysis performed against NFIX (blue circle) [20] revealed that there were 304 co-regulated genes (i.e. identified in both datasets). Of these, 283 demonstrated co-ordinated regulation (i.e. either upregulated in RNA-seq experiments from P7 GNPs in both Nfia cKO GNPs and Nfix-deficient GNPs, or downregulated in both). Of these 283 co-ordinated targets, 282 also possessed an associated NFIB ChIP-seq peak (Supp. Table 3), indicative of shared regulatory roles for all three NFI family members in GNP biology. b DAVID Gene Ontology analysis was performed on these 282 genes. The top five categories from each of biological processes, cellular components, KEGG pathways and molecular functions identified are shown; full details can be found in Supp. Table 2. The p value was corrected using the Benjamini-Hochberg method. c Curated list of genes from DAVID analysis (biological processes), highlighting downstream NFI targets (upwards pointing arrow denotes messenger RNA (mRNA) upregulation in mutant GNPs, downwards pointing arrow denotes mRNA downregulation in mutant GNPs). d Analysis of ChIP-seq binding events for NFIA, NFIB and NFIX, showing the proportion of distal, promoter and genic binding. e–j Validation of potential NFI targets using qPCR. *p < 0.05; **p < 0.01; ***p < 0.001, t test
NFIB is also expressed by NFIX-expressing GNPs within the postnatal cerebellum (Supp. Fig. 1) [3]. Although we did not have access to the conditional strain crossed to a cerebellum-specific driver, we were able to gain insight into potential NFIB targets by performing ChIP-seq on isolated P7 GNPs using a specific NFIB antibody [30]. This analysis identified 24,950 NFIB ChIP-seq peaks (Supp. Table 3), of which 21,712 were in regions of accessible chromatin. Comparison of the accessible binding sites in each of the three NFI ChIP-seq datasets revealed that, of the 22,129 sites where at least one of NFIA, NFIB or NFIX had a binding event associated with it, ~ 25% were bound by all three of these transcription factors (Supp. Fig. 3). Furthermore, over 55% of sites were bound by two of the NFI family (Supp. Fig. 3). Importantly, when we overlaid our NFIB ChIP-seq results onto our combined NFIA/NFIX targetome (Fig. 6a), the analysis that revealed that 282 of the 283 co-ordinately regulated NFIA/NFIX target genes also possessed an associated NFIB ChIP-seq peak. DAVID analysis revealed that categories enriched in this dataset included axon, neuron projection, neuronal cell body and nervous system development (Fig. 6b). This cohort of genes potentially targeted by NFIA, NFIB and NFIX included a number of genes known to mediate cerebellar development, including Otx2, Epha4 and Nfix itself, as well as a number of factors whose role in cerebellar genesis is novel (Fig. 6c). Analysis of the proportion of NFI ChIP-seq peaks in proximal, genic or distal locations revealed that the majority of binding sites were in distal or genic locations (Fig. 6d). Finally, we validated six of these misregulated genes using qPCR, focussing on a mix of genes with known (Wnt5a) and novel (Kalrn, FoxO6, Id3, Gas6 and Etv5) roles in cerebellar development. We confirmed that the levels of Kalrn, Wnt5a, FoxO6, Id3, Gas6 and Etv5 mRNAs were significantly higher in both Nfia−/− and Nfix−/− GNPs at P7 (Fig. 6e–j).
Discussion
The NFI proteins are transcription factors that exhibit conserved N-terminal DNA binding domains, as well as a common DNA recognition motif [43]. Within the nascent mouse nervous system, neural stem and progenitor populations have been shown to co-express individual NFI family members [1], and moreover, individual Nfi knockout mice exhibit broadly similar cortical phenotypes [4, 8, 10, 12]. However, the extent to which these factors share common regulatory targets has not been investigated thoroughly, apart from a recent study that used RNA-seq in developing cortical tissue from both Nfia−/− and Nfib−/− mice to investigate potential overlap in gene regulation [30]. Here, we use a range of transcriptomic approaches to more clearly demarcate common targets of the broader NFI family, demonstrating that NFIA, NFIB and NFIX likely regulate a common suite of genes to promote the differentiation of GNPs within the postnatal cerebellum.
A coherent theme emerging from many of the studies on NFI function is their role in promoting differentiation and maturation. Within the cerebellum, NFIX is required for the timely differentiation of GNPs within the postnatal EGL [20], and NFIA has been reported to regulate a program of gene expression required for the migration and maturation of granule neurons [3, 39, 42]. Within the broader central nervous system, NFIB has also been shown to regulate neural stem cell differentiation within the cerebral cortex [5], a function also reported for NFIA and NFIX [44]. Outside the nervous system, NFIs have also been shown to regulate differentiation; for instance, NFIX has been shown to contribute to skeletal myogenesis by promoting a switch from embryonic to foetal-specific gene programs [45, 46]. In line with this, our transcriptomic analyses suggest that the NFI family is a key mediator of GNP differentiation within the postnatal cerebellum. Indeed, our DAVID analysis of the 282 genes we identified as potential NFI targets included a high proportion of terms associated with the nervous system (Supp. Table 2). For instance, of the 20 most enriched terms for cellular component in the DAVID analysis, 10 were directly associated with the nervous system (e.g. neuron projection, axon, dendrite, neuronal cell body), with a further seven associated with the plasma membrane and extracellular matrix, both of which are central to mature neural biology. These data reinforce the role for NFIs in promoting neural differentiation within the cerebellum.
The targetome identified for the NFI family within postnatal GNPs includes a number of specific factors that highlight their role in promoting differentiation. For example, Wnt5a, a factor known to regulate neural progenitor proliferation within the cerebellum [47], is upregulated in the absence of either Nfia or Nfix, consistent with the phenotype for delayed GNP differentiation in these strains. Conversely, factors known to promote neural differentiation, such as Neurod1, Neurod4 and Nfix, were reduced, as was the neuronal marker Rbfox3. In addition to these individual factors identified as likely targets of co-regulation by the NFI family, a novel theme to arise from this multi-faceted analysis was that NFIs may regulate cohorts of genes related to similar processes. For example, within the NFI targetome, we identified 6 collagen genes, 13 genes encoding potassium channel or glutamate receptor subunits and a range of factors related to axon guidance (e.g. Slit1, Robo1, Epha4, Epha5, Epha8). These findings may point to previously unrecognised roles for the NFI family. For example, NFIs are widely expressed in neurons [30], but their role in these cells is unknown. The identification of potassium channel and glutamate receptor subunit genes in our target list suggests that NFIs may contribute to the process of neurotransmission. Looking forward, more sophisticated approaches using multiple conditional Nfi alleles crossed to cell type-specific drivers (e.g. CamK2a CreERT2) may enable the role of the NFI family in specific functions such as neurotransmission to be investigated.
Our approach to determine shared NFI target genes also highlighted a number of other interesting elements of NFI biology whose significance has not been previously appreciated. For example, partitioning of reported ChIP-seq peaks for each of NFIA, NFIB and NFIX into defined regions (proximal, genic or distal) revealed that only 3–6% of binding peaks were in proximal regions (defined as ± 2000 bp from a transcriptional start site), whereas approximately 44% were found in genic regions (sites outside the promoter regions but overlapping gene boundaries), with the remaining ~ 50% of ChIP-seq peaks within distal regions. This implicates a large portion of NFI binding may be related to interactions with distal enhancers. The role of NFIs in distal binding is at this stage unclear, but a recent report of NFIB mediating chromatin accessibility in small cell lung cancer [48] may point to this family playing a much broader role in transcriptional architecture than regulating promoter activity. In the future, the role of NFIs in mediating enhancer activity could be investigated using techniques including luciferase assays, whereas chromatin interaction analysis by paired-end tag sequencing (ChIA-PET) could be used to interrogate the role of NFIs in mediating long-range chromatin interactions in vivo. Our findings also suggest that numerous NFI binding sites can be found in regions of closed chromatin. Exactly what this means is, at this stage, unclear, but the possibility of the NFIs acting to promote chromatin accessibility in a developmental context, in addition to that seen in small cell lung cancer [48], is a tantalising possibility. One way in which it could be analysed would be to combine ChIP-seq on GNPs at different developmental stages with DNase I hypersensitivity analyses at the same age. From this, the capacity of NFIs to bind to, and potentially open, regions of previously compressed chromatin could be ascertained.
Our analyses also raise a number of questions. For instance, our analysis revealed a high proportion of ChIP-seq peaks that were common between NFIA, NFIB and NFIX. One interpretation of this could be that the NFI proteins promiscuously form heterodimers to bind DNA. Although heterodimerisation of the NFIs has long been known to occur in vitro [49], its prevalence in vivo is less clear. NFIA and NFIB were recently reported to co-immunoprecipitate in lysates from embryonic day 13 mouse cerebral cortical tissue [22]; our data suggest that heterodimerisation between NFIA, NFIB and NFIX may be a common theme in the way this family regulates development, a theory supported by the similar neural phenotypes observed following knockout of individual Nfi genes [4, 8, 10]. Despite this, our analyses revealed that the role of Nfia and Nfix may not be entirely overlapping. Indeed, there were a number of genes identified as NFIA targets that were not identified as NFIX targets (Fig. 6a). Although care needs to be taken when interpreting the differences in our targetomes, as experimental conditions may underlie this (e.g. variations in antibody affinity for ChIP-seq), the fact that the Nfia cKO mutant cerebellum exhibited increased foliation (Fig. 4(I)), whereas the Nfix mutant does not [20], provides a morphological indication of some distinct functions between these transcription factors. Potential differences in the targets of NFIA and NFIX (and, potentially, NFIB) could relate to the capacity of different family members to bid to co-factors. The C-terminal region of each family member is less well conserved [43], indicative of potentially different affinity states for protein binding partners. There is surprisingly little known regarding other proteins that the NFIs interact with. One recent study performed in HEK298T cells used tandem affinity purification followed by mass spectrometry to reveal an interaction between NFIX and CREB1 [50]. In the future, the use of sophisticated approaches like this, in conjunction with specific cellular populations like GNPs, could be ways in which proteins that interact with NFIs could be identified. In conclusion, our study has enhanced our understanding of neural development specifically, and NFI biology more broadly, using molecular and transcriptomic assays to reveal that the NFI family shares a large number of targets during the differentiation of the postnatal cerebellum.
Supplementary Material
Acknowledgements
Imaging was carried out in The School of Biomedical Sciences Microscopy and Imaging Facility. We thank the facility manager, Dr. Shaun Walters, for his assistance.
Funding Information This work was supported by the Australian Research Council grants (DP160100368 and DP180100017 to MP) and NYSTEM grants (CO30133 and C30290GG to RMG). JF and AE were supported by the Research Training Program scholarships from the Australian Government. ASB was supported by Ruth L. Kirschstein (NRSA F32 GM105227).
Footnotes
Electronic supplementary material The online version of this article (https://doi.org/10.1007/s12311-019-01089-3) contains supplementary material, which is available to authorized users.
References
- 1.Harris L, Genovesi LA, Gronostajski RM, Wainwright BJ, Piper M. Nuclear factor one transcription factors: divergent functions in developmental versus adult stem cell populations. Dev Dyn. 2015;244:227–38. [DOI] [PMC free article] [PubMed] [Google Scholar]
- 2.Harris L, Zalucki O, Piper M, Heng JI. Insights into the biology and therapeutic applications of neural stem cells. Stem Cells Int. 2016;2016:9745315. [DOI] [PMC free article] [PubMed] [Google Scholar]
- 3.Wang W, Mullikin-Kilpatrick D, Crandall JE, Gronostajski RM, Litwack ED, Kilpatrick DL. Nuclear factor I coordinates multiple phases of cerebellar granule cell development via regulation of cell adhesion molecules. J Neurosci. 2007;27:6115–27. [DOI] [PMC free article] [PubMed] [Google Scholar]
- 4.Barry G, Piper M, Lindwall C, Moldrich R, Mason S, Little E, et al. Specific glial populations regulate hippocampal morphogenesis. J Neurosci. 2008;28:12328–40. [DOI] [PMC free article] [PubMed] [Google Scholar]
- 5.Betancourt J, Katzman S, Chen B. Nuclear factor one B regulates neural stem cell differentiation and axonal projection of corticofugal neurons. J Comp Neurol. 2014;522:6–35. [DOI] [PMC free article] [PubMed] [Google Scholar]
- 6.Deneen B, Ho R, Lukaszewicz A, Hochstim CJ, Gronostajski RM, Anderson DJ. The transcription factor NFIA controls the onset of gliogenesis in the developing spinal cord. Neuron. 2006;52:953–68. [DOI] [PubMed] [Google Scholar]
- 7.Harris L, Zalucki O, Gobius I, McDonald H, Osinki J, Harvey TJ, et al. Transcriptional regulation of intermediate progenitor cell generation during hippocampal development. Development. 2016;143: 4620–30. [DOI] [PMC free article] [PubMed] [Google Scholar]
- 8.Heng YH, McLeay RC, Harvey TJ, Smith AG, Barry G, Cato K, et al. NFIX regulates neural progenitor cell differentiation during hippocampal morphogenesis. Cereb Cortex. 2014;24:261–79. [DOI] [PMC free article] [PubMed] [Google Scholar]
- 9.Piper M, Barry G, Harvey TJ, McLeay R, Smith AG, Harris L, et al. NFIB-mediated repression of the epigenetic factor Ezh2 regulates cortical development. J Neurosci. 2014;34:2921–30. [DOI] [PMC free article] [PubMed] [Google Scholar]
- 10.Piper M, Barry G, Hawkins J, Mason S, Lindwall C, Little E, et al. NFIA controls telencephalic progenitor cell differentiation through repression of the Notch effector Hes1. J Neurosci. 2010;30:9127–39. [DOI] [PMC free article] [PubMed] [Google Scholar]
- 11.Piper M, Harris L, Barry G, Heng YH, Plachez C, Gronostajski RM, et al. Nuclear factor one X regulates the development of multiple cellular populations in the postnatal cerebellum. J Comp Neurol. 2011;519:3532–48. [DOI] [PMC free article] [PubMed] [Google Scholar]
- 12.Piper M, Moldrich RX, Lindwall C, Little E, Barry G, Mason S, et al. Multiple non-cell-autonomous defects underlie neocortical callosal dysgenesis in Nfib-deficient mice. Neural Dev. 2009;4:43. [DOI] [PMC free article] [PubMed] [Google Scholar]
- 13.Campbell CE, Piper M, Plachez C, Yeh YT, Baizer JS, Osinski JM, et al. The transcription factor Nfix is essential for normal brain development. BMC Dev Biol. 2008;8:52. [DOI] [PMC free article] [PubMed] [Google Scholar]
- 14.Fraser J, Essebier A, Gronostajski RM, Boden M, Wainwright BJ, Harvey TJ, et al. Cell-type-specific expression of NFIX in the developing and adult cerebellum. Brain Struct Funct. 2017;222:2251–70. [DOI] [PubMed] [Google Scholar]
- 15.Matuzelski E, Bunt J, Harkins D, Lim JWC, Gronostajski RM, Richards LJ, et al. Transcriptional regulation of Nfix by NFIB drives astrocytic maturation within the developing spinal cord. Dev Biol. 2017;432:286–97. [DOI] [PubMed] [Google Scholar]
- 16.Plachez C, Lindwall C, Sunn N, Piper M, Moldrich RX, Campbell CE, et al. Nuclear factor I gene expression in the developing forebrain. J Comp Neurol. 2008;508:385–401. [DOI] [PubMed] [Google Scholar]
- 17.Shu T, Butz KG, Plachez C, Gronostajski RM, Richards LJ. Abnormal development of forebrain midline glia and commissural projections in Nfia knock-out mice. J Neurosci. 2003;23:203–12. [DOI] [PMC free article] [PubMed] [Google Scholar]
- 18.Steele-Perkins G, Plachez C, Butz KG, Yang G, Bachurski CJ, Kinsman SL, et al. The transcription factor gene Nfib is essential for both lung maturation and brain development. Mol Cell Biol. 2005;25:685–98. [DOI] [PMC free article] [PubMed] [Google Scholar]
- 19.Cerminara NL, Lang EJ, Sillitoe RV, Apps R. Redefining the cerebellar cortex as an assembly of non-uniform Purkinje cell microcircuits. Nat Rev Neurosci. 2015;16:79–93. [DOI] [PMC free article] [PubMed] [Google Scholar]
- 20.Fraser J, Essebier A, Brown AS, Davila RA, Sengar AS, Tu Y, et al. Granule neuron precursor cell proliferation is regulated by NFIX and intersectin 1 during postnatal cerebellar development. Brain Struct Funct. 2019;224:811–27. [DOI] [PubMed] [Google Scholar]
- 21.Acampora D, Gulisano M, Broccoli V, Simeone A. Otx genes in brain morphogenesis. Prog Neurobiol. 2001;64:69–95. [DOI] [PubMed] [Google Scholar]
- 22.Bunt J, Osinki J, Lim J, Vidovic D, Ye Y, Zalucki O, et al. Combined allelic loss of Nfia and Nfib causes an increased severity of cortical developmental defects. Brain Neurosci Adv. 2017;1:1–21. [DOI] [PMC free article] [PubMed] [Google Scholar]
- 23.Machold R, Fishell G. Math1 is expressed in temporally discrete pools of cerebellar rhombic-lip neural progenitors. Neuron. 2005;48:17–24. [DOI] [PubMed] [Google Scholar]
- 24.Chizhikov V, Millen KJ. Development and malformations of the cerebellum in mice. Mol Genet Metab. 2003;80:54–65. [DOI] [PubMed] [Google Scholar]
- 25.Machold R, Klein C, Fishell G. Genes expressed in Atoh1 neuronal lineages arising from the r1/isthmus rhombic lip. Gene Expr Patterns. 2011;11:349–59. [DOI] [PMC free article] [PubMed] [Google Scholar]
- 26.Leto K, Arancillo M, Becker EB, Buffo A, Chiang C, Ding B, et al. Consensus paper: cerebellar development. Cerebellum. 2016;15: 789–828. [DOI] [PMC free article] [PubMed] [Google Scholar]
- 27.Schuller U, Zhao Q, Godinho SA, Heine VM, Medema RH, Pellman D, et al. Forkhead transcription factor FoxM1 regulates mitotic entry and prevents spindle defects in cerebellar granule neuron precursors. Mol Cell Biol. 2007;27:8259–70. [DOI] [PMC free article] [PubMed] [Google Scholar]
- 28.Lee HY, Greene LA, Mason CA, Manzini MC. Isolation and culture of post-natal mouse cerebellar granule neuron progenitor cells and neurons. J Vis Exp. 2009;16:990. [DOI] [PMC free article] [PubMed] [Google Scholar]
- 29.Trapnell C, Roberts A, Goff L, Pertea G, Kim D, Kelley DR, et al. Differential gene and transcript expression analysis of RNA-seq experiments with TopHat and Cufflinks. Nat Protoc. 2012;7:562–78. [DOI] [PMC free article] [PubMed] [Google Scholar]
- 30.Chen KS, Harris L, Lim JWC, Harvey TJ, Piper M, Gronostajski RM, et al. Differential neuronal and glial expression of nuclear factor I proteins in the cerebral cortex of adult mice. J Comp Neurol. 2017;525:2465–83. [DOI] [PubMed] [Google Scholar]
- 31.Langmead B, Salzberg SL. Fast gapped-read alignment with Bowtie 2. Nat Methods. 2012;9:357–9. [DOI] [PMC free article] [PubMed] [Google Scholar]
- 32.Feng J, Liu T, Qin B, Zhang Y, Liu XS. Identifying ChIP-seq enrichment using MACS. Nat Protoc. 2012;7:1728–40. [DOI] [PMC free article] [PubMed] [Google Scholar]
- 33.O’Connor T, Boden M, Bailey TL. CisMapper: predicting regulatory interactions from transcription factor ChIP-seq data. Nucleic Acids Res. 2017;45:e19. [DOI] [PMC free article] [PubMed] [Google Scholar]
- 34.da Huang W, Sherman BT, Lempicki RA. Bioinformatics enrichment tools: paths toward the comprehensive functional analysis of large gene lists. Nucleic Acids Res. 2009;37:1–13. [DOI] [PMC free article] [PubMed] [Google Scholar]
- 35.da Huang W, Sherman BT, Lempicki RA. Systematic and integrative analysis of large gene lists using DAVID bioinformatics resources. Nat Protoc. 2009;4:44–57. [DOI] [PubMed] [Google Scholar]
- 36.Frank CL, Liu F, Wijayatunge R, Song L, Biegler MT, Yang MG, et al. Regulation of chromatin accessibility and Zic binding at enhancers in the developing cerebellum. Nat Neurosci. 2015;18:647–56. [DOI] [PMC free article] [PubMed] [Google Scholar]
- 37.Guertin MJ, Lis JT. Mechanisms by which transcription factors gain access to target sequence elements in chromatin. Curr Opin Genet Dev. 2013;23:116–23. [DOI] [PMC free article] [PubMed] [Google Scholar]
- 38.Hughes TR. Introduction to “a handbook of transcription factors”. Subcell Biochem. 2011;52:1–6. [DOI] [PubMed] [Google Scholar]
- 39.Wang W, Shin Y, Shi M, Kilpatrick DL. Temporal control of a dendritogenesis-linked gene via REST-dependent regulation of nuclear factor I occupancy. Mol Biol Cell. 2011;22:868–79. [DOI] [PMC free article] [PubMed] [Google Scholar]
- 40.Wang W, Stock RE, Gronostajski RM, Wong YW, Schachner M, Kilpatrick DL. A role for nuclear factor I in the intrinsic control of cerebellar granule neuron gene expression. J Biol Chem. 2004;279: 53491–7. [DOI] [PubMed] [Google Scholar]
- 41.Plachez C, Cato K, McLeay RC, Heng YH, Bailey TL, Gronostasjki RM, et al. Expression of nuclear factor one A and - B in the olfactory bulb. J Comp Neurol. 2012;520:3135–49. [DOI] [PubMed] [Google Scholar]
- 42.Wang W, Crandall JE, Litwack ED, Gronostajski RM, Kilpatrick DL. Targets of the nuclear factor I regulon involved in early and late development of postmitotic cerebellar granule neurons. J Neurosci Res. 2010;88:258–65. [DOI] [PubMed] [Google Scholar]
- 43.Gronostajski RM. Roles of the NFI/CTF gene family in transcription and development. Gene. 2000;249:31–45. [DOI] [PubMed] [Google Scholar]
- 44.Piper M, Gronostajski R, Messina G. Nuclear factor one X in development and disease. Trends Cell Biol. 2019;29:20–30. [DOI] [PubMed] [Google Scholar]
- 45.Messina G, Biressi S, Monteverde S, Magli A, Cassano M, Perani L, et al. Nfix regulates fetal-specific transcription in developing skeletal muscle. Cell. 2010;140:554–66. [DOI] [PubMed] [Google Scholar]
- 46.Pistocchi A, Gaudenzi G, Foglia E, Monteverde S, Moreno-Fortuny A, Pianca A, et al. Conserved and divergent functions of Nfix in skeletal muscle development during vertebrate evolution. Development. 2013;140:1528–36. [DOI] [PubMed] [Google Scholar]
- 47.Subashini C, Dhanesh SB, Chen CM, Riya PA, Meera V, Divya TS, et al. Wnt5a is a crucial regulator of neurogenesis during cerebellum development. Sci Rep. 2017;7:42523. [DOI] [PMC free article] [PubMed] [Google Scholar]
- 48.Denny SK, Yang D, Chuang CH, Brady JJ, Lim JS, Gruner BM, et al. Nfib promotes metastasis through a widespread increase in chromatin accessibility. Cell. 2016;166:328–42. [DOI] [PMC free article] [PubMed] [Google Scholar]
- 49.Kruse U, Sippel AE. Transcription factor nuclear factor I proteins form stable homo- and heterodimers. FEBS Lett. 1994;348:46–50. [DOI] [PubMed] [Google Scholar]
- 50.Li X, Wang W, Wang J, Malovannaya A, Xi Y, Li W, et al. Proteomic analyses reveal distinct chromatin-associated and soluble transcription factor complexes. Mol Syst Biol. 2015;11:775. [DOI] [PMC free article] [PubMed] [Google Scholar]
Associated Data
This section collects any data citations, data availability statements, or supplementary materials included in this article.