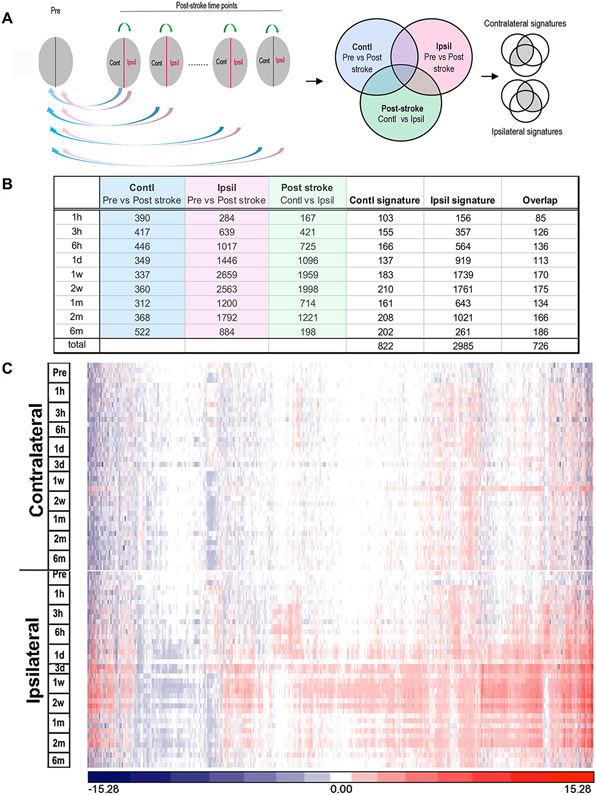
Figure 1.
Identification of perturbed gene expression in the post-ischemic brain across post-stroke stages. A, Algorithm based on 3 separate categories of comparisons. Blue and red arrows indicate comparisons of post-ischemic vs. pre-ischemic brain in the respective contralateral and ipsilateral hemispheres. Green arrows indicate comparisons between hemispheres in post-ischemic brain. Color coded areas in the Venn diagrams indicate the genes perturbed in each of the 3 categories of pairwise comparisons. The gray area contains overlapping genes that are selectively perturbed in the contralateral or ipsilateral hemipsheres. B, Number of perturbed gene expression signatures after all 3 pairwise comparisons and signatures at the post-stroke time points. C, Heat map of the 3081 genes (union of all signature genes) that were significantly perturbed across the post-ischemic time points.

