. 2021 Jan 18;10:e62206. doi: 10.7554/eLife.62206

Figure 6. Independent 2010.

WHRadjBMI SNPs salvaged via variant-to-gene mapping that go on to reach genome-wide significance by 2018, as well as the set of unconstrained 2010 suggestive SNPs that achieve genome-wide significance by 2018. Positive predictive value is depicted for each bar. Above these percentages, the p-value, as identified through Fisher’s exact test, is posted. These p-values depict the probability that the proportions of salvaged SNPs using variant-to-gene mapping differ from simply salvaging all suggestive SNPs within the same suggestive bin.

Figure 6—source data 1. Number of 2010 loci identified by constrained method and the number that achieved GWS by 2018 in each cell type.
Figure 6—source data 2. Number of 2010 loci identified with no constraint and the number that achieved GWS by 2018.

Figure 6.

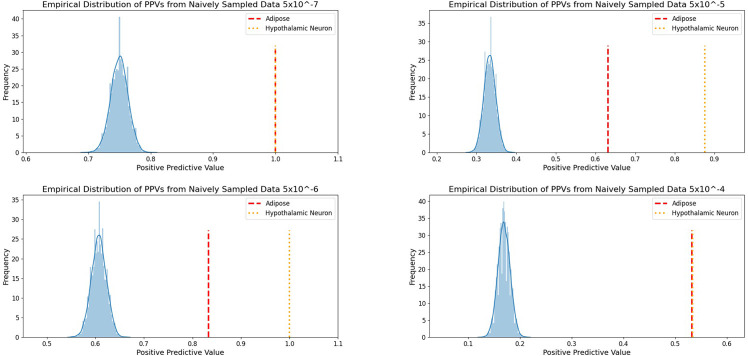
Figure 6—figure supplement 1. Empirical distribution of positive predictive values of suggestive 2010 WHRadjBMI SNPs achieving GWS by 2018.

Figure 6—figure supplement 1.

Figure 6—figure supplement 2. Independent 2010.

Figure 6—figure supplement 2.

WHRadjBMI SNPs salvaged via variant-to-gene mapping that go on to reach genome-wide significance by 2015, as well as the set of unconstrained 2010 suggestive SNPs that achieve genome-wide significance by 2015. Positive predictive value is depicted for each bar. The posterior probability that loci identified by our chromatin-based constraint more often achieve GWS than loci with no constraint is posted above these percentages.
Figure 6—figure supplement 2—source data 1. Number of 2010 loci identified by constrained method and the number that achieved GWS by 2015 in each cell type.
Figure 6—figure supplement 2—source data 2. Number of 2010 loci identified with no constraint and the number that achieved GWS by 2015.
Figure 6—figure supplement 3. Independent 2015.

Figure 6—figure supplement 3.

WHRadjBMI SNPs salvaged via variant-to-gene mapping that go on to reach genome-wide significance by 2018, as well as the set of unconstrained 2015 suggestive SNPs that achieve genome-wide significance by 2018. Positive predictive value is depicted for each bar. The posterior probability that loci identified by our chromatin-based constraint more often achieve GWS than loci with no constraint is posted above these percentages.
Figure 6—figure supplement 3—source data 1. Number of 2015 loci identified by constrained method and the number that achieved GWS by 2018 in each cell type.
Figure 6—figure supplement 3—source data 2. Number of 2015 loci identified with no constraint and the number that achieved GWS by 2018.