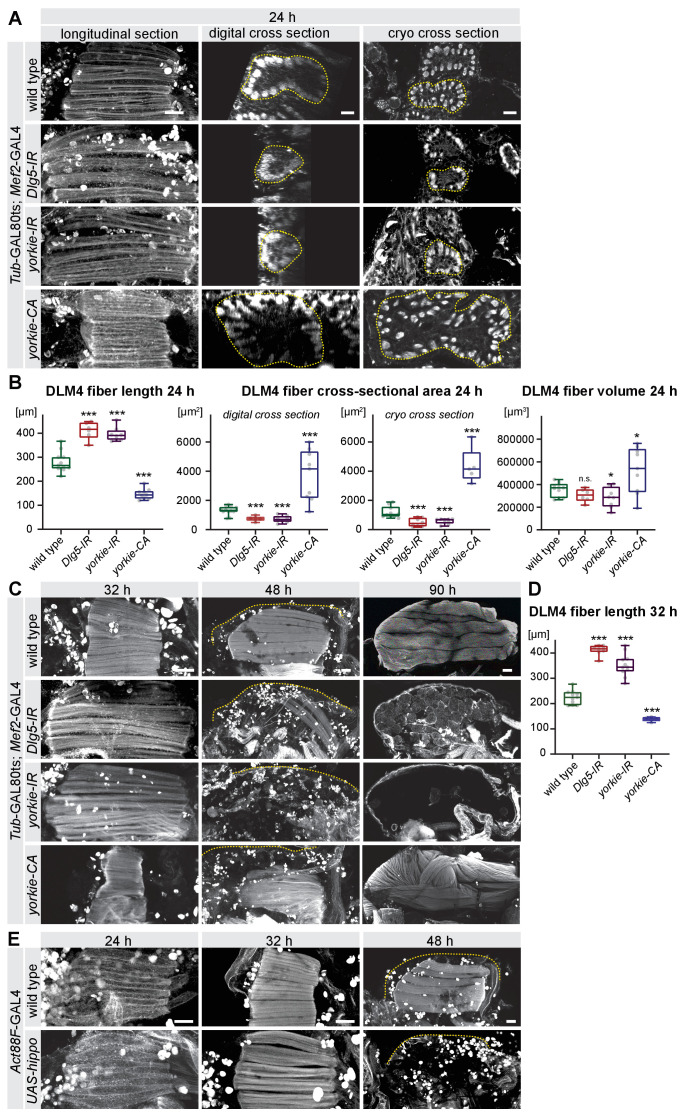
Figure 5. The Hippo pathway is important for post-mitotic muscle development.
(A–D) Developing flight muscles at 24 hr, 32 hr, 48 hr, and 90 hr after puparium formation (APF) from wild type, Dlg5-IR, yorkie-IR, and yorkie-CA TubGAL80ts Mef2-GAL4 pupae, in which GAL4 activity was restricted to pupal stages (shift to 31°C at 0 hr APF). (A) Longitudinal sections of all flight muscles, as well as digital and cryo cross-sections of dorsal-longitudinal flight muscle 4 (DLM4) at 24 hr APF. Dotted lines highlight the fiber area. (B) Box plot displaying DLM4 muscle fiber length, fiber cross-sectional area from digital and cryo cross-sections as well as the calculated DLM4 fiber volume at 24 hr APF (calculated by multiplying length with digital cross-sectional area for each pupa). Student’s t-test, *** p-value<0.001, * p-value<0.05. (C) Flight muscles at 32 hr, 48 hr, and 90 hr APF. Note the too long muscles in Dlg5-IR, yorkie-IR at 32 hr APF followed by muscle atrophy and the too short yorkie-CA fibers at 32 hr that develop disorganised fibers at 90 hr APF. (D) Box plot illustrating the average muscle fiber length at 32 hr APF. Student’s t-test, *** p-value<0.001. (E) Control and Act88F-GAL4 UAS-hippo flight muscles at 24 hr, 32 hr and 48 hr APF. Note the induced fiber compaction defect followed by the muscle atrophy. All scale bars represent 50 µm for longitudinal sections and 10 µm for cross-sections.


