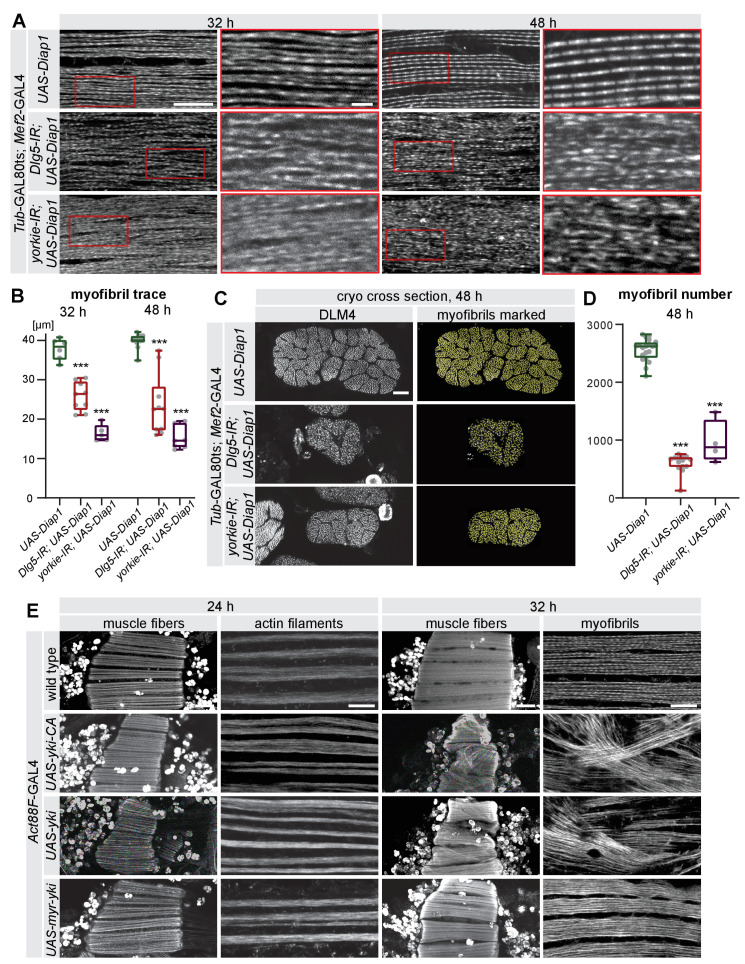
Figure 7. The Hippo pathway is essential for myofibrillogenesis.
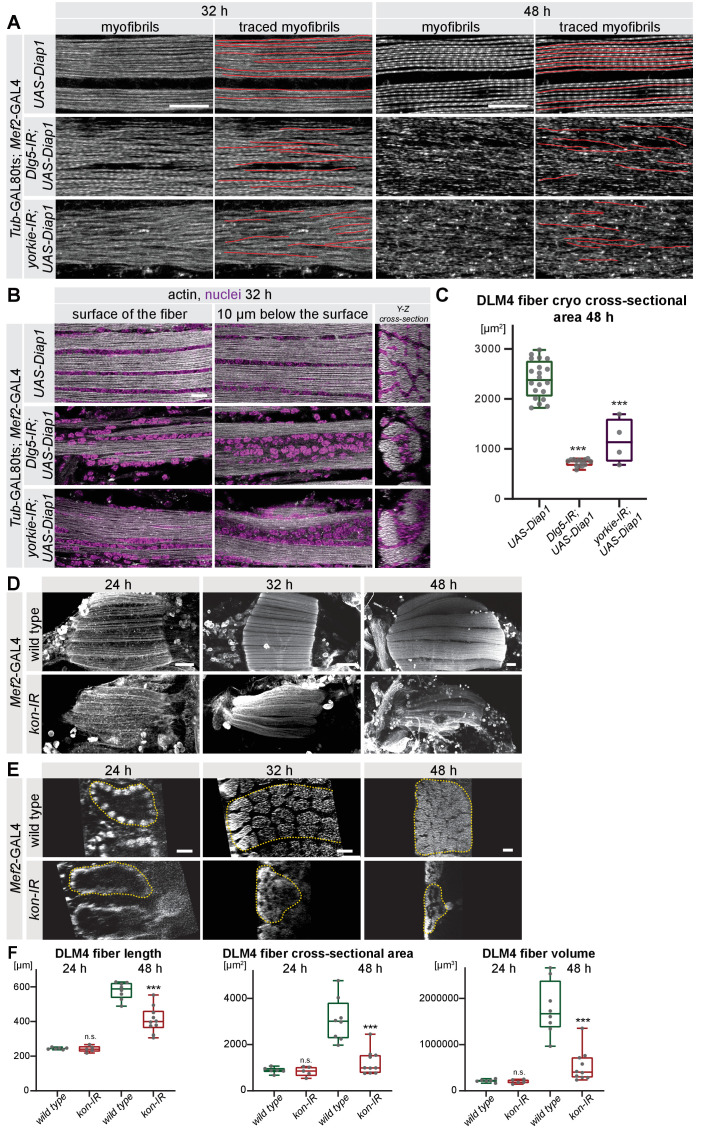
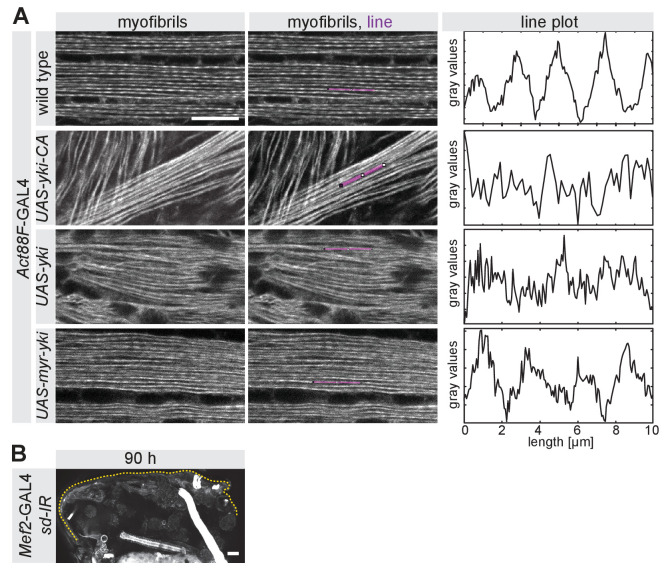
(A) Myofibrils visualised by phalloidin from control, Dlg5-IR, and yorkie-IR UAS-Diap1 TubGAL80ts Mef2-GAL4 muscles at 32 hr and 48 hr after puparium formation (APF; shifted to 31°C at 0 hr APF). The red-boxed areas are magnified. Note the less regular myofibril pattern of Dlg5-IR and yorkie-IR muscles at 32 hr APF that makes it hard to trace an individual myofibril (see Figure 7—figure supplement 1A). Even at 48 hr APF, myofibrils from Dlg5-IR and yorkie-IR are hard to trace continuously. Scale bars represent 10 µm in the overviews and 2 µm in the zoomed red boxes. (B) Box plot of traced myofibril length in a 40 × 20 × 2.5 µm volume (see Figure 7—figure supplement 1A). Student’s t test, *** p-value<0.001. (C) Cryo cross-sections of dorsal-longitudinal flight muscle 4 (DLM4) from control, Dlg5-IR and yorkie-IR UAS-Diap1 TubGAL80ts Mef2-GAL4 muscles at 48 hr APF (shifted to 31°C at 0 hr APF). Yellow dots represent the myofibrils recognised by the MyofibrilJ plug-in to automatically count the number of myofibrils per DLM4 fiber (Spletter et al., 2018). Scale bar represents 10 µm. (D) Box plot of myofibril number in DLM4 of indicated genotypes at 48 hr APF. Student’s t test, *** p-value<0.001. (E) Flight muscle and myofibril morphologies of muscles expressing yorkie-CA, yorkie, or myr-yorkie under the control of post-mitotic Act88F-GAL4 at 24 hr and 32 hr APF. Scale bars represent 50 µm in muscle fiber images and 10 µm in myofibril images.


