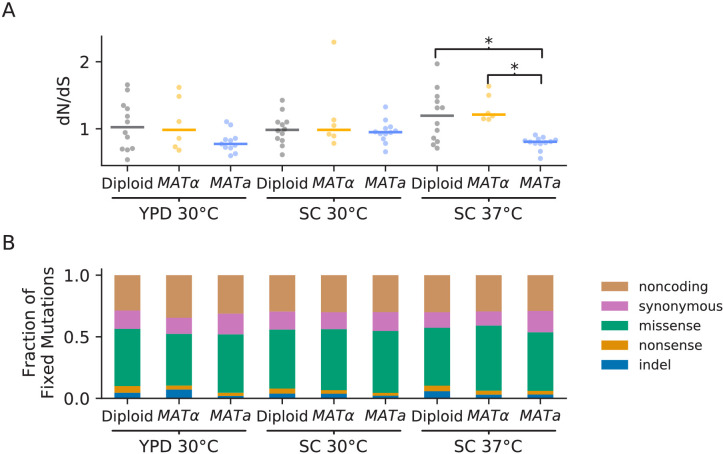
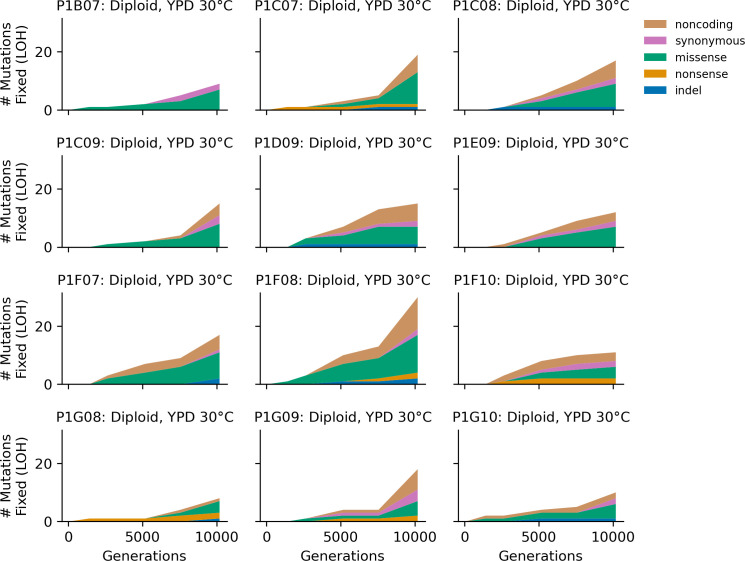
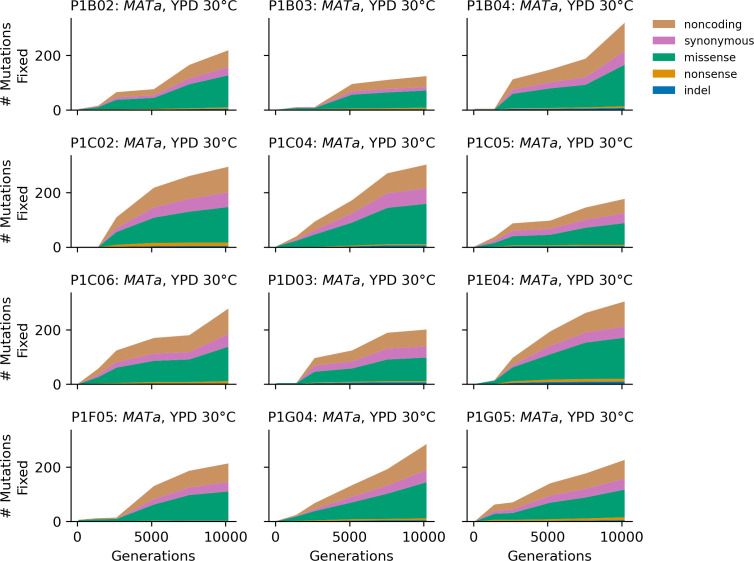
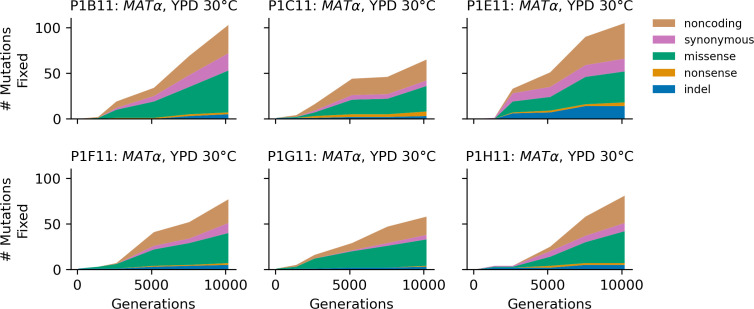
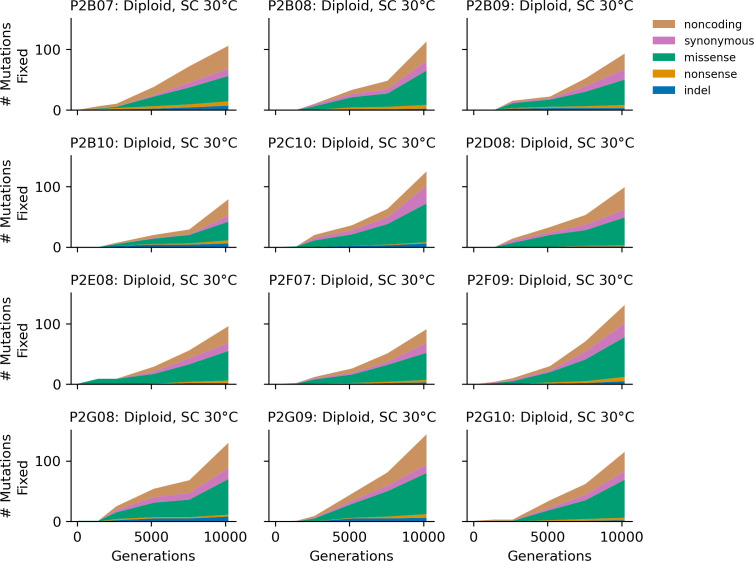
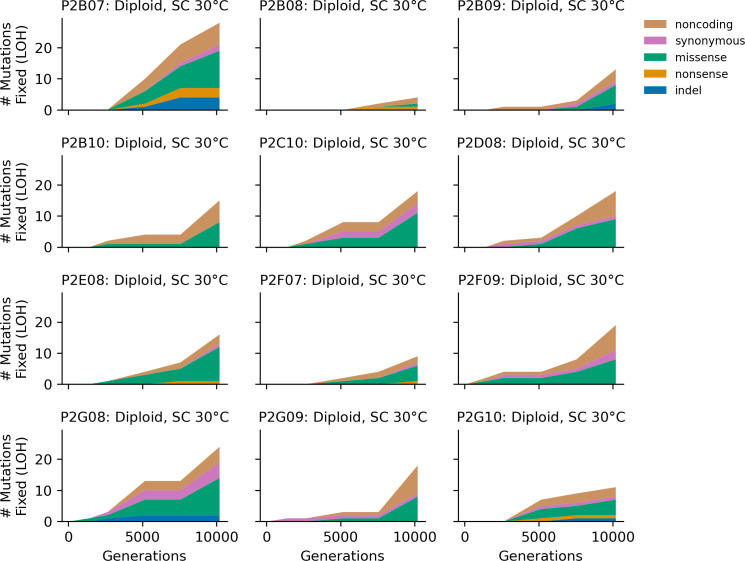
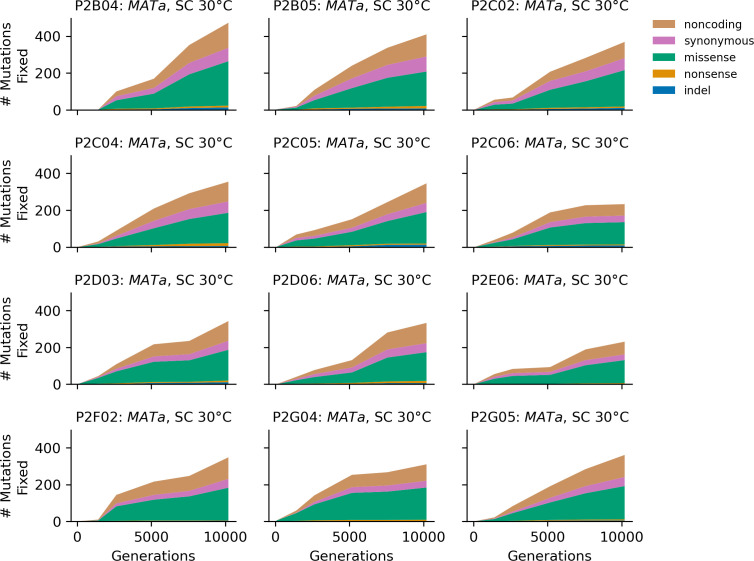
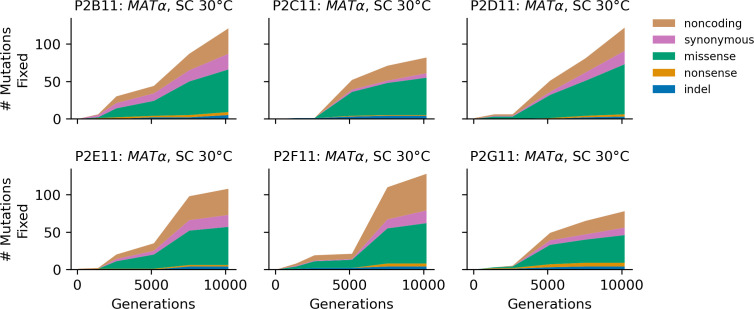
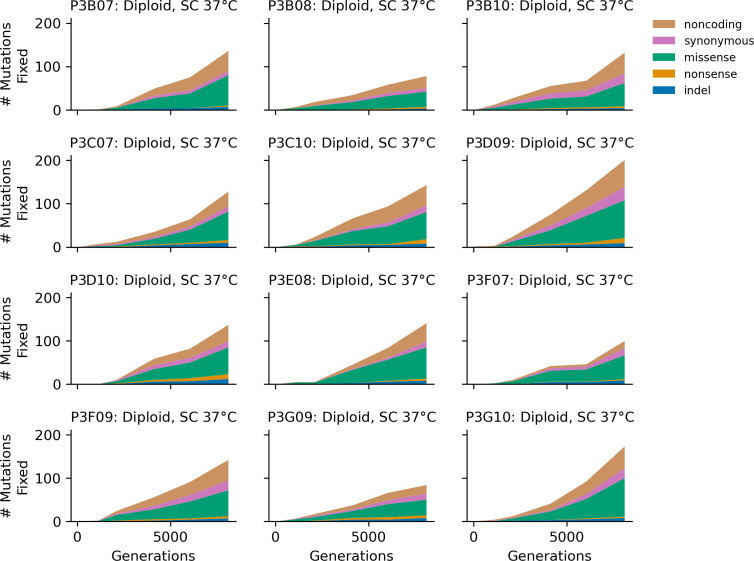
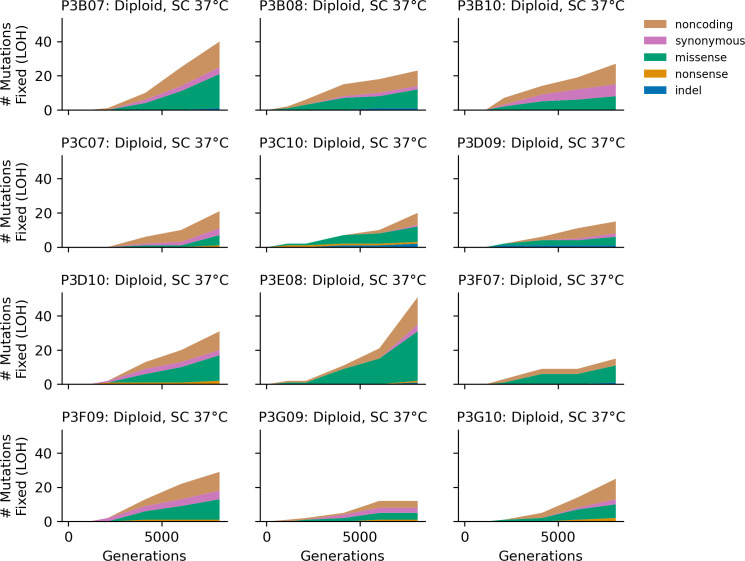
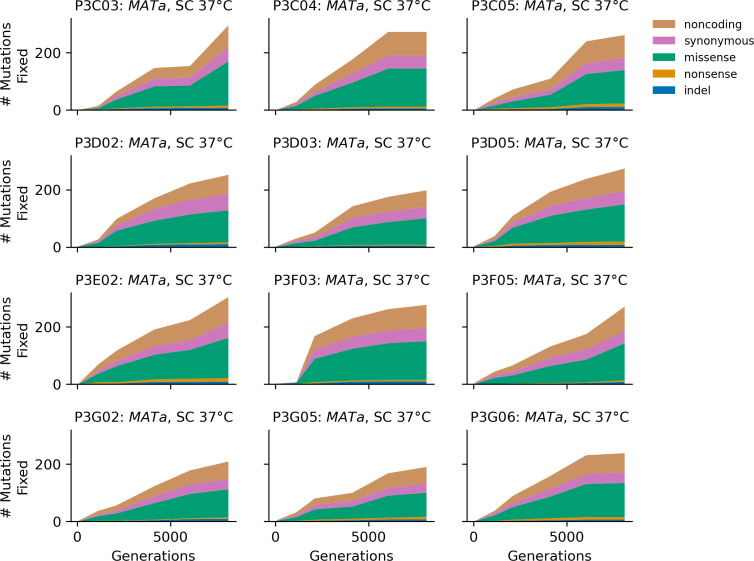
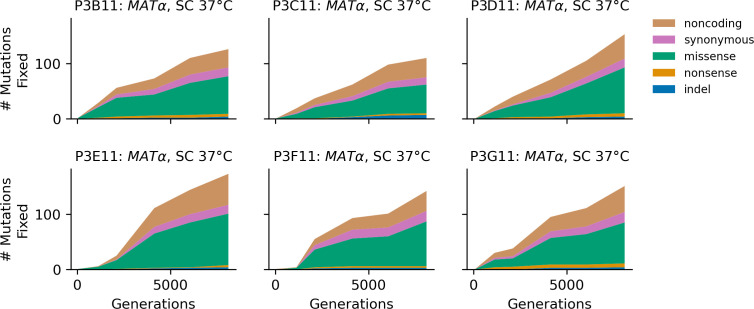
Figure 4. Types of mutations.
(A) Swarm plot of dN/dS (ratio of nonsynonymous / synonymous fixations by the final timepoint, scaled by the ratio of possible nonsynonymous / synonymous mutations across the genome) for each environment-strain combination. Each point represents one population and the horizontal line represents the median. Asterisks indicate significant differences (p<0.01, Mann-Whitney U test) between strains in the same environment. (B) Breakdown of mutation types for all mutations fixed by the final timepoint, in all populations corresponding to each environment-strain combination.

