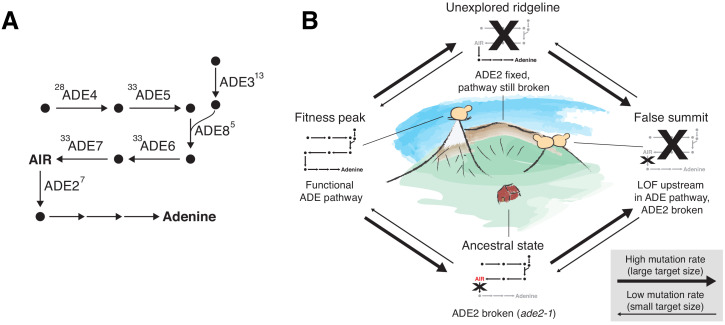
Figure 7. ADE pathway evolution.
(A) Simplified schematic of the adenine biosynthesis pathway. Circles represent metabolic intermediates; AIR is the toxic metabolic intermediate phosphoribosylaminoimidazole. Annotations represent the number of fixed nonsynonymous mutations in each gene (note that ADE5 and ADE7 are both products of the same gene). (B) Schematic of a fitness landscape with four possible states defined by whether ADE2 is functional and whether the ADE pathway upstream of ADE2 is functional. The small insets represent the state of the pathway in (A) at each position. Elevation in the landscape represents putative fitness differences, and the width of the arrows represents the putative mutation rates between the different states.
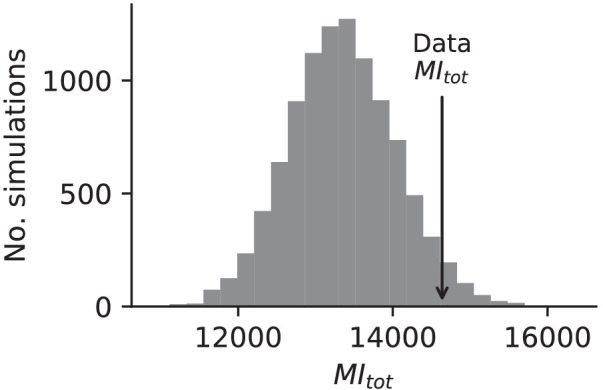
Figure 7—figure supplement 1. Overdispersion.
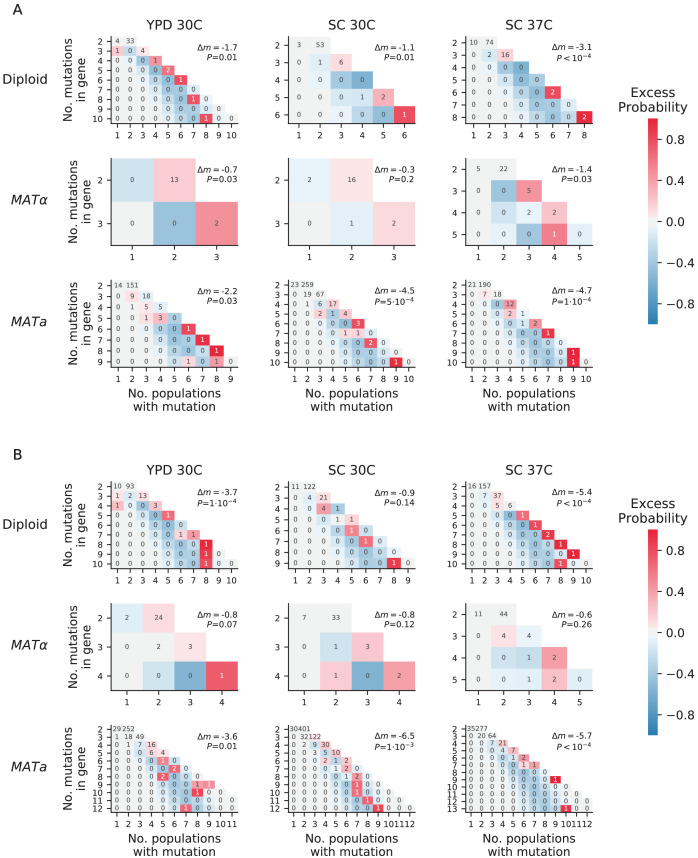
Figure 7—figure supplement 2. Mutual information analysis.


