Abstract
Enantioselective indicator displacement assays (eIDAs) for α-amino acids were conducted in a 96-well plate format to demonstrate the viability of the technique for the high-throughput screening (HTS) of enantiomeric excess (ee) values. Chiral receptors [CuII(1)]2+ and [CuII(2)]2+ with the indicator chrome azurol S were implemented for the eIDAs. Enantiomeric excess calibration curves were made using both receptors and then used to analyze true test samples. These results were compared to those previously obtained with a conventional UV-vis spectrophotometer, and they showed little to no loss of accuracy, while the speed of analysis was increased. A sample of valine of unknown ee was synthesized through an asymmetric reaction to produce a realistic reaction sample, which was analyzed using receptor [CuII(1)]2+. The experimentally determined ee using our eIDA was compared to that obtained by chiral HPLC and 1H NMR chiral shift reagent analysis. This gave errors of 4.7% and 12.0%, respectively. In addition to the use of ee calibration curves, an artificial neural network (ANN) was used to determine the % l-amino acid of the test samples and of the sample of valine of unknown ee from the asymmetric reaction. This method obtained errors of 5.9% and 2.2% compared to chiral HPLC and 1H NMR chiral shift reagent analysis, respectively. The technique using calibration curves for the determination of ee on a 96-well plate allows one to determine 96 ee values in under a minute, enabling its use for HTS of asymmetric reactions with acceptable accuracy.
Introduction
While asymmetric catalysis is well-recognized as a cost-effective method for the production of enantiomerically pure products, one current limitation in catalyst discovery is the determination of the enantiomeric excess (ee) of reaction products in a high-throughput (HT) fashion.1–5 Reactions that yield enantiomerically pure products save money in the pharmaceutical industry because purification to obtain the desired/effective enantiomer is avoided and less waste is generated through discarding of its enantiomer. Asymmetric catalysis can overcome these disadvantages through direct production of enantiomerically pure products. Traditional methods to discover asymmetric catalysts are based on rational design, knowledge of the reaction mechanism, molecular modeling, and optimization through trial-and-error to produce the desired activity.1
In the 1990s, combinatorial libraries came into use to screen for efficient catalysts.6–9 Combinatorial libraries generally use parallel synthesis and subsequent analysis of a large number of chiral catalysts. A severe limitation in this method is the large number of samples that require screening to determine the best catalyst.1,10 The use of combinatorial libraries to obtain effective asymmetric catalysts has not yet been fully utilized due to the lack of truly high-throughput screening (HTS) methods for the determination of ee.10 The commonly used methods to determine ee in a HT fashion are chiral high-performance liquid chromatography (HPLC) and gas chromatography (GC), or HPLC coupled with circular dichroism (CD).1,11,12 The instruments used are expensive and only handle a limited number of samples per day.3 A fairly rapid chiral HPLC run could take 10 min, though it is often longer, which theoretically translates into analysis of roughly 144 samples with a HPLC running 24 h a day.3,10 Also, this does not account for requilibration of the column between analysis, blank runs, and refilling solvents. True HTS should accommodate thousands of samples a day. A number of other methods developed for the determination of ee have been reviewed recently.1,2,12 Some of these methods have been transitioned to the microwell plate format, allowing for rapid screening of ee; however, most need derivatization of the analytes, which is not compatible with a HTS method.
To overcome these disadvantages, the use of a colorimetric method, such as enantioselective indicator displacement assays (eIDAs), has been implemented for determining ee. Indicator displacement assays (IDAs)13,14 have been widely explored by the chemical community and have also been used as a method to determine ee.14–20 The use of eIDAs has many advantages over other methods.21 Because it is based on a colorimetric measurement of displaced indicators, it uses a conventional UV-vis spectrophotometer. A spectrophotometer is a relatively standard instrument in most laboratories, it requires less training, and it can read samples in a shorter period of time compared to a chiral HPLC, allowing for screening of asymmetric catalysts in a HT fashion. Another advantage of using a spectrophotometer is the ability to transition the assay to a microwell plate reader, allowing for HTS. In a 96-well plate reader, a single wavelength absorption reading can be obtained in 1 min for the entire plate. A higher-density plate could also be used, possibly allowing for a further increase in the number of samples screened in a given amount of time.
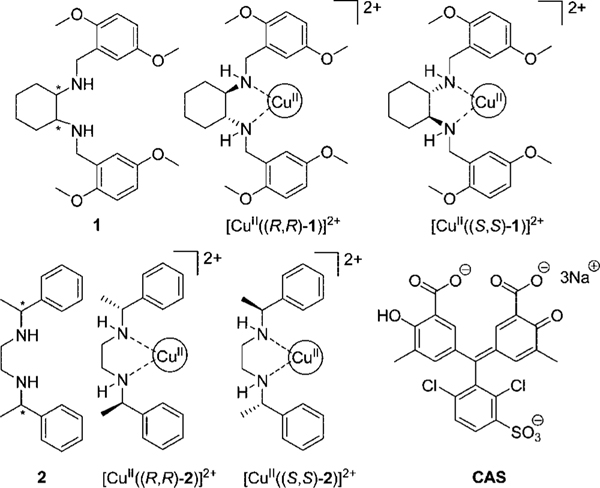
In our previous paper, we have shown that the use of eIDAs with two receptors ([CuII(1)]2+ and [CuII(2)]2+) and an indicator, chrome azurol S (CAS, see Figure 1), can enantioselectively discriminate 13 of the 17 analyzed α-amino acids.22 Enantiomeric excess of true test samples could be determined on a UV-vis spectrophotometer in aqueous media at pH 7.5, with an acceptable accuracy for preliminary determination of ee. In this study, we demonstrate eIDA’s ability as a HTS method by conducting these studies on a microwell plate, enabling a more rapid and simpler method of analysis. To transition from a conventional spectrophotometer to a 96-well plate, ee calibration curves were regenerated, and analyses of independent test samples were conducted. The transition to the microwell plate format from the conventional UV-vis spectrophotometer showed no significant loss of accuracy upon analysis of test samples, opening a path to HTS.
Figure 1.
Structures of ligand 1, chiral receptors [CuII((R,R)-1)]2+ and [CuII((S,S)-1)]2+, ligand 2, chiral receptors [CuII((R,R)-2)]2+ and [CuII((S,S)-2)]2+, and indicator chrome azurol S (CAS).
Also, to demonstrate eIDAs’ practicability, a sample from an asymmetric reaction was analyzed with the developed system. A sample of valine was synthesized through an asymmetric reaction, and its ee was determined using the chiral receptor [CuII((R,R)-1)]2+ (Figure 1). This value was compared to those obtained by chiral HPLC and 1H NMR chiral shift reagent analysis,23 showing that an eIDA system can compare favorably to the standard methods and yet function in a HT fashion.
Furthermore, an advanced chemometric tool, an artificial neural network (ANN), was explored for the determination of % l-amino acid. An ANN is a data analysis model capable of modeling complex relationships between the input and output data. The network’s adaptive system adjusts its structure on the basis of established learning sets (e.g., calibration data) and can then be used to apply the learned knowledge to new situations (unknown samples).24 The use of an ANN to determine % l-amino acid of test samples and the asymmetrically synthesized sample of valine allows for an alternative method for determination of ee.
Results and Discussion
1. Design Criteria.
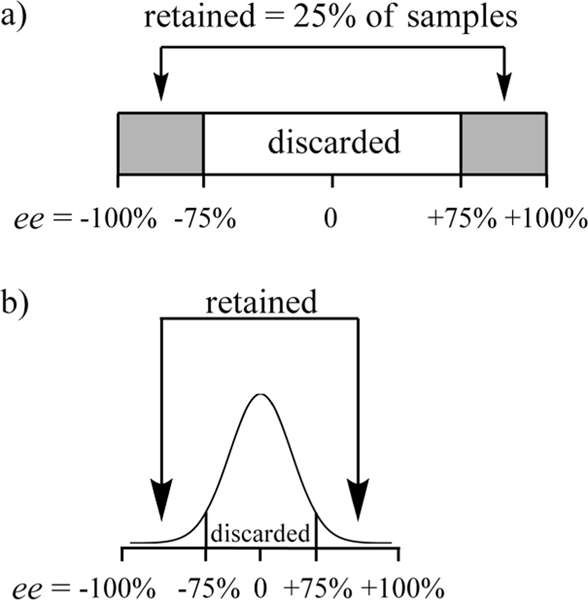
After informal consultation with various individuals in pharmaceutical firms, we have come to realize that any catalytic system yielding a true ee of 90% or higher in the screening process should be considered as a promising lead and selected for analysis with a more accurate technique, such as chiral HPLC. With that in mind, we have set for ourselves an upper limit of around 15% absolute error as an accuracy guideline. We feel that a significantly higher error would render our method less useful for HTS. Taking this 15% arbitrary limit into consideration, any sample with an ee below 75% of the desired enantiomer could be discarded outright, because the ee values above 75% could possibly fall near true ee values of 90%. Given that we define ee to span −100% to 100%, this means that if the ee values of unknowns were evenly distributed, our method would allow one to discard 75% of the samples (Figure 2a) and submit only the best leads to time-consuming HPLC analysis. The high negative values should also be analyzed because the enantiomeric catalyst could be used. Further, in a case where the ee values obtained from random catalysts screening were normally distributed (Gaussian), an even lower fraction of samples would be retained for analysis (Figure 2b). This would considerably decrease the overall screening time without compromising final accuracy. Of course, lower errors would allow for an even higher ability to narrow the selection of samples for analysis by a more accurate method, and slightly higher errors would lead to more samples to be analyzed. We interpret the results given herein having this goal in mind.
Figure 2.
(a) Supposing that the ee products from an asymmetric reaction were evenly distributed, with a ±15% error in ee values, approximately 75% could be discarded after screening. (b) In the case of a Gaussian distribution of product ee, an even lower number of samples would need to be further analyzed with a slower, high-accuracy technique.
2. Determining the Enantiomeric Excess of Test Samples on a 96-Well Plate Reader.
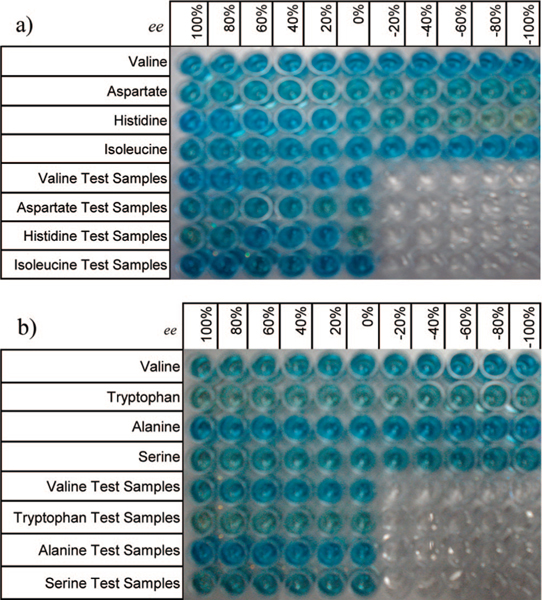
Chiral ligand 1 or 2 coordinates to a CuII metal center, leaving two open coordination sites for the exchange between the indicator CAS and α-amino acids.16 In the preceding paper, we described the ability to produce ee calibration curves and to determine ee values of test samples with a standard UV-vis spectrophotometer by exploiting the different stabilities of diastereomeric complexes created by [CuII((R,R)-1)]2+ and [CuII((R,R)-2)]2+ with chiral amino acids.22 The use of a 96-well plate was examined here as a means to integrate a rapid and automated method for determining ee, which will allow for a truly HTS of asymmetric catalysts. All ee calibration curves and test samples were prepared with a BioTek Precision Microplate Pipetting System on 96-well plates (Figure 3).
Figure 3.
The 96-well plate used for making the ee calibration curves. (a) For valine, aspartate, histidine, and isoleucine using receptor [CuII((R,R)-1)]2+ (top four rows) and six test samples for each of the above amino acids (bottom four rows). (b) For valine, tryptophan, alanine, and serine using receptor [CuII((R,R)-2)]2+ (top four rows) and six test samples for each of the above amino acids (bottom four rows).
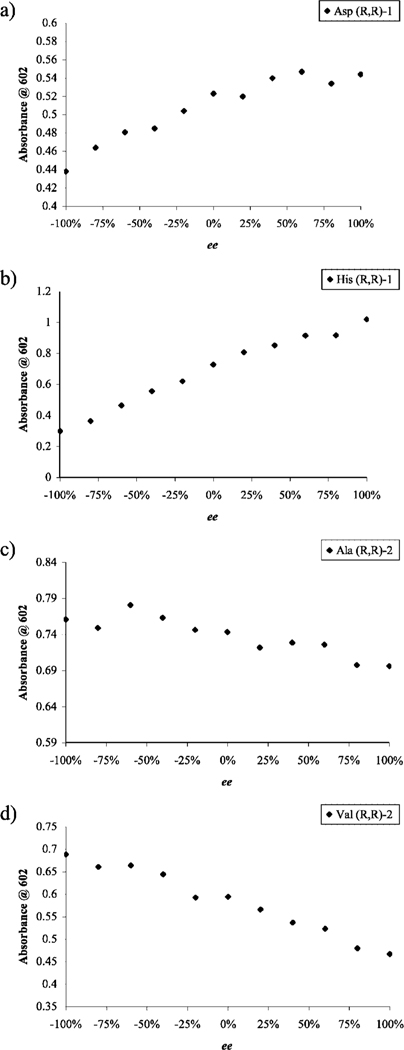
The same amino acids analyzed with a UV-vis spectrophotometer in the preceding paper for these two receptors were also analyzed here.22 Because the 96-well plate methodology is less labor-intensive and faster, we decided to add additional amino acids for analysis. In order to broaden the scope of our method, aspartate was added to analyses conducted with [CuII((R,R)-1)]2+ and tryptophan for [CuII((R,R)-2)]2+. On a 96-well plate, four rows were used for ee calibration curves, one for each amino acid.25,26 In the remaining four rows, six test samples for each amino acid were laid in each row, one for each amino acid. As representative examples, two ee calibration curves are shown in Figure 4 for each receptor. The test samples’ ee values were determined using the corresponding calibration curve. These test samples were made independently of the ee calibration curve, therefore affording a more convincing validation rather than the use of a jack-knife analysis.
Figure 4.
Enantiomeric excess calibration curves obtained using a 96-well plate reader. (a,b) Absorbance at 602 nm as a function of ee for displacement experiments performed in a solution containing CAS (10 μM), Cu(OTf)2 (200 μM), and (R,R)-1 (2.5 mM) in 1:1 MeOH:H2O, 50 mM HEPES buffered to pH 7.5, with the addition of (a) aspartate (302 μM) or (b) histidine (202 μM). (c,d) Absorbance at 602 nm as a function of ee for displacement experiments performed with the addition of amino acid into a solution containing CAS (10 μM), Cu(OTf)2 (105 μM), and (R,R)-2 (8.8 mM) in 1:1 MeOH:H2O, 50 mM HEPES buffered to pH 7.5, with the addition of (c) alanine (149 μM) or (d) valine (125 μM).
The ee calibration curves were subjected to linear and second-order polynomial regression. The best-fit curve (refer to Supporting Information) was used to determine the ee’s of true test and unknown samples. The average absolute errors were computed by taking the absolute difference between the actual and the experimental ee values and averaging them for the six test samples. The average of the absolute errors was obtained for analyses conducted with [CuII((R,R)-1)]2+ and [CuII((R,R)-2)]2+ (Table 1). The overall average of these individual average absolute errors was calculated to be ±9.7% for receptor [CuII((R,R)-1)]2+ and ±26.6% for receptor [CuII((R,R)-2)]2+, which is comparable to or somewhat higher than what was obtained with a standard UV-vis spectrophotometer analysis (±10.2% and ±13.6%, respectively) in our previous study (see preceding paper).22 Unfortunately, most of the average absolute errors using [CuII((R,R)-2)]2+ exceeded our arbitrary limit of 15% and would require improvements for such a system to be applied to them, but valine had an acceptable error of 8.5%. On the other hand, the average absolute errors using [CuII((R,R)-1)]2+ were well within the limit, as is exemplified by the case of histidine (4.8%). The transition from the UV-vis spectrophotometer to a 96-well plate reader has allowed for a much faster and automated process of analysis, since it takes approximately 1 min to read an entire plate, although the error suffered when [CuII((R,R)-2)]2+ was used.
Table 1.
Average Absolute Errors for the Determination of ee of Test Samples on a 96-Well Plate Reader Using Two Receptors
| (a) [CuII((R,R)-1)]2+a |
(b) [CuII((R,R)-2)]2+b |
||
|---|---|---|---|
| Amino Acid | average absolute error (%) | Amino Acid | average absolute error (%) |
| Asp | 13.5 | Ala | 32.0 |
| His | 4.8 | Ser | 47.6 |
| Ile | 10.3 | Trp | 18.3 |
| Val | 10.2 | Val | 8.5 |
Average absolute error of ee determination of six test samples for each amino acid analyzed through absorbance measurements taken on a 96-well plate reader, and ee calibration curves made for each amino acid using receptor [CuII((R,R)-1)]2+. Test samples containing CAS (10 μM), Cu(OTf)2 (200 μM), (R,R)-1 (2.5 mM), and a mixture of l- and d-amino acids (different concentrations of amino acids were used, refer to Table S-1 in the Supporting Information) were mixed and diluted to 300 μL with 1:1 MeOH:H2O, buffered to pH 7.5 with 50 mM HEPES. For experimental values obtained, refer to Supporting Information Table S-3.
Average absolute error of ee determination of six test samples for each amino acid analyzed through absorbance measurements taken on a 96-well plate reader, and ee calibration curves made for each amino acid using receptor [CuII((R,R)-2)]2+. Test samples containing CAS (10 μM), Cu(OTf)2 (105 μM), (R,R)-2 (8.8 mM), and a mixture of l- and d-amino acids (different concentrations of amino acids were used, refer to Table S-2 in the Supporting Information) were mixed and diluted to 300 μL with 1:1 MeOH:H2O, buffered to pH 7.5 with 50 mM HEPES. For experimental values obtained, refer to Supporting Information Table S-4.
The transition from the UV-vis spectrophotometer to a microwell plate format showed little loss of accuracy when using [CuII((R,R)-1)]2+ but a loss of accuracy with the use of [CuII((R,R)-2)]2+. The observed increase in error when using [CuII((R,R)-2)]2+ could be due to the decrease in ΔAmax values when transitioning to the microwell plate format from a single-cell cuvette. Upon transitioning, a decrease in the path length occurred, which would decrease the absorbance, leading to the compression of the range of absorbances between −100% and 100% ee. As discussed in the previous paper, the errors usually correlate to the ΔAmax values: the larger the ΔAmax values, the larger the difference in absorbance between two mixtures with close ee, thus lowering the errors.22 Since the ΔAmax values obtained for [CuII((R,R)-2)]2+ on the UV-vis spectrophotometer were already close to 0.1, which was our set threshold for enantioselectivity, some of them decreased below 0.1 when transitioning to a microwell plate format due to the decrease in path length. With the ΔAmax values below 0.1, an increase in errors was observed. For receptor [CuII((R,R)-1)]2+, the ΔAmax values obtained in the UV-vis spectrophotometer were well over 0.1, so that the decrease in path length did not cause them to drop below 0.1, thus not affecting the errors. Actually, the errors decrease for receptor [CuII((R,R)-1)]2+ due to the use of automated liquid handlers, which allowed for an increase in reproducibility. It is important to note that the path length issue could be corrected with the use of a deeper plate, which is commercially available. Also, the transition to a higher density plate does not require a reduction in path length.
3. Analysis of Asymmetrically Synthesized Unknown ee Sample.
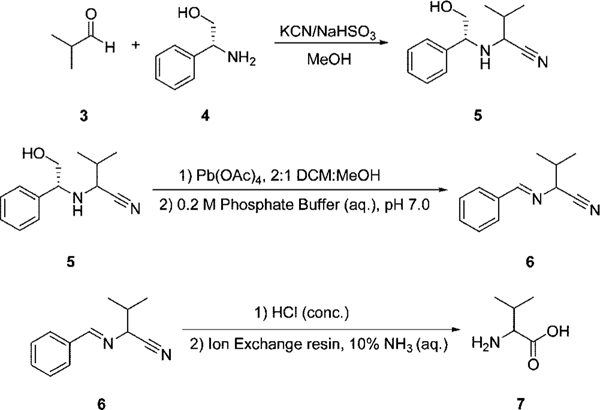
To show the practicability of the proposed method, the eIDA was used for the analysis of samples obtained from an asymmetric reaction. In order to provide such a sample, valine was synthesized using the asymmetric reaction shown in Scheme 1.27,28 The ee value of the unknown valine sample was first determined using the eIDA method with [CuII((R,R)-1)]2+, and this value was compared to that obtained by two well-accepted protocols: HPLC using a chiral stationary phase and 1H NMR with the use of a chiral shift reagent.23
Scheme 1.
Asymmetric Reaction Used To Produce a Sample of Valine of Unknown ee27,28
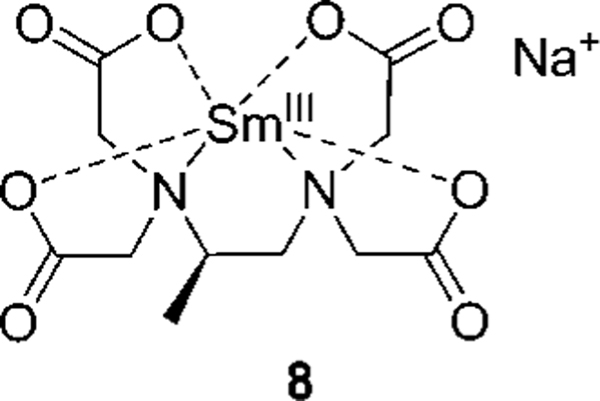
On a 96-well plate, an ee calibration curve for valine using [CuII((R,R)-1)]2+ was laid out on one row, with another row containing six replicates of a sample of valine of unknown ee obtained from the reaction. The ee’s of the six samples were computed using the best-fit curve of the ee calibration curve and averaged to be 84.6% (σ = 4.9%). The unknown valine sample was then analyzed by chiral HPLC using the chiral column Daicel Crownpak CR(+) (refer to the Supporting Information for analysis conditions) to give an ee of 79.9%. The Daicel Crownpak CR(+) was used in the analysis because it is the chiral HPLC column most commonly used for α-amino acids. Compared to chiral HPLC, the results of the eIDA method were shown to differ by 4.7%, which is within one standard deviation of the eIDA value. The ee of the unknown valine sample was also determined by an NMR titration, using the ratio of the integral of the Hα’s of l- and d-valine when mixed with sodium[(R)-1,2-diaminopropane-N,N,N′,N′-tetraacetato]samarate(III) hydrate23 (8, Figure 5). It was determined to be 72.6%, which is 7.3% off from the HPLC result. The eIDA analysis thus differed by 12.0% from the NMR results. This comparison affirmed that a sample from an asymmetric reaction could be analyzed with the proposed eIDA with acceptable accuracy and an error well within the range we have set for ourselves for preliminary screening of catalysts in asymmetric reactions in HT fashion with the use of a 96-well plate reader (Table 2).
Figure 5.
Chiral shift reagent, sodium[(R)-1,2-diaminopropane-N,N,N′,N′-tetraacetato]samarate(III) hydrate (8).
Table 2.
Determination of ee of a Sample of Valine of Unknown ee Using eIDA ([CuII((R,R)-1)]2+), Chiral HPLC, and 1H NMR Chiral Shift Reagent
Average ee determined from six replicates of a sample of valine of unknown ee using receptor [CuII((R,R)-1)]2+ on a 96-well plate reader.
ee determined through HPLC analysis with chiral column, Daicel Crownpak CR(+).
ee determined through 1H NMR analysis with a chiral shift reagent, 8.
4. Artificial Neural Network Analysis of Data.
Our group has previously shown that an ANN can be used to lower the absolute errors of eIDAs.18 Therefore, an ANN was used as a second method of analysis of the amino acid test samples. Statistica ANN software, version 4.0 E, was used to train a different network for each amino acid with the data collected for ee calibration curves on a 96-well plate reader. A different network was required for each amino acid because each one has a different ee calibration curve.
To train a network, the raw data already collected for the purpose of establishing ee calibration curves were used as training sets (absorbance between 570 and 620 nm). The range of wavelengths used to train the network was restricted to that containing the relevant spectral changes (570–620 nm). The ANN system was trained on the basis of the percentage of one enantiomer rather than ee, simply because the software is unable to accommodate negative values, so % l-amino acid was used. Percentage of l-amino acid is defined as the concentration of l-amino acid, divided by the total concentration of l- and d-amino acids.
Networks were developed for each amino acid, and the % l-amino acid values of the test samples analyzed with [CuII((R,R)-1)]2+ and [CuII((R,R)-2)]2+ were determined by inputting the test samples absorbances at the wavelengths with which the network was trained (570–620 nm), in order to check the efficacy of the ANN approach. Since the ee calibration curves are different for each amino acid and two receptors were used in the analysis, a different network is required for each one. An average absolute overall error of ±5.0% was obtained using receptor [CuII((R,R)-1)]2+ and ±17.1% with [CuII((R,R)-2)]2+, which are acceptable errors. The average absolute error for each amino acid for determining % l-amino acid with an ANN is shown in Table 3.
Table 3.
Average Absolute Errors for the Determination of % l-Amino Acid and ee, Using ANN with Data Collected on a 96-Well Plate Reader Using Two Receptors
| (a) [CuII((R,R)−1)]2+ |
(b) [CuII((R,R)−2)]2+ |
||||
|---|---|---|---|---|---|
| absolute error (%) |
absolute error (%) |
||||
| Amino Acid | for % l-AA | for ee | Amino Acid | for % l-AA | for ee |
| Asp | 4.4 | 8.8 | Ala | 16.4 | 32.9 |
| His | 5.0 | 9.9 | Ser | 20.3 | 40.6 |
| Ile | 6.6 | 13.1 | Trp | 27.8 | 55.6 |
| Val | 4.0 | 8.0 | Val | 3.8 | 7.6 |
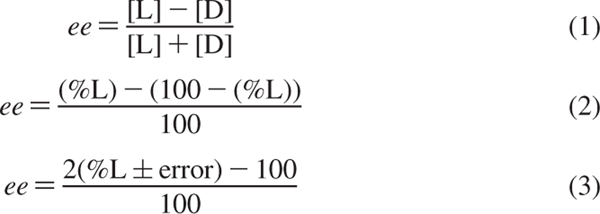
The errors obtained for the test samples using ee calibration curves may appear to be higher than the errors obtained using ANN, but these two methods cannot be compared directly since they are determining two different variables (ee and % l-amino acid). However, given the way we calculated ee (Scheme 2, eq 1), it is possible to compute ee using the % l-amino acid determined with ANN analysis (Scheme 2, eq 2). Numerically, the errors for ee will appear to double due to the very definition of this parameter (Scheme 2, eq 3). This is demonstrated by converting the % l-amino acid determined using ANN to ee (Scheme 2, eq 2) and by recalculating their average absolute errors, which are also shown in Table 3. The error in ee is double the error obtained with analysis using ANN for determining % l-amino acid (Table 3). After determining the ee using the value of % l-amino acid determined through ANN, the overall average absolute errors are ±10.0% and ±34.2% for analyses conducted with [CuII((R,R)-1)]2+ and [CuII((R,R)-2)]2+, respectively. This is comparable to the errors obtained for determining ee using ee calibration curves (Table 1).
Scheme 2.
Equations Used To Determine Enantiomeric Excess Using % l-Amino Acid Determined through ANN Analysis
The raw data previously obtained in a 96-well plate format for the six replicate valine samples of unknown ee, synthesized through an asymmetric reaction, were also analyzed using the appropriate ANN to determine the % l-amino acid. These samples averaged to be 84.1% (σ = 1.0%) l-valine, which corresponds to an ee of 68.2%. The errors between the % l-valine value calculated by ANN and those obtained with the chiral HPLC and chiral shift reagent23 are 5.9% and 2.2%, respectively. The comparison of % l-valine determined through ANN, chiral HPLC, and chiral shift reagent is shown in Table 4. This shows the high reliability of our approach in determining unknown % l-amino acid when the chiral receptor gives low overall errors.
Table 4.
ANN Analysis To Determine % l-Valine of a Sample of Valine of Unknown ee on a 96-Well Plate Reader
| ANNa | chiral HPLC | chiral shift reagent | |
|---|---|---|---|
| % l-unknown valine | 84.1 | 90.0 | 86.3 |
Network trained with raw data obtained from the ee calibration curve for valine, registered on a 96-well plate reader using receptor [CuII((R,R)-1)]2+.
The system presented here is truly a HTS technique because, when a single-wavelength-based calibration curve is employed, the time required for measuring the absorbance at one wavelength of all 96-wells is approximately 1 min. On a 96-well plate, we generally laid out four calibration curves, but in a typical HTS, there is one specific analyte of interest, so only one row would be taken up by the calibration curve, whereas the rest of the microwell plate would be used for samples. The calibration curves thus obtained could be automatically used to determine the ee of the samples, which requires less than a minute with a computer. This means that the analysis time of 84 samples would require 2 min, taking into account the measurement and processing of data. Liquid handlers can be used to dispense solutions into 96-well plates, as was done in this study. Also, an automated plate stacker can remove and place a new plate into the reader, thereby completely automating the procedure: this would allow for analysis of samples from start to finish without any operator intervention.
In cases where ANN was used as the method of analysis, a range of wavelengths would be scanned: it takes approximately 9 min to obtain absorbance data from 570 to 620 nm for the entire 96-well plate. The absorbance at this range of wavelengths could be used automatically by a computer to generate and train the ANN. It takes approximately 15 min to create a neural network that best models the training set. Hence, for the analysis of one amino acid (i.e., one calibration curve and seven rows of samples), it would require approximately 25 min to obtain measurements of the entire plate (absorbance = 570–620 nm) and to train to obtain the best neural network. The computer could then compute the % l-amino acid with a trained network in hand. Once a network is generated, it does not need to be recomputed as long as instrumental parameters do not change, and the analysis time will be shortened to the time required to read 96-wells and process the read data, which is around 10 min.
The method proposed here is much more rapid than the use of chiral HPLC. As discussed in the Design Criteria section, the purpose that we envision does not strictly require extreme accuracy. In fact, in the first steps of a screening for asymmetric catalysts, even a pass/fail answer based on a threshold ee value would be adequate. After screening with our method, the reactions that generated low-ee products could be discarded, while only the best leads (for example, those whose products had 90+% ee within the error of our analysis) would be further examined, and their products would be reassessed with a more accurate standard technique to be taken on to the next level of optimization. Such a two-tier method would expedite the screening process immensely.
Summary
In this study, enantioselective indicator displacement assays (eIDAs) have been used to determine the enantiomeric excess of α-amino acids with acceptable accuracy using a 96-well plate reader, as would be done in high-throughput screening. Enantiomeric excess was determined for test samples using ee calibration curves on a 96-well plate reader, affording an overall average error of ±9.7% when analysis of samples was conducted with receptor [CuII((R,R)-1)]2+ and an overall average error of ±26.6% when receptor [CuII((R,R)-2)]2+ was used. As shown in this paper, the errors produced through the analysis of test samples on a 96-well plate reader were consistent with those obtained on a UV-vis spectrophotometer, with the advantage of increased speed of analysis, as required in a HTS method.
A sample of valine was asymmetrically synthesized, and its ee, analyzed with receptor [CuII((R,R)-1)]2+, was determined to be 84.6%. This result was compared to that obtained by reference methods (chiral-column HPLC and 1H NMR chiral shift reagent) and found to be in good agreement (79.9% and 72.6%, respectively). This showed the assay’s ability to analyze real-world samples.
Artificial neural networks were used as a second method to determine the % l-amino acid of test samples. Using the collected absorbance data, networks were developed for each amino acid. ANN analysis on the data collected for test samples in a 96-well plate format showed overall average errors of ±5.0% and ±17.1% for analyses conducted with [CuII((R,R)-1)]2+ and [CuII((R,R)-2)]2+, respectively. ANN was also able to determine % l-amino acid of the sample of valine of unknown ee with an excellent error relative to standard methods, chiral HPLC and chiral shift reagent, giving 5.9% and 2.2% errors, respectively.
In conclusion, the proposed eIDA method has been shown to be capable of determining ee of α-amino acids as a HTS technique mainly due to the use of colorimetric sensing. The transition to a microplate reader from a UV-vis spectrophotometer was possible, allowing for a more rapid analysis time while retaining accuracy in determining ee, showing that the method is robust. Even a real-world sample from a reaction showed excellent agreement with accepted methods. The use of a microwell plate reader allows for a seamless integration into a HTS workflow aimed at asymmetric reaction discovery or optimization.
Supplementary Material
Acknowledgment.
We gratefully acknowledge financial support from the National Institutes of Health (GM77437) and the Welch Foundation.
Footnotes
Supporting Information Available: Experimental details, calibration curves, ee determinations, and artifical neural network analysis. This information is available free of charge via the Internet at http://pubs.acs.org.
References
- (1).Reetz MT Angew. Chem., Int. Ed 2001, 40, 284–310. [PubMed] [Google Scholar]
- (2).Tsukamoto M; Kagan HB Adv. Synth. Catal 2002, 344, 453–463. [Google Scholar]
- (3).Traverse JF; Snapper ML Drug Discovery Today 2002, 7, 1002–1012. [DOI] [PubMed] [Google Scholar]
- (4).Stambuli JP; Hartwig JF Curr. Opin. Chem. Biol 2003, 7, 420–426. [DOI] [PubMed] [Google Scholar]
- (5).Collins AN; Sheldrake GNCJ Chirality in Industry; Wiley: New York/Chichester England, 1992. [Google Scholar]
- (6).Van Arnum P. Pharmaceutical Technol. 2006, 30, 42–45. [Google Scholar]
- (7).Jaekel C; Paciello R. Chem. Rev 2006, 106, 2912–2942. [DOI] [PubMed] [Google Scholar]
- (8).Ding K. Pure Appl. Chem 2005, 77, 1251–1257. [Google Scholar]
- (9).Gennari C; Piarulli U. Chem. Rev 2003, 103, 3071–3100. [DOI] [PubMed] [Google Scholar]
- (10).Kuntz KW; Snapper ML; Hoveyda AH Curr. Opin. Chem. Biol 1999, 3, 313–319. [DOI] [PubMed] [Google Scholar]
- (11).Charbonneau V; Ogilvie WW Mini-Rev. Org. Chem 2005, 2, 313–332. [Google Scholar]
- (12).Finn MG Chirality 2002, 14, 534–540. [DOI] [PubMed] [Google Scholar]
- (13).Lavigne JJ; Anslyn EV Angew. Chem., Int. Ed 1999, 38, 3666–3669. [PubMed] [Google Scholar]
- (14).Nguyen BT; Anslyn EV Coord. Chem. ReV 2006, 250, 3118–3127. [Google Scholar]
- (15).Folmer-Andersen JF; Kitamura M; Anslyn EV J. Am. Chem. Soc 2006, 128, 5652–5653. [DOI] [PubMed] [Google Scholar]
- (16).Folmer-Andersen JF; Lynch VM; Anslyn EV J. Am. Chem. Soc 2005, 127, 7986–7987. [DOI] [PubMed] [Google Scholar]
- (17).Zhu L; Anslyn EV J. Am. Chem. Soc 2004, 126, 3676–3677. [DOI] [PubMed] [Google Scholar]
- (18).Zhu L; Shabbir SH; Anslyn EV Chem.-Eur. J 2006, 13, 99–104. [DOI] [PubMed] [Google Scholar]
- (19).Kacprzak K; Grajewski J; Gawronski J. Tetrahedron: Asymmetry 2006, 17, 1332–1336. [Google Scholar]
- (20).Kubo Y; Ishida T; Kobayashi A; James TD J. Mater. Chem 2005, 15, 2889–2895. [Google Scholar]
- (21).Zhu L; Zhong Z; Anslyn EV J. Am. Chem. Soc 2005, 127, 4260–4269. [DOI] [PubMed] [Google Scholar]
- (22).Leung D; Folmer-Andersen JF; Lynch VM; Anslyn EV J. Am. Chem. Soc 2008, 130, 12318–12327 (preceding paper in this issue). [DOI] [PMC free article] [PubMed] [Google Scholar]
- (23).Inamoto A; Ogasawara K; Omata K; Kabuto K; Sasaki Y. Org. Lett 2000, 2, 3543–3545. [DOI] [PubMed] [Google Scholar]
- (24).Peterson KL ReV. Computa. Chem 2000, 16, 53–140. [Google Scholar]
- (25).Refer to Supporting Information, Figure S-1, for ee calibration curves of a selection of amino acids analyzed with [CuII((R,R)-1)]2+ on a 96-well plate reader.
- (26).Refer to Supporting Information, Figure S-2, for ee calibration curves of a selection of amino acids analyzed with [CuII((R,R)-2)]2+ on a 96-well plate reader.
- (27).Chakraborty TK; Hussain KA; Reddy GV Tetrahedron 1995, 51, 9179–9190. [Google Scholar]
- (28).Inaba T; Kozono I; Fujita M; Ogura K. Bull. Chem. Soc. Jpn 1992, 65, 2359–2365. [Google Scholar]
Associated Data
This section collects any data citations, data availability statements, or supplementary materials included in this article.


