

Abstract
We intended to characterize functional relevance of microRNA (miR)-224-3p in endothelial cell (EC) apoptosis and reactive oxygen species (ROS) accumulation in atherosclerosis, considering also the integral involvement of histone deacetylase 1 (HDAC1)-mediated hypoxia-inducible factor-1α (HIF1α) deacetylation. The binding affinity between miR-224-3p and Fos-like antigen 2 (FOSL2) was predicted and validated. Furthermore, we manipulated miR-224-3p, FOSL2, HDAC1, and HIF1α expression in oxidized low-density lipoprotein (ox-LDL)-induced ECs, aiming to clarify their effects on cell activities, inflammation, and ROS level. Additionally, we examined the impact of miR-224-3p on aortic atherosclerotic plaque and lesions in a high-fat-diet-induced atherosclerosis model in ApoE−/− mice. Clinical atherosclerotic samples and ox-LDL-induced human aortic ECs (HAECs) exhibited low HDAC1/miR-224-3p expression and high HIF1α/FOSL2 expression. miR-224-3p repressed EC cell apoptosis, inflammatory responses, and intracellular ROS levels through targeting FOSL2. HIF1α reduced miR-224-3p expression to accelerate EC apoptosis and ROS accumulation. Moreover, HDAC1 inhibited HIF1α expression by deacetylation, which in turn enhanced miR-224-3p expression to attenuate EC apoptosis and ROS accumulation. miR-224-3p overexpression reduced atherosclerotic lesions in vivo. In summary, HDAC1 overexpression may enhance the anti-atherosclerotic and endothelial-protective effects of miR-224-3p-mediated inhibition of FOSL2 by deacetylating HIF1α, underscoring a novel therapeutic insight against experimental atherosclerosis.
Keywords: HDAC1, HIF1α, miR-224-3p, FOSL2, atherosclerosis, endothelial cell apoptosis, reactive oxygen species
Graphical Abstract
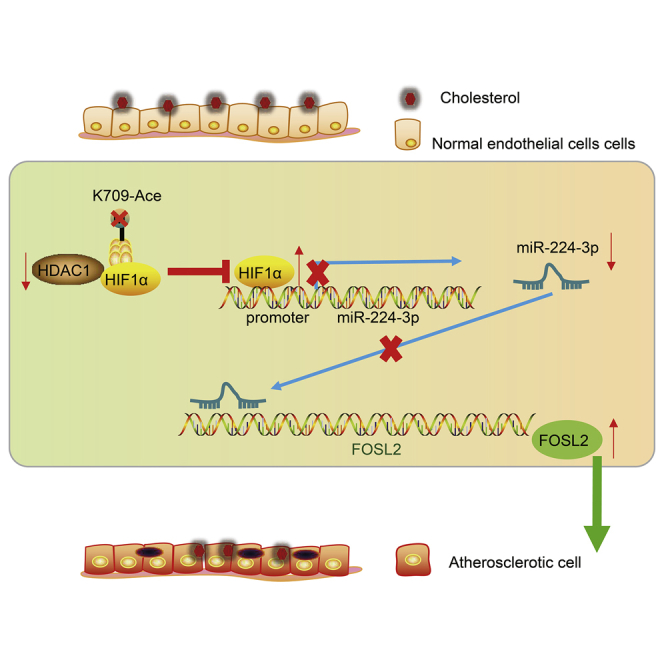
The study mainly addressed the suppressive role of HDAC1-mediated deacetylation of HIF1α in atherosclerosis progression, which was associated with miR-224-3p-mediated inhibition of FOSL2, thus highlighting a potential therapeutic action against atherosclerosis.
Introduction
Atherosclerosis is a chronic and progressive inflammatory disorder that is characterized by lipid accumulation and occurrence of fibrous lesions in the large arteries, commonly leading to myocardial infarction, stroke, and other cardio-cerebral-vascular events.1 It is now clear that endothelium dysfunction and vascular inflammation are responsible for the initiation and maintenance of atherosclerotic plaque formation.2 Recent evidence has ascribed lesion formation to injury of endothelial cells (ECs) at susceptible vascular sites, where ECs generate pro-apoptotic proteins and are prone to apoptosis.3 Accumulating evidence confirms that apoptosis in human aortic ECs (HAECs) is fundamental for the pathophysiology of atherosclerosis and contributes to its development.4,5 Additionally, pro-atherogenic stimuli facilitate EC permeability, resulting in overproduction of reactive oxygen species (ROS), which are a component of oxidative stress.6 Identification of the relevant molecular biomarkers is necessary to develop novel therapeutic strategies for ameliorating endothelial dysfunction, which might impede or even reverse disease progression in atherosclerosis.7
Endogenously expressed microRNAs (miRNAs) are small non-coding RNAs that mediate gene expression at the post-transcriptional level.8 Interestingly, emerging studies have highlighted the dysregulation of miRNAs in the physiological and pathophysiological processes underlying atherosclerosis and cardiovascular diseases, such as in EC activity, macrophage function, and vascular smooth muscle cell behaviors.9, 10, 11 For instance, miR-98, miR-146a, miR-1185, miR-210, miR-148b, and miR-20a/b are all implicated in the progression of atherosclerosis.12, 13, 14 Of note, miR-224 has been revealed to control mammary epithelial cell apoptosis and lipid metabolism, which are also two distinct features of atherosclerosis, by targeting the ACADM and ALDH2 genes.15 Furthermore, a study by Xu et al.16 suggests that forced expression of miR-224 attenuates the formation of vulnerable atherosclerotic plaques and vascular remodeling in acute coronary syndrome. Additionally, miR-224 expression is localized in human coronary artery lesions, thus implying its participation in the modulation of atherosclerosis progression,17 although details of the molecular mechanism remain unknown. The bioinformatics analysis in this study identified a putative target gene of miR-224-3p, namely Fos-like antigen 2 (FOSL2). Previous work of Drosos et al.18 has indicated that FOSL2 is a factor in accelerated inflammation and fibrosis in the coronary arteries, which may promote formation of atherosclerotic plaques. There is evidence showing that the miR-224-coding locus in Xq28 is reciprocally regulated by histone deacetylase 1 (HDAC1).19 HDAC inhibitors are sometimes employed in a clinical oncology setting, partly due to their anti-angiogenic abilities.20 HDAC1 has low expression in atherosclerotic lesions and in oxidized low-density lipoprotein (ox-LDL)-treated human aortic ECs, and its overexpression curbs atherosclerotic formation.21 Additionally, hypoxia-inducible factor-1α (HIF1α) was negatively correlated with miR-224-3p expression in glioblastoma and astrocytoma.22 A prior study indicated that HDAC1 inhibited HIF1α expression through de-lysine acetylation.23 Therefore, we performed this study to test the hypothesis that the HDAC1/HIF1α/miR-224-3p/FOSL2 axis has a regulatory role in the progression of atherosclerosis.
Results
miR-224-3p was poorly expressed in atherosclerosis
Initially, we determined the expression of miR-224-3p in normal artery and atherosclerotic lesion specimens using quantitative reverse-transcriptase polymerase chain reaction (qRT-PCR). The results revealed that the expression of miR-224-3p was markedly diminished in atherosclerotic lesions when compared with normal artery (p < 0.05; Figure 1).
Figure 1.

miR-224-3p is poorly expressed in atherosclerotic tissues
The expression of miR-224-3p in normal artery and atherosclerotic lesion tissues was examined by qRT-PCR, normalized to U6. N = 62. ∗p < 0.05 versus the control or blank group. The cell experiment was repeated three times independently. miR, microRNA; qRT-PCR, quantitative reverse-transcriptase polymerase chain reaction; ox-LDL, oxidized low-density lipoprotein; HAECs, human aortic endothelial cells; AL, atherosclerotic lesion.
miR-224-3p inhibits cell apoptosis and ROS accumulation in ox-LDL-induced HAECs
After discovering the abnormal expression of miR-224-3p in the cell model of atherosclerosis, we knocked out or overexpressed miR-224-3p in ox-LDL-induced HAECs to study the function of miR-224-3p in atherosclerosis. First, we examined the cellular expression of miR-224-3p in the ox-LDL-induced HAEC model of atherosclerosis by qRT-PCR, which showed that the expression of miR-224-3p was significantly reduced in ox-LDL-induced HAECs in comparison to HAECs without any treatment (blank group) (p < 0.05; Figure 2A). In addition, transfection with miR-224-3p mimic or miR-224-3p inhibitor caused no changes in cell morphology (Figure S1), and treatment with negative control (NC)-mimic or NC-inhibitor did not affect cell function in the absence of ox-LDL induction (Figures S2A–S2E). The results of qRT-PCR showed significantly increased expression of miR-224-3p in response to miR-224-3p mimic but markedly diminished miR-224-3p expression in the presence of miR-224-3p inhibitor (p < 0.05; Figure 2B). Results from flow cytometry showed a significant increase in cell apoptosis after ox-LDL induction compared to that in HAECs without any treatment (blank group); miR-224-3p mimic significantly inhibited cell apoptosis, while miR-224-3p inhibitor contributed to a conspicuous promotion of cell apoptosis (p < 0.05; Figure 2C). Moreover, Cell Counting Kit-8 (CCK-8) results revealed a significant increase in cell proliferation after ox-LDL induction when compared with HAECs without any treatment (blank group); miR-224-3p mimic notably increased cell proliferation, while miR-224-3p inhibitor resulted in a marked decline (p < 0.05; Figure 2D). The ROS level was significantly higher in ox-LDL-inducted cells compared to that in HAECs without any treatment (blank group); miR-224-3p mimic significantly reduced the ROS level in cells, but miR-224-3p inhibitor provoked a significant increase (p < 0.05; Figure 2E). Next, the results from enzyme-linked immunosorbent assay (ELISA) showed that ox-LDL induction notably increased the levels of tumor necrosis factor-α (TNF-α), interleukin (IL)-1β, and IL-6 compared to findings in HAECs without any treatment (blank group); the levels of TNF-α, IL-1β, and IL-6 were remarkably inhibited by miR-224-3p mimic treatment but promoted by miR-224-3p inhibitor (p < 0.05; Figure 2F). In conclusion, miR-224-3p could inhibit cell apoptosis and ROS accumulation in ox-LDL-induced HAECs.
Figure 2.

miR-224-3p inhibits apoptosis and ROS accumulation in ox-LDL-induced HAECs
(A) The expression of miR-224-3p in ox-LDL-induced HAECs as examined by RT-qPCR, normalized to U6. ox-LDL-induced HAECs were transfected with NC-mimic, miR-224-3p mimic, NC-inhibitor, or miR-224-3p inhibitor. (B) The apoptosis of ox-LDL-induced HAECs as examined by flow cytometry. (C) The proliferation of ox-LDL-induced HAECs as examined by CCK-8 assay. (D) ROS levels in ox-LDL-induced HAECs measured using an ROS detection kit. (E) The levels of TNF-α, IL-1β, and IL-6 in ox-LDL-induced HAECs as determined using ELISA. ∗p < 0.05 vs. the blank group. #p < 0.05 vs. the NC-mimic group. $p < 0.05 vs. the NC-inhibitor group. The experiment was repeated three times independently. miR, microRNA; ox-LDL, oxidized-low density lipoprotein; HAECs, human aortic endothelial cells; RT-qPCR, reverse transcription quantitative polymerase chain reaction; CCK-8, cell counting kit-8; ROS, reactive oxygen species; TNF-α, tumor necrosis factor-α; IL-1β, interleukin-1β; IL-6, interleukin-6; ELISA, enzyme-linked immunosorbent assay; NC, negative control; ANOVA, analysis of variance; OD, optical density.
miR-224-3p targets and downregulates FOSL2
To investigate the downstream mechanism regulated by miR-224-3p, we first predicted the downstream target genes of miR-224-3p using the starBase database. Kyoto Encyclopedia of Genes and Genomes (KEGG) enrichment analysis of the prediction results (Figure 3A; Tables S1 and S2) suggested that these genes were mainly enriched in signaling pathways, such as mitogen-activated protein kinase (MAPK), which have earlier been linked to the development of atherosclerosis.24,25 Then, retrieval for these potential target genes revealed that FOSL2 had binding sites for miR-224-3p (Figure 3B). Here, the KEGG database showed that the FOSL2 gene was associated with multiple signaling pathways such as MAPK (map04380), indicating that the FOSL2 gene may play a regulatory role in atherosclerosis. In addition, dual luciferase reporter gene assay results revealed significantly reduced luciferase activity of FOSL2-3′untranslated region (3′UTR)-wild-type (WT) in 293T cells transfected with miR-224-3p mimic relative to NC mimic (p < 0.05), while the luciferase activity of FOSL2-3′UTR mutant type (MUT) had no such significant changes (p > 0.05; Figures 3C and 3D). In HAECs, the mRNA and protein expression of FOSL2 was significantly lowered upon miR-224-3p mimic (p < 0.05), while it was notably increased after treatment with miR-224-3p inhibitor when compared with their corresponding NCs (p < 0.05; Figures 3E and 3F). Furthermore, based on the results from qRT-PCR and western blot analysis, FOSL2 was highly expressed in clinical samples of atherosclerotic tissues when compared with normal artery samples (p < 0.05; Figures 3G and 3H). Next, qRT-PCR and western blot analysis also revealed an elevation of FOSL2 expression in ox-LDL-treated HAECs in contrast to that in HAECs without any treatment (blank group) (p < 0.05; Figures 3I and 3J). Pearson’s correlation analysis highlighted a negative correlation between FOSL2 expression and miR-224-3p expression in clinical atherosclerotic samples (p < 0.05; Figure 3K). These results support the finding that FOSL2 is a direct target gene of miR-224-3p and that miR-224-3p inhibits the expression of FOSL2.
Figure 3.

miR-224-3p targets and downregulates FOSL2
(A) The results of KEGG functional enrichment analysis of downstream target genes. The abscissa refers to GeneRatio and the ordinate refers to KEGG entries. The histogram on the right represents the color scale. (B) The binding sites between miR-224-3p and FOSL2-3′UTR. (C) The luciferase activity (human) examined using dual luciferase reporter gene assay in 293T cells. ∗p < 0.05 versus the NC-mimic group. (D) The luciferase activity (mouse) examined using dual luciferase reporter gene assay in 293T cells. ∗p < 0.05 versus the NC-mimic group. (E) The mRNA expression of FOSL2 in HAECs as examined by qRT-PCR, normalized to GAPDH. ∗p < 0.05 versus the NC-mimic group. #p < 0.05 versus the NC-inhibitor group. (F) The protein expression of FOSL2 in HAECs as examined by western blot analysis, normalized to GAPDH. (G) The mRNA expression of FOSL2 in clinical vascular samples as examined by qRT-PCR, normalized to GAPDH, n = 62. ∗p < 0.05 versus the control group. (H) The protein expression of FOSL2 in clinical vascular samples as examined by western blot analysis, normalized to GAPDH, n = 62. (I) The mRNA expression of FOSL2 in the cell model of atherosclerosis as examined by qRT-PCR, normalized to GAPDH. ∗p < 0.05 versus the blank group. (J) The protein expression of FOSL2 in the cell model of atherosclerosis as examined by western blot analysis, normalized to GAPDH. (K) Pearson’s correlation analysis between the expression of FOSL2 and miR-224-3p in clinical atherosclerotic samples. The cell experiment was repeated three times independently. FOSL2, Fos-like antigen 2; KEGG, Kyoto Encyclopedia of Genes and Genomes; 3′UTR, 3′untranslated region; mRNA, messenger RNA; GAPDH, glyceraldehyde-3-phosphate dehydrogenase; WT, wild-type; MUT, mutant.
miR-224-3p inhibits cell apoptosis and ROS accumulation in ox-LDL-induced HAECs by targeting FOSL2
We verified the role of miR-224-3p in atherosclerosis by targeting FOSL2. Western blot analysis results showed that overexpression of FOSL2 promoted the expression of apoptosis-related proteins (cleaved-poly[ADP-ribose] polymerase [PARP], cleaved caspase-3, and Bcl-2-associated X protein [Bax]) relative to overexpression (oe)-NC treatment, and reversed the effects provoked by miR-224-3p mimic (Figure 4A). ELISA results showed that overexpression of FOSL2 elevated the levels of TNF-α, IL-1β, and IL-6 compared with oe-NC treatment and neutralized the effects of miR-224-3p mimic (Figure 4B). Biochemical analysis showed that overexpression of FOSL2 significantly increased ROS levels in cells and that overexpression of both FOSL2 and miR-224-3p could reverse the effect on ROS exerted by miR-224-3p mimic (p < 0.05; Figure 4C). In addition, flow cytometry showed that overexpression of FOSL2 significantly promoted cell apoptosis when compared with oe-NC treatment and that overexpression of both FOSL2 and miR-224-3p counteracted the effects of miR-224-3p mimic alone (p < 0.05; Figure 4D). CCK-8 assay results showed that, in contrast to oe-NC, overexpression of FOSL2 significantly inhibited cell proliferation, while concomitant overexpression of FOSL2 and miR-224-3p reversed the effect on the proliferation exerted by miR-224-3p mimic (p < 0.05; Figure 4E). In conclusion, miR-224-3p could inhibit apoptosis and ROS accumulation in ox-LDL-induced HAECs by targeting FOSL2.
Figure 4.

miR-224-3p inhibits cell apoptosis and ROS accumulation in ox-LDL-induced HAECs by targeting FOSL2
(A) The expression of apoptosis-related proteins (cleaved-PARP, cleaved caspase-3, and Bax) in ox-LDL-induced HAECs as examined by western blot analysis, normalized to GAPDH. (B) The levels of TNF-α, IL-1β, and IL-6 in the supernatant of ox-LDL-induced HAECs as examined by ELISA. (C) ROS level in ox-LDL-induced HAECs measured using an ROS detection kit. (D) The apoptosis of ox-LDL-induced HAECs as examined by flow cytometry. (E) The proliferation of ox-LDL-induced HAECs as examined by CCK-8 assay. ∗p < 0.05 versus the oe-NC group. #p < 0.05 versus the oe-NC + miR-224-3p-mimic group. The experiment was repeated three times independently. PARP, poly(ADP-ribose) polymerase; Bax, Bcl-2 associated X protein; oe, overexpression; Bcl-2, B cell lymphoma-2.
HIF1α downregulates miR-224-3p expression to promote cell apoptosis and ROS accumulation in ox-LDL-induced HAECs
HIF1α can promote the development of atherosclerosis,26,27 and HIF1α expression has an inverse relation with miR-224-3p levels in glioblastoma and astrocytoma.22 Therefore, we speculated that HIF1α might be involved in atherosclerosis via miR-224-3p. As revealed from the JASPAR database, HIF1α could bind to the miR-224 promoter region as a transcription factor, indicating that HIF1α might indeed transcriptionally mediate the miR-224 expression (Table S3). The results from qRT-PCR revealed that HIF1α was highly expressed in clinical samples of atherosclerotic tissues and ox-LDL-treated HAECs (p < 0.05; Figures 5A and 5B). Dual luciferase reporter gene assay showed that luciferase activity of the WT-miR-224-3p promoter was significantly reduced by oe-HIF1α treatment (p < 0.05), while no significant difference was evident in the luciferase activity of MUT-miR-224-3p promoter (p > 0.05; Figure 5C). According to qRT-PCR results, depletion of HIF1α significantly increased the expression of miR-224-3p when compared with small interfering RNA (si)-NC (p < 0.05; Figure 5D). Based on the western blot analysis results, compared to si-NC, depletion of HIF1α inhibited FOSL2 expression and diminished the expression of apoptosis-related proteins (cleaved-PARP, cleaved caspase-3, and Bax). In addition, simultaneous depletion of HIF1α and miR-224-3p reversed these effects caused by depletion of HIF1α alone (Figure 5E). ELISA results revealed that levels of TNF-α, IL-1β, and IL-6 were significantly reduced by depletion of HIF1α in comparison to si-NC, while simultaneous depletion of both HIF1α and miR-224-3p reversed the effect of depletion of only HIF1α (p < 0.05; Figure 5F). Additionally, ROS levels in cells were notably reduced upon depletion of HIF1α, while the effect was rescued upon simultaneous depletion of both HIF1α and miR-224-3p (p < 0.05; Figure 5G). As demonstrated by CCK-8 assay, cell proliferation was markedly promoted upon depletion of HIF1α relative to si-NC, and this effect was rescued by simultaneous depletion of HIF1α and miR-224-3p (p < 0.05; Figure 5H). Flow cytometry results showed that HIF1α depletion significantly inhibited cell apoptosis in contrast to si-NC treatment, while simultaneous depletion of both HIF1α and miR-224-3p rescued the effect of HIF1α depletion alone (p < 0.05; Figure 5I). Overall, HIF1α expression negatively regulates the expression of miR-224-3p, thereby promoting cell apoptosis and ROS accumulation in ox-LDL-induced HAECs.
Figure 5.

HIF1α depresses the cell apoptosis and ROS accumulation in ox-LDL-induced HAECs
(A) The expression of HIF1α in normal artery (control group) and atherosclerotic lesions as examined by qRT-PCR, normalized to GAPDH. n = 62. ∗p < 0.05 versus the control group. (B) The expression of HIF1α in ox-LDL-induced HAECs as examined by qRT-PCR, normalized to GAPDH. ∗p < 0.05 versus the blank group. (C) The results of dual-luciferase gene reporter analysis on effect of HIF1α on 2 promoter regions of miR-224-3p. (D) The expression of HIF1α, miR-224-3p, and FOSL2 in ox-LDL-induced HAECs in response to different treatment as examined by qRT-PCR, normalized to U6 or GAPDH. (E) The expression of apoptosis-related proteins (cleaved-PARP, cleaved caspase-3, and Bax) in ox-LDL-induced HAECs as examined by western blot analysis, normalized to GAPDH. (F) The levels of TNF-α, IL-1β, and IL-6 in the supernatant of ox-LDL-induced HAECs as examined by ELISA. (G) ROS level in ox-LDL-induced HAECs examined using an ROS detection kit. (H) The proliferation of ox-LDL-induced HAECs as examined by CCK-8 assay. (I) The apoptosis of ox-LDL-induced HAECs as examined by flow cytometry. In panels (C) and (E)–(H), ∗p < 0.05 versus the si-NC group. #p < 0.05 versus the si-HIF1α + NC-inhibitor group. In (H), statistical analysis in relation to time-based measurements within each group was performed with the use of repeated-measures ANOVA, followed by Bonferroni’s post hoc test. The cell experiment was repeated three times independently. HIF1α, hypoxia-inducible factor-1α; si, small interfering RNA.
HDAC1 upregulates miR-224-3p through inhibiting HIF1α via deacetylation of lysine, thereby inhibiting cell apoptosis and ROS accumulation in ox-LDL-induced HAECs
We next proceeded to explore the expression of HDAC1 in atherosclerotic tissues and cells. The results from qRT-PCR and western blot analysis showed low expression of HDAC1 in clinical samples of atherosclerotic tissues and in the cell model of atherosclerosis (p < 0.05; Figures 6A and 6B). Co-immunoprecipitation (coIP) assay revealed an interaction between HDAC1 and HIF1α (Figure 6C). coIP results also showed that overexpression of HDAC1 significantly inhibited the acetylation level of HIF1α relative to effects of immunoglobulin G (IgG) (Figure 6D). In addition, qRT-PCR analysis showed that HDAC1 overexpression did not change HIF1α expression, whereas oe-HIF1α treatment enhanced HIF1α mRNA expression in the presence of oe-HDAC1. Overexpression of HDAC1 significantly diminished the expression of FOSL2, while increasing that of miR-224-3p (p < 0.05), which was reversed by the combination of HDAC1 and HIF1α overexpression (p < 0.05; Figure 6E). Western blot analysis also revealed that overexpression of HDAC1 led to a decline in the expression of HIF1α and apoptosis-related proteins (cleaved-PARP, cleaved caspase-3, and Bax), while overexpression of HDAC1 plus overexpression of HIF1α reversed these effects (Figure 6F). As demonstrated by ELISA, the levels of TNF-α, IL-1β, and IL-6 were remarkably reduced by overexpression of HDAC1 but were normalized upon simultaneous overexpression of both HDAC1 and HIF1α (p < 0.05) (Figure 6G). ROS levels were notably reduced in cells with HDAC1 overexpression, but ROS was increased upon simultaneous overexpression of HDAC1 and HIF1α (p < 0.05) (Figure 6H). As revealed by CCK-8 assay, there was a remarkable enhancement of cell proliferation in response to HDAC1 overexpression, which was reversed by simultaneous overexpression of HDAC1 and HIF1α (p < 0.05) (Figure 6I). Based on the flow cytometry, HDAC1 overexpression notably suppressed cell apoptosis, while simultaneous HDAC1 and HIF1α overexpression reversed this inhibitory effect (p < 0.05) (Figure 6J). Taken together, HDAC1 inhibits HIF1α expression through deacetylation, thereby increasing the expression of miR-224-3p, which inhibits cell apoptosis and ROS accumulation in ox-LDL-induced HAECs.
Figure 6.

HDAC1 induces HIF1α deacetylation to increase the expression of miR-224-3p, thereby inhibiting cell apoptosis and ROS accumulation in ox-LDL-induced HAECs
(A and B) The expression of HDAC1 in atherosclerotic tissues of clinical samples (n = 62) and the cell model of atherosclerosis, as examined by qRT-PCR and western blot analysis. (C) The enrichment of HDAC1 in the promoter region of HIF1α as examined by coIP. ∗p < 0.05 versus IgG. #p < 0.05 versus the oe-NC group. (D) The acetylation level of HIF1α regulated by HDAC1, as examined by IP. (E) The expression of HIF1α, miR-224-3p, and FOSL2 as examined by qRT-PCR, normalized to U6 or GAPDH. (F) The expression of apoptosis-related proteins (cleaved-PARP, cleaved caspase-3, and Bax) in ox-LDL-induced HAECs as examined by western blot analysis, normalized to GAPDH. (G) The levels of TNF-α, IL-1β, and IL-6 in the supernatant of ox-LDL-induced HAECs as examined by ELISA. (H) ROS level in ox-LDL-induced HAECs examined using an ROS detection kit. (I) The proliferation of ox-LDL-induced HAECs as examined by CCK-8 assay. (J) The apoptosis of ox-LDL-induced HAECs as examined by flow cytometry. In panels (E) and (G)–(J), ∗p < 0.05 versus the oe-NC group. #p < 0.05 versus the oe-HDAC1 group. The cell experiment was repeated three times independently. HDAC1, histone deacetylase 1; IP, immunoprecipitation; IgG, immunoglobulin G.
miR-224-3p upregulation alleviates atherosclerosis in mice
Since mice with ApoE gene knockdown are prone to abnormal lipid metabolism and lipid deposition, a large number of previous studies have used ApoE knockout (ApoE−/−) mice for the establishment of an atherosclerotic model.28,29 In this study, ApoE−/− mice were fed with normal diet (ND) or high-fat diet (HFD) for 12 weeks to study the role of miR-224-3p in atherosclerotic mice. The results of qRT-PCR and western blot analysis revealed that miR-224-3p expression was significantly upregulated, while FOSL2 expression was downregulated, and HDAC1 and HIF1α expression was unaffected in aortic tissues of ND-fed mice injected with miR-224-3p compared with mice treated with NC. In aortic tissues of HFD-fed mice treated with NC, expression of miR-224-3p and HDAC1 was diminished, but that of FOSL2 and HIF1α was elevated when compared to that in aortic tissues of ND-fed mice treated with NC. Further delivery of miR-224-3p resulted in an increase of miR-224-3p expression and a decline of FOSL2 expression but had no effects on HDAC1 and HIF1α expression in aortic tissues of HFD-fed mice (Figures 7A and 7B). Hematoxylin and eosin (H&E) staining and oil red O staining confirmed successful induction of the model of severe atherosclerosis, characterized by significantly increased size of vascular lesions, as well as elevated lipid content. Of note, overexpression of miR-224-3p significantly alleviated atherosclerosis and reduced the tissue lipid content (Figures 7C and 7D; Figure S3A). The results of immunofluorescence assay and western blot analysis showed that expression of B cell lymphoma 2 (Bcl-2) was significantly downregulated in aortic tissues of mice fed with HFD, while expression of Bax, cleaved caspase-3, and cleaved-PARP were all significantly upregulated. In contrast, overexpression of miR-224-3p effectively reversed this effect (Figure 7E; Figure S3B). Results from ELISA showed that serum levels of TNF-α, IL-1β, and IL-6 were all increased in mice fed with HFD, while overexpression of miR-224-3p effectively reversed these effects (Figure 7F). Therefore, the above results suggest that overexpression of miR-224-3p can alleviate atherosclerosis in mice in vivo.
Figure 7.

miR-224-3p upregulation alleviates atherosclerosis in mice
(A) The expression of HDAC1, HIF1α, miR-224-3p, and FOSL2 in the aortic tissues of mice as determined by qRT-PCR (n = 10). (B) The HDAC1, HIF1α, and FOSL2 levels in the aortic tissues of mice as determined by western blot analysis, normalized to GAPDH (n = 10). (C) Oil red O staining for ApoE−/− mouse aortic tissues (n = 10). (D) Quantitative observation of aortic lesions (n = 10). (E) Protein expression of Bcl-2, Bax, cleaved-caspase 3, and cleaved-PARP determined by western blot analysis in mouse aortic tissues. (F) The levels of TNF-α, IL-1β, and IL-6 in the serum of mice (n = 10). ∗p < 0.05 versus the ND + NC group. #p < 0.05 versus the HFD + NC group. The experiment was repeated three times independently. H&E, hematoxylin and eosin; DAPI, 4′,6-diamidino-2-phenylindole; ND, normal diet; HFD, high-fat diet.
Discussion
Atherosclerosis is recognized as the most important underlying cause of adverse cardiovascular events.30,31 The vascular inflammation in ECs leads to endothelial dysfunction and atherosclerosis development through triggering of pro-inflammatory signaling pathways and by expediting macrophage infiltration.32 Interestingly, recent studies have highlighted the functional relevance of miRNAs during the formation of atherosclerotic lesions, which has drawn attention of miRNAs as candidate targets for cardiovascular disease treatment.33,34 Findings of the present study revealed that HDAC1 overexpression facilitated miR-224-3p-mediated inhibition of FOSL2 to suppress atherosclerosis by deacetylating HIF1α (Figure 8).
Figure 8.

HDAC1-mediated HIF1α deacetylation upregulated miR-224-3p to reduce ROS accumulation and EC apoptosis in atherosclerosis
There is a paucity of evidence demonstrating the differential expression and significant effects of miRNAs in atherosclerosis, but a general sense has been emerging that altering miRNA expression may present a new therapeutic option to prevent or alleviate atherosclerotic plaque formation and cardiovascular events.35 Results of the present study showed low expression of miR-224-3p in atherosclerotic samples and model cells. Likewise, miR-224-3p had poor expression in mouse neuroblastoma cells when oxygen and glucose are deprived in a model of reperfusion injury.36 Low expression of miR-224-3p can be predictive of poor prognosis of patients with osteosarcoma.37 Largely in agreement with present results, other miRNAs such as miR-99a-5p38 and miR-14639 are downregulated in atherosclerotic artery samples and may thus potentially diminish inflammation and vulnerable atherosclerotic plaque formation by inhibiting the transcription of their target genes. Atherosclerotic lesion formation and accumulation of pro-atherogenic lipoproteins occur in the present and other murine models of atherosclerosis.40, 41, 42 The current study demonstrated that overexpression of miR-224-3p significantly reduced plaque area, degree of artery lesion, and the lipid content in ApoE−/− mice, thus arresting the progression of atherosclerosis. Consistently, Xu et al.16 argued that miR-224 inhibition in a rat model contributed to increased blood lipid indexes and the formation of vulnerable atherosclerotic plaques in acute coronary syndrome through activation of the TGF-β/Smad pathway, suggesting another possible regulatory mechanism of miR-224 in atherosclerosis. However, the KEGG analysis in the present study did not indicate any enrichment of the TGF-β/Smad signaling pathway, so we did not explore the effects of the TGF-β/Smad signaling pathway in our model. Therefore, we argue that miR-224 restoration may suppress the formation of atherosclerotic lesions.
Endothelial dysfunction is involved in the atherogenic pathway,43 and the apoptosis of ECs is a notable finding in atherosclerosis.44 Additionally, we now showed that miR-224-3p upregulation inhibited apoptosis and ROS accumulation in ox-LDL-induced HAECs. Prior evidence demonstrates that miR-224-3p overexpression can alleviate cell apoptosis, cleaved caspase-3 expression, and ROS production in the context of cerebral ischemia reperfusion injury by targeting FIP200.36 miRNAs can interact with the 3′UTR of specific target mRNAs, resulting in the inhibition of mRNA degradation or translation.45 In this study, scrutiny of the biological prediction website and luciferase reporter assay results consistently identified that miR-224-3p bound to the 3′UTR of FOSL2 mRNA and could negatively regulate its expression. A previous study has indicated FOSL2 to be a key regulator of leptin expression in adipocytes, whereby its overexpression is positively associated with leptin levels.46 Importantly, leptin activation accelerated chronic oxidative stress in ECs, which consequently led to initiation of the atherogenic processes.47 In addition, a previous functional study has indicated the promoting action of FOSL2 for the formation of atherosclerotic plaques.18 Thus, the downregulation of FOSL2 induced by miR-224-3p overexpression possesses the ability to inhibit apoptosis and ROS accumulation in ox-LDL-induced HAECs. Additionally, ox-LDL causes increased production of inflammatory cytokines from ECs and monocytes, such as TNF-α, IL-1β, and IL-6, which result in lipid formation.48,49 Many studies have shown that anti-inflammatory treatment has positive effects on prevention of atherosclerosis.50,51 Overexpression of miR-224-5p can significantly inhibit the expression of TNF-α and IL-1β in the hippocampus following onset of type 2 diabetes mellitus in association with obstructive sleep apnea.52 Moreover, miR-224 suppresses airway epithelial cell inflammation in PM2.5-induced asthmatic mice due to its ability in reducing the expression of pro-inflammatory mediators transforming growth factor-β (TGF-β), MMP9, TIMP-1, and RORγt.53 These reports highlighted the protection from inflammation conferred by miR-224. Concordantly, present findings of reduced levels of TNF-α, IL-1β, and IL-6 suggest an anti-inflammatory action of miR-224-3p in the alleviation of atherosclerosis.
In a probe into the anti-inflammatory mechanism of miR-224-3p, we found that HIF1α downregulated the expression of miR-224-3p to facilitate cell apoptosis and ROS accumulation in ox-LDL-induced HAECs. The study of Shatrov and colleagues54 provided earlier evidence that ox-LDL, which is often employed in establishing atherosclerotic models, induces HIF1α expression in human macrophages. In the context of glioblastoma and astrocytoma, an inverse correlation between HIF1α and miR-224-3p expression has also been reported.22 Moreover, endothelial HIF1α upregulation augmented atherosclerosis by stimulating miR-19a-mediated CXCL1 expression, suggesting that inhibition of the endothelial HIF1α/miR-19a pathway may be an anti-atherosclerotic therapeutic strategy.55
More importantly, our mechanistic investigation revealed that HDAC1 induced HIF1α deacetylation to increase the expression of miR-224-3p, thereby abrogating cell apoptosis and ROS accumulation in ox-LDL-induced HAECs. Other evidence shows that the HIF1α/HDAC1 signaling pathway could influence the hypoxia-induced cell activities.56 In line with our findings, HDAC1 decreases HIF1α protein acetylation and stability.23 Moreover, HDACs and miRNAs are two key epigenetic factors essentially involved in pathogenesis, carcinogenesis, tumor promotion, and chemoresistance, and the crosstalk is closely associated with various human diseases, including cardiovascular diseases.57,58 Indeed, a previous study showed that HDAC1 upregulation could impede EC apoptosis in the context of atherosclerosis.21 In addition, Hyndman et al.59 documented that HDAC1 overexpression triggered deacetylation of nitric oxide synthase (NOS3) to diminish NOS3 expression, which was revealed to ameliorate endothelial dysfunction. These findings support our conclusion that the anti-atherosclerotic and endothelial-protective effects of miR-224-3p are achieved through HDAC1-dependent HIF1α deacetylation.
Finally, aiming to generalize our findings, we recapitulated the earlier results that HDAC1-mediated HIF1α deacetylation upregulated miR-224-3p to reduce ROS accumulation and EC apoptosis in atherosclerosis. These findings provide mechanistic insight of previously unrecognized roles of the HDAC1/HIF1α/miR-224-3p/FOSL2 axis in the progression of atherosclerosis. Thus, this study offers a fresh molecular insight that might guide the development of new targeted therapies for atherosclerosis and other cardiovascular diseases. However, the lesions from the ApoE−/− mouse model differ distinctly from those occurring in humans, such that future studies are warranted using other animal models, such as LDL receptor-deficient mice, for the in-depth analysis of the established signaling axis in atherosclerosis so as to validate these findings and expand the translational potential of this direction. In addition, the role of miR-224-3p was detected only in experiments following 12 weeks of HFD; the precise function of the HIF-1α/miR-224-3p/FOSL2 axis in intervention and treatment of atherosclerosis still needs to be further explored with 24- to 36-week experiments.
Materials and methods
Ethics statement
The study was implemented with the ratification from the Ethics Committee of The First Affiliated Hospital of Jinan University. Informed written consent was obtained from each participating subject prior to sample collection. Animal experiments were approved by the local Institution of Animal Care and Use Committee of The First Affiliated Hospital of Jinan University and implemented following the Guide for the Care and Use of Laboratory Animals, published by US National Institutes of Health (NIH publication no. 85-23, revised 2011).
Sample collection
The atherosclerotic lesion tissues were attained from 62 patients who had undergone carotid/femoral artery endarterectomy, and the normal arterial tissues were obtained from 62 healthy adult entities abnormally dying without evidence of atherosclerosis within 3 h after death at the First Affiliated Hospital of Jinan University. The demographic information of patients is shown in Table 1. All tissues were immediately stored in liquid nitrogen for subsequent experimentation.
Table 1.
Clinical parameters of patients with atherosclerosis
| Parameters | Control | Atherosclerosis |
|---|---|---|
| Number | 62 | 62 |
| Sex (female, %) | 47 | 44 |
| Age | 60.29 ± 9.69 | 62.16 ± 11.59 |
| Total cholesterol (mmol/L) | 3.48 ± 0.88 | 5.68 ± 0.67∗ |
| LDL-C (mmol/L) | 2.38 ± 0.45 | 2.59 ± 0.42 |
| HDL-C (mmol/L) | 1.72 ± 0.39 | 1.91 ± 0.47 |
| TG (mmol/L) | 1.50 ± 0.28 | 2.15 ± 0.38∗ |
| Creatinine (mg/dL) | 1.05 ± 0.27 | 1.24 ± 0.16 |
The data are expressed as mean ± SD. Data between two groups were compared using independent sample t test. LDL-C, low-density lipoprotein cholesterol; HDL-C, high-density lipoprotein cholesterol; TG, triglyceride. ∗p < 0.05 versus healthy controls.
Cell treatment
Culture of HAEC lines (American Type Culture Collection, Manassas, VA, USA) was implemented with vascular cell basal medium (GIBCO Company, Grand Island, NY, USA) containing 10% fetal bovine serum, 100 mg/mL streptomycin, and 100 U/mL penicillin with 5% CO2 at 37°C.60 A cell model of atherosclerosis was constructed by inducing cells in a medium encompassing 50 μg/mL ox-LDL for 24 h. During the transfection, the cells were cultured in a 6-well plate until reaching 80% confluence, whereupon serum-free medium was used to renew the previous medium. The transfection was implemented as per the manuals of the Lipofectamine 2000 reagent kit (Invitrogen, Carlsbad, CA, USA). Except for the blank group, which did not receive ox-LDL induction or transfection, and the ox-LDL group without plasmid transfection, the ox-LDL-induced cells were respectively transfected with miR mimic or miR inhibitor of miR-224-3p; NC mimic; NC inhibitor; overexpression vector of FOSL2 (oe-FOSL2), HDAC1 (oe-HDAC1), or HIF1α (oe-HIF1α); oe-NC; and siRNA against HIF1α (si-HIF1α) and NC (si-NC). After transfection, the cells were cultured for 48 h. The plasmids used were purchased from GenePharma (Shanghai, P.R. China).21 Sequences of all plasmids used for transfection are shown in Table 2.
Table 2.
Sequences for transfection
| Sequence | |
|---|---|
| miR-224-3p mimic | 5′-AAAAUGGUGCCCUAGUGACUACA-3′ |
| miR-224-3p inhibitor | 5′-UGAAGUCACUAGGGCACCAUUUU-3′ |
| NC mimic | 5′-UUCUCCGAACGUGUCACGUTT-3′ |
| NC inhibitor | 5′-CAGUACUUUUGUGUAGUACAA-3′ |
| si-NC | 5′-ACUAGACUUUGCAUUGCGA-3′ |
| si-HIF1α | 5′-UACUGUUCCUGAGGAAGAA-3′ |
miR, microRNA; NC, negative control; HIF1α, hypoxia-inducible factor-1α.
qRT-PCR
Total RNA isolation from HAECs in response to different treatments was implemented using TRIzol reagents (Invitrogen). The primers of HIF1α/miR-224-3p/FOSL2 were synthesized by Invitrogen (Table 3). cDNA was generated from total RNA with TaqMan MicroRNA Reverse Transcription Kit (4366596, Thermo Fisher Scientific, Waltham, MA, USA) and High-Capacity cDNA Reverse Transcription Kit (4368813, Thermo Fisher Scientific). With glyceraldehyde-3-phosphate dehydrogenase (GAPDH) and U6 (both purchased from Invitrogen) serving as normalizers for mRNA and miRNA amplifications, respectively, qRT-PCR was conducted on a qPCR detection device (ABI7500, Thermo Fisher Scientific) following the protocols in the SYBR PremixExTaqTMII (TliRNaseH Plus) kit (DR820A, Takara Bio, Otsu, Shiga, Japan). The PCR solution was mixed by triturating the bottom of the tube, followed by brief centrifugation at 5,000 rpm. The PCR solution was then loaded into a real-time fluorescence qPCR detection device (ABI, Foster City, CA, USA) for PCR analysis. Finally, fold changes in gene expression were calculated by the 2−ΔΔCt relative quantification method.
Table 3.
Primer sequences for qRT-PCR
| Target | Primer sequence (5′–3′) |
|---|---|
| HDAC1 | F: CTACTACGACGGGGATGTTGG |
| R: GAGTCATGCGGATTCGGTGAG | |
| HIF1α | F: TAGCCGAGGAAGAACTATGAAC |
| R: CTGAGGTTGGTTACTGTTGGTA | |
| miR-224-3p | F: TGATGTGGGTGCTGGTGTC |
| R: TTGTGTTGGGGCAGTACTG | |
| FOSL2 | F: GCCAGCAGAAATTCCGGG |
| R: GGGTTGGACATGGAGGTGAT | |
| U6 | F: GCTTGCTTCAGCAGCACATA |
| R: AAAAACATGGAACTCTTCACG | |
| GAPDH | F: AGAAGGCTGGGGCTCATTTG |
| R: AGGGGCCATCCACAGTCTTC |
qRT-PCR, quantitative reverse-transcriptase polymerase chain reaction; HDAC1, histone deacetylase 1; HIF1α, hypoxia-inducible factor-1α; miR-224-3p, microRNA-224-3p; FOSL2, Fos-related antigen 2; GAPDH, glyceraldehyde-3-phosphate dehydrogenase; F, forward; R, reverse.
Western blot analysis
A radio-immunoprecipitation assay kit (R0010, Solarbio, Beijing, P.R. China) was applied for total protein isolation from HAECs, followed by protein concentration estimation using a bicinchoninic acid protein assay kit (Genebase, Guangzhou, P.R. China). Next, 40 μg of the protein was extracted from each sample, loaded, and then subjected to protein separation through sodium dodecyl sulfate-polyacrylamide gel electrophoresis. Afterward, the protein was transferred onto a polyvinylidene fluoride membrane (Merck Millipore, Billerica, MA, USA), which was then sealed with Tris-buffered saline-Tween 20 containing 5% bovine serum albumin. The overnight membrane incubation was implemented at 4°C with the following anti-rabbit primary antibodies against GAPDH (#5174, 1:1,000), HDAC1 (#34589, 1:1,000), HIF1α (#36169, 1:1,000), FOSL2 (HPA004817), Bcl-2 (ab182858, 1:2,000), Bax (ab182734, 1:1,000), cleaved caspase-3 (#9661, 1:1,000), caspase-3 (ab13847, 1:500), cleaved-PARP (#5625, 1:1,000), and PARP (ab74290, 1:1,000). The secondary goat anti-rabbit antibody against IgG (#150077, 1:1,000) was subsequently added to the membrane, followed by incubation at room temperature with gentle shaking. The antibody against FOSL2 was purchased from Sigma-Aldrich (St. Louis, MO, USA); the antibodies against GAPDH, HDAC1, HIF1α, cleaved caspase-3, and cleaved-PARP from Cell Signaling Technologies (CST, Beverly, MA, USA); and those against Bax, caspase-3, PARP, and IgG from Abcam (Cambridge, UK). The bands were developed using enhanced chemiluminescence. The ImageJ software was applied to analyze the gray value of each band. The ratio of gray value of the target protein band to that of the internal reference band was regarded as the relative protein expression.
ROS level determination
Total ROS kits (BioVision, Milpitas, CA, USA) were used to measure intracellular ROS levels according to the instructions. In brief, HAECs were incubated with 500 μL of ROS detection solution and stained for 30 min at 37°C in darkness. With the staining solution replaced by phosphate-buffered saline (PBS), a flow cytometer (BD Biosciences, Franklin Lakes, NJ, USA) was applied to analyze the samples.
CCK-8 assay
After transfection, adherent cells in the logarithmic growth phase were trypsinized to form a single-cell suspension. Subsequent to the adjusting of cell concentration to 5 × 10⁴ cells/mL, the cell suspension was incubated in a 96-well culture plate at 100 μL cells per well at 37°C with 5% CO2 for 24 and 48 h. Five duplicated wells were set for each group. One hour before termination of the incubation, 10 μL CCK-8 solution (Beyotime, Shanghai, P.R. China) was supplemented into each well of the plate and sufficiently mixed. After 1-h incubation, the optical density (OD) value at 450 nm was determined using a microplate reader (BD Biosciences), which represented the number of cells.
Flow cytometry
In this study, 48 h after transfection, medium used for each cell group in the culture plate was transferred to 5-mL conical tubes, which were then placed on ice. The cells in the culture plate were incubated with 0.5 mL of 0.25% trypsin until they began to fall off from the culture plate wall, followed by microscopic observation. The cells were completely removed from the culture plate wall by gentle and continuous trituration and then slightly re-suspended in the previously collected medium to reach a final concentration of about 1 × 10⁶ cells/mL. Next, 0.5 mL of the obtained cell suspension (5 × 10⁵ cells) was transferred from the cell culture plate to a clean centrifuge tube, followed by the addition of staining solution. The cells were then gently re-suspended with 0.5 mL of precooled 1 × binding buffer and incubated with 5 μL Annexin V-fluorescein isothiocyanate and 10 μL propidium iodide for 15 min, in the absence of light. Finally, the cells were analyzed using a flow cytometer (BD Biosciences). The above reagents were all purchased from Beyotime.
ELISA
The mouse whole blood was attained and centrifuged at 3,000 rpm at room temperature for 30 min to separate the serum. The serum concentrations of TNF-α, IL-1β, and IL-6 were determined based on the instructions of the following detection kits: mouse TNF-α ELISA kit (ab208348), mouse IL-1β ELISA kit (ab100704), and mouse IL-6 ELISA kit (ab100712). A microplate reader (BioTek, Winooski, VT, USA) was employed to measure the OD value at 450 nm, and the Origin 9.5 software was used for analysis. The expression of TNF-α, IL-1β, and IL-6 in the supernatant of HAECs was examined using ELISA. Here, the kits used were human TNF-α ELISA kit (ab181421), human IL-1β ELISA kit (ab46052), and human IL-6 ELISA kit (ab178013).
Dual luciferase reporter gene assay
We predicted the downstream target genes of miR-224-3p through interrogation of the starBase database (http://starbase.sysu.edu.cn/), and KEGG enrichment analysis was carried out for the predicted results by using the “cluster profiler” package of R language. The signaling pathways related to FOSL2 were predicted through the KEGG database (https://www.kegg.jp/kegg/pathway.html). The information regarding the binding between miRNA and FOSL2 was retrieved from the TargetScan database (http://www.targetscan.org/vert_71/). Whether FOSL2 was a direct target of miR-224-3p was verified by dual luciferase reporter gene assay. Artificially synthesized human or mouse FOSL2-3′UTR-WT gene fragments were introduced into pMIR-reporter (Huayueyang Biotechnology, Beijing, P.R. China) using endonuclease sites SpeI and Hind III. Complementary sequence mutation sites were designed on the basis of FOSL2-3′UTR-WT. After restriction endonuclease digestion, the target fragments were inserted into pMIR-reporter plasmids using the T4 DNA ligase. The correctly sequenced luciferase reporter plasmids WT and MUT were co-transfected into HEK293T cells (Shanghai Beinuo Biological Technology, Shanghai, P.R. China) along with mimic or NC-mimic, respectively. After 48 h, the cells were lysed. A Glomax 20/20 luminometer (Promega, Madison, WI, USA) was adopted to examine luciferase activity, which was calculated based on the following formula: luciferase activity = luciferase activity of firefly/luciferase activity of Renilla. Meanwhile, dual luciferase reporter gene assay was also performed to verify whether miR-224-3p was indeed a direct target of HIF1α. The murine miR-224-3p promoter (WT) gene fragment was artificially synthesized, and its complementary sequence sites (MUT) were designed based on the miR-224-3p WT promoter. Following restriction endonuclease digestion, the target fragments were inserted into pMIR-reporter plasmids using the T4 DNA ligase. The correctly sequenced luciferase reporter plasmids WT and MUT were co-transfected into HEK293T cells (Shanghai Beinuo Biological Technology) with oe-HIF1α or oe-NC, respectively, for 48 h. Subsequent to cell lysing, the luciferase activity was measured using Glomax 20/20 luminometer (Promega) on a dual luciferase system and expressed as the ratio of firefly luciferase activity to Renilla luciferase activity.
CoIP
HEK293T cells were transfected with plasmids expressing Flag-HIF1α and HA-HDAC1 and then cultured for 48 h. IP was purified with a Flag antibody. Meanwhile, HDAC1 was overexpressed in HEK293T cells. The precipitates were rinsed with pre-lysis buffer and examined by western blot analysis.23 The antibodies used for western blot analysis and IP were as follows: HDAC1 (#34589, CST), Flag (A4596, Merck Millipore), acyl lysine (SAB520090-100UG, Sigma-Aldrich), and HA (05-904, Sigma-Aldrich).
An animal model establishment
Forty male ApoE−/− mice (weighing 20 ± 2 g and aged 6 ± 1 weeks old) were obtained from Vital River (Beijing, P.R. China) and randomly assigned into four groups with ten mice in each group: ND + NC group (ND + transfection with NC agomir), ND + miR-224-3p group (ND + transfection with miR-224-3p agomir), HFD + NC group (HFD + transfection with NC agomir), HFD + miR-224-3p group (HFD + transfection with miR-224-3p agomir). Agomir-NC and miR-224-3p agomir were respectively mixed with Invivofectamine 3.0 reagent (Thermo Fisher Scientific), and the mixtures were then injected into mice via tail vein at a dose of 7 mg/kg/day, once a day for 10 consecutive days.61 After 12 weeks of feeding, mice were euthanized with 3% pentobarbital (intraperitoneally) following 12 h of fasting, during which time they had free access to water. Before euthanasia, whole blood was collected for determination of inflammatory factors while the aorta was harvested after euthanasia for the subsequent experiments.
H&E staining
After mice were euthanized, PBS was perfused via the left ventricle. Subsequently, aortas were separated from brachiocephalic trunks, fixed by immersion in 4% paraformaldehyde, dehydrated, and embedded in paraffin for sectioning. The prepared paraffin sections were dewaxed using xylene I and xylene II and hydrated with gradient alcohol series (5 min for each). Following a 2-min rinse with water, the sections were stained with hematoxylin for 8 min, differentiated with 1% hydrochloric acid alcohol for 5 s, and then blued in 0.25% ammonia water for 1 min. Following three rinses with water, 2 min each, the sections were stained with eosin for 30 s and treated with gradient alcohol, xylene I, and xylene II, for 3 min each. The sections were transferred to a slide, and after the xylene was completely dried, the slides were sealed with neutral gum. Finally, the pathological changes of blood vessels were observed under a microscope (Leica M205C, Carl Zeiss, Jena, Germany).
Oil red O staining
To observe the extent of intravascular lesions in the aortic roots, 0.5% oil red O (Sigma-Aldrich) and hematoxylin (Servicebio, Wuhan, Hubei, P.R. China) were used to stain the transverse sections (10 μm) for 30 min and 20 s, respectively. Next, the sections were immediately washed under running water for 2 min. Representative microscopic images of the lesions were obtained with a Leica microscope (Leica MD2500, Carl Zeiss). The images were analyzed using the Image-Pro Plus software (version: 6.0, Media Cybernetics, Silver Spring, MD, USA). All aortas were longitudinally sliced and then stained with oil red O for 3 h. Next, the stained aortas were immersed in 75% alcohol until the undamaged artery walls were cleared. Images of typical lesions were recorded under a Leica microscope (Leica M205C, Carl Zeiss) and analyzed using the Image-Pro Plus software.62
Immunofluorescence assay
Aortic roots were fixed with 4% paraformaldehyde, then embedded in an Oligonucleotide (OCT)complex (Sakura Finetek USA, Torrance, CA, USA), and transversely cut into 6-μm sections. Immunofluorescence assay was performed to stain the aortic roots, in which the Bcl-2 (ab182858), Bax (ab32503), cleaved caspase-3 (#9661, Rabbit), and cleaved-PARP (#5625, Rabbit) were observed. Afterward, ECs were localized using antibody against CD31 (ab28364). The images were captured under a confocal laser scanning microscope (FV300, Olympus, Tokyo, Japan).63 Bcl-2, Bax, and CD31 used in this experiment were purchased from Abcam, while cleaved-caspase-3 and cleaved-PARP were from CST.
Statistical analysis
All statistical data were processed using SPSS 21.0 statistical software (IBM SPSS Statistics, Chicago, IL, USA). Measurement data were expressed as mean ± SD. Data between two groups were compared using independent sample t test. Comparisons among multiple groups were conducted using one-way analysis of variance (ANOVA) with Tukey’s post hoc test. Statistical analysis in relation to time-based measurements within each group was performed with repeated-measures ANOVA, followed by Bonferroni’s post hoc test. The relationship between two indices was analyzed using Pearson’s correlation coefficient. A value of p <0.05 was indicative of significant difference.
Acknowledgments
The authors would like to thank Prof. Takaki Hiwasa (Department of Biochemistry and Genetics, Graduate School of Medicine, Chiba University) for valuable discussion and suggestions. This work was supported in part by the Natural Science Foundation of Guangdong Province, China (grant no. 2018A0303131003), the Medical Science and Technology Research Fund of Guangdong Province, China (grant no. A2019550), and the Science and Technology Planning Project of Guangzhou, China (grant no. 201707010449).
Author contributions
H.W., H.Y.Y., and D.Y. designed the study and experiments. H.L. and Y.B.S. were involved in data collection and conducted the experiments. S.S., W.Y.Y., and K.S. performed the statistical analysis and preparation of figures. J.Y.L. and T.Y.Z. drafted the paper. All authors read and approved the final manuscript.
Declaration of interests
The authors declare no competing interests.
Footnotes
Supplemental Information can be found online at https://doi.org/10.1016/j.omtn.2020.10.044.
Supplemental Information
References
- 1.Lusis A.J. Atherosclerosis. Nature. 2000;407:233–241. doi: 10.1038/35025203. [DOI] [PMC free article] [PubMed] [Google Scholar]
- 2.Lee Y.T., Lin H.Y., Chan Y.W., Li K.H., To O.T., Yan B.P., Liu T., Li G., Wong W.T., Keung W., Tse G. Mouse models of atherosclerosis: a historical perspective and recent advances. Lipids Health Dis. 2017;16:12. doi: 10.1186/s12944-016-0402-5. [DOI] [PMC free article] [PubMed] [Google Scholar]
- 3.Chaudhury H., Zakkar M., Boyle J., Cuhlmann S., van der Heiden K., Luong A., Davis J., Platt A., Mason J.C., Krams R. c-Jun N-terminal kinase primes endothelial cells at atheroprone sites for apoptosis. Arterioscler. Thromb. Vasc. Biol. 2010;30:546–553. doi: 10.1161/ATVBAHA.109.201368. [DOI] [PubMed] [Google Scholar]
- 4.Li Y., Yang C., Zhang L., Yang P. MicroRNA-210 induces endothelial cell apoptosis by directly targeting PDK1 in the setting of atherosclerosis. Cell. Mol. Biol. Lett. 2017;22:3. doi: 10.1186/s11658-017-0033-5. [DOI] [PMC free article] [PubMed] [Google Scholar]
- 5.Li Y., Yang N., Dong B., Yang J., Kou L., Qin Q. MicroRNA-122 promotes endothelial cell apoptosis by targeting XIAP: Therapeutic implication for atherosclerosis. Life Sci. 2019;232:116590. doi: 10.1016/j.lfs.2019.116590. [DOI] [PubMed] [Google Scholar]
- 6.Mundi S., Massaro M., Scoditti E., Carluccio M.A., van Hinsbergh V.W.M., Iruela-Arispe M.L., De Caterina R. Endothelial permeability, LDL deposition, and cardiovascular risk factors-a review. Cardiovasc. Res. 2018;114:35–52. doi: 10.1093/cvr/cvx226. [DOI] [PMC free article] [PubMed] [Google Scholar]
- 7.Leong X.F., Ng C.Y., Jaarin K. Animal Models in Cardiovascular Research: Hypertension and Atherosclerosis. BioMed Res. Int. 2015;2015:528757. doi: 10.1155/2015/528757. [DOI] [PMC free article] [PubMed] [Google Scholar]
- 8.Desvignes T., Loher P., Eilbeck K., Ma J., Urgese G., Fromm B., Sydes J., Aparicio-Puerta E., Barrera V., Espin R. Unification of miRNA and isomiR research: the mirGFF3 format and the mirtop API. Bioinformatics. 2019;36:698–703. doi: 10.1093/bioinformatics/btz675. [DOI] [PMC free article] [PubMed] [Google Scholar]
- 9.Tajbakhsh A., Bianconi V., Pirro M., Gheibi Hayat S.M., Johnston T.P., Sahebkar A. Efferocytosis and Atherosclerosis: Regulation of Phagocyte Function by MicroRNAs. Trends Endocrinol. Metab. 2019;30:672–683. doi: 10.1016/j.tem.2019.07.006. [DOI] [PubMed] [Google Scholar]
- 10.Fasolo F., Di Gregoli K., Maegdefessel L., Johnson J.L. Non-coding RNAs in cardiovascular cell biology and atherosclerosis. Cardiovasc. Res. 2019;115:1732–1756. doi: 10.1093/cvr/cvz203. [DOI] [PMC free article] [PubMed] [Google Scholar]
- 11.Stojkovic S., Nossent A.Y., Haller P., Jäger B., Vargas K.G., Wojta J., Huber K. MicroRNAs as Regulators and Biomarkers of Platelet Function and Activity in Coronary Artery Disease. Thromb. Haemost. 2019;119:1563–1572. doi: 10.1055/s-0039-1693702. [DOI] [PubMed] [Google Scholar]
- 12.Dai Y., Wu X., Dai D., Li J., Mehta J.L. MicroRNA-98 regulates foam cell formation and lipid accumulation through repression of LOX-1. Redox Biol. 2018;16:255–262. doi: 10.1016/j.redox.2018.03.003. [DOI] [PMC free article] [PubMed] [Google Scholar]
- 13.Alexandru N., Andrei E., Safciuc F., Dragan E., Balahura A.M., Badila E., Georgescu A. Intravenous Administration of Allogenic Cell-Derived Microvesicles of Healthy Origins Defend Against Atherosclerotic Cardiovascular Disease Development by a Direct Action on Endothelial Progenitor Cells. Cells. 2020;9:423. doi: 10.3390/cells9020423. [DOI] [PMC free article] [PubMed] [Google Scholar]
- 14.Qiao X.R., Wang L., Liu M., Tian Y., Chen T. MiR-210-3p attenuates lipid accumulation and inflammation in atherosclerosis by repressing IGF2. Biosci. Biotechnol. Biochem. 2020;84:321–329. doi: 10.1080/09168451.2019.1685370. [DOI] [PubMed] [Google Scholar]
- 15.Shen B., Pan Q., Yang Y., Gao Y., Liu X., Li W., Han Y., Yuan X., Qu Y., Zhao Z. miR-224 Affects Mammary Epithelial Cell Apoptosis and Triglyceride Production by Downregulating ACADM and ALDH2 Genes. DNA Cell Biol. 2017;36:26–33. doi: 10.1089/dna.2016.3540. [DOI] [PubMed] [Google Scholar]
- 16.Xu H.M., Sui F.H., Sun M.H., Guo G.L. Downregulated microRNA-224 aggravates vulnerable atherosclerotic plaques and vascular remodeling in acute coronary syndrome through activation of the TGF-β/Smad pathway. J. Cell. Physiol. 2019;234:2537–2551. doi: 10.1002/jcp.26945. [DOI] [PubMed] [Google Scholar]
- 17.Miller C.L., Haas U., Diaz R., Leeper N.J., Kundu R.K., Patlolla B., Assimes T.L., Kaiser F.J., Perisic L., Hedin U. Coronary heart disease-associated variation in TCF21 disrupts a miR-224 binding site and miRNA-mediated regulation. PLoS Genet. 2014;10:e1004263. doi: 10.1371/journal.pgen.1004263. [DOI] [PMC free article] [PubMed] [Google Scholar]
- 18.Drosos I., Chalikias G., Pavlaki M., Kareli D., Epitropou G., Bougioukas G., Mikroulis D., Konstantinou F., Giatromanolaki A., Ritis K. Differences between perivascular adipose tissue surrounding the heart and the internal mammary artery: possible role for the leptin-inflammation-fibrosis-hypoxia axis. Clin. Res. Cardiol. 2016;105:887–900. doi: 10.1007/s00392-016-0996-7. [DOI] [PubMed] [Google Scholar]
- 19.Wang Y., Toh H.C., Chow P., Chung A.Y., Meyers D.J., Cole P.A., Ooi L.L., Lee C.G. MicroRNA-224 is up-regulated in hepatocellular carcinoma through epigenetic mechanisms. FASEB J. 2012;26:3032–3041. doi: 10.1096/fj.11-201855. [DOI] [PMC free article] [PubMed] [Google Scholar]
- 20.Kim S.H., Jeong J.W., Park J.A., Lee J.W., Seo J.H., Jung B.K., Bae M.K., Kim K.W. Regulation of the HIF-1alpha stability by histone deacetylases. Oncol. Rep. 2007;17:647–651. [PubMed] [Google Scholar]
- 21.Li Y., Zhang K., Mao W. Inhibition of miR-34a prevents endothelial cell apoptosis by directly targeting HDAC1 in the setting of atherosclerosis. Mol. Med. Rep. 2018;17:4645–4650. doi: 10.3892/mmr.2018.8411. [DOI] [PubMed] [Google Scholar]
- 22.Huang S., Qi P., Zhang T., Li F., He X. The HIF-1α/miR-224-3p/ATG5 axis affects cell mobility and chemosensitivity by regulating hypoxia-induced protective autophagy in glioblastoma and astrocytoma. Oncol. Rep. 2019;41:1759–1768. doi: 10.3892/or.2018.6929. [DOI] [PubMed] [Google Scholar]
- 23.Geng H., Liu Q., Xue C., David L.L., Beer T.M., Thomas G.V., Dai M.S., Qian D.Z. HIF1α protein stability is increased by acetylation at lysine 709. J. Biol. Chem. 2012;287:35496–35505. doi: 10.1074/jbc.M112.400697. [DOI] [PMC free article] [PubMed] [Google Scholar]
- 24.Shen D., Zhao D., Yang X., Zhang J., He H., Yu C. Geniposide against atherosclerosis by inhibiting the formation of foam cell and lowering reverse lipid transport via p38/MAPK signaling pathways. Eur. J. Pharmacol. 2019;864:172728. doi: 10.1016/j.ejphar.2019.172728. [DOI] [PubMed] [Google Scholar]
- 25.He K., Sun H., Zhang J., Zheng R., Gu J., Luo M., Shao Y. Rab7-mediated autophagy regulates phenotypic transformation and behavior of smooth muscle cells via the Ras/Raf/MEK/ERK signaling pathway in human aortic dissection. Mol. Med. Rep. 2019;19:3105–3113. doi: 10.3892/mmr.2019.9955. [DOI] [PMC free article] [PubMed] [Google Scholar]
- 26.Feng S., Bowden N., Fragiadaki M., Souilhol C., Hsiao S., Mahmoud M., Allen S., Pirri D., Ayllon B.T., Akhtar S. Mechanical Activation of Hypoxia-Inducible Factor 1α Drives Endothelial Dysfunction at Atheroprone Sites. Arterioscler. Thromb. Vasc. Biol. 2017;37:2087–2101. doi: 10.1161/ATVBAHA.117.309249. [DOI] [PMC free article] [PubMed] [Google Scholar]
- 27.Guo L., Akahori H., Harari E., Smith S.L., Polavarapu R., Karmali V., Otsuka F., Gannon R.L., Braumann R.E., Dickinson M.H. CD163+ macrophages promote angiogenesis and vascular permeability accompanied by inflammation in atherosclerosis. J. Clin. Invest. 2018;128:1106–1124. doi: 10.1172/JCI93025. [DOI] [PMC free article] [PubMed] [Google Scholar]
- 28.Yang D., Yang Z., Chen L., Kuang D., Zou Y., Li J., Deng X., Luo S., Luo J., He J. Dihydromyricetin increases endothelial nitric oxide production and inhibits atherosclerosis through microRNA-21 in apolipoprotein E-deficient mice. J. Cell. Mol. Med. 2020;24:5911–5925. doi: 10.1111/jcmm.15278. [DOI] [PMC free article] [PubMed] [Google Scholar]
- 29.Steinmetz M., Laurans L., Nordsiek S., Weiß L., van der Veken B., Ponnuswamy P., Esposito B., Vandestienne M., Giraud A., Göbbel C. Thymic stromal lymphopoietin is a key cytokine for the immunomodulation of atherogenesis with Freund’s adjuvant. J. Cell. Mol. Med. 2020;24:5731–5739. doi: 10.1111/jcmm.15235. [DOI] [PMC free article] [PubMed] [Google Scholar]
- 30.Poston R.N. Atherosclerosis: integration of its pathogenesis as a self-perpetuating propagating inflammation: a review. Cardiovasc. Endocrinol. Metab. 2019;8:51–61. doi: 10.1097/XCE.0000000000000172. [DOI] [PMC free article] [PubMed] [Google Scholar]
- 31.Gisterå A., Hansson G.K. The immunology of atherosclerosis. Nat. Rev. Nephrol. 2017;13:368–380. doi: 10.1038/nrneph.2017.51. [DOI] [PubMed] [Google Scholar]
- 32.Horio E., Kadomatsu T., Miyata K., Arai Y., Hosokawa K., Doi Y., Ninomiya T., Horiguchi H., Endo M., Tabata M. Role of endothelial cell-derived angptl2 in vascular inflammation leading to endothelial dysfunction and atherosclerosis progression. Arterioscler. Thromb. Vasc. Biol. 2014;34:790–800. doi: 10.1161/ATVBAHA.113.303116. [DOI] [PubMed] [Google Scholar]
- 33.Weber C., Schober A., Zernecke A. MicroRNAs in arterial remodelling, inflammation and atherosclerosis. Curr. Drug Targets. 2010;11:950–956. doi: 10.2174/138945010791591377. [DOI] [PubMed] [Google Scholar]
- 34.Berkan Ö., Arslan S., Lalem T., Zhang L., Şahin N.O., Aydemir E.I., Korkmaz Ö., Eğilmez H.R., Çekin N., Devaux Y. Regulation of microRNAs in coronary atherosclerotic plaque. Epigenomics. 2019;11:1387–1397. doi: 10.2217/epi-2019-0036. [DOI] [PubMed] [Google Scholar]
- 35.Parahuleva M.S., Lipps C., Parviz B., Hölschermann H., Schieffer B., Schulz R., Euler G. MicroRNA expression profile of human advanced coronary atherosclerotic plaques. Sci. Rep. 2018;8:7823. doi: 10.1038/s41598-018-25690-4. [DOI] [PMC free article] [PubMed] [Google Scholar]
- 36.Deng Y., Ma G., Dong Q., Sun X., Liu L., Miao Z., Gao F. Overexpression of miR-224-3p alleviates apoptosis from cerebral ischemia reperfusion injury by targeting FIP200. J. Cell. Biochem. 2019;120:17151–17158. doi: 10.1002/jcb.28975. [DOI] [PubMed] [Google Scholar]
- 37.Xu R., Feng F., Yu X., Liu Z., Lao L. LncRNA SNHG4 promotes tumour growth by sponging miR-224-3p and predicts poor survival and recurrence in human osteosarcoma. Cell Prolif. 2018;51:e12515. doi: 10.1111/cpr.12515. [DOI] [PMC free article] [PubMed] [Google Scholar]
- 38.Han Z., Guan Y., Liu B., Lin Y., Yan Y., Wang H., Wang H., Jing B. MicroRNA-99a-5p alleviates atherosclerosis via regulating Homeobox A1. Life Sci. 2019;232:116664. doi: 10.1016/j.lfs.2019.116664. [DOI] [PubMed] [Google Scholar]
- 39.Desjarlais M., Dussault S., Rivard F., Harel S., Sanchez V., Hussain S.N.A., Rivard A. Forced expression of microRNA-146b reduces TRAF6-dependent inflammation and improves ischemia-induced neovascularization in hypercholesterolemic conditions. Atherosclerosis. 2019;289:73–84. doi: 10.1016/j.atherosclerosis.2019.08.010. [DOI] [PubMed] [Google Scholar]
- 40.Calara F., Silvestre M., Casanada F., Yuan N., Napoli C., Palinski W. Spontaneous plaque rupture and secondary thrombosis in apolipoprotein E-deficient and LDL receptor-deficient mice. J. Pathol. 2001;195:257–263. doi: 10.1002/path.915. [DOI] [PubMed] [Google Scholar]
- 41.Napoli C., Williams-Ignarro S., de Nigris F., Lerman L.O., D’Armiento F.P., Crimi E., Byrns R.E., Casamassimi A., Lanza A., Gombos F. Physical training and metabolic supplementation reduce spontaneous atherosclerotic plaque rupture and prolong survival in hypercholesterolemic mice. Proc. Natl. Acad. Sci. USA. 2006;103:10479–10484. doi: 10.1073/pnas.0602774103. [DOI] [PMC free article] [PubMed] [Google Scholar]
- 42.Joyce C.W., Wagner E.M., Basso F., Amar M.J., Freeman L.A., Shamburek R.D., Knapper C.L., Syed J., Wu J., Vaisman B.L. ABCA1 overexpression in the liver of LDLr-KO mice leads to accumulation of pro-atherogenic lipoproteins and enhanced atherosclerosis. J. Biol. Chem. 2006;281:33053–33065. doi: 10.1074/jbc.M604526200. [DOI] [PubMed] [Google Scholar]
- 43.Perticone F., Ceravolo R., Pujia A., Ventura G., Iacopino S., Scozzafava A., Ferraro A., Chello M., Mastroroberto P., Verdecchia P., Schillaci G. Prognostic significance of endothelial dysfunction in hypertensive patients. Circulation. 2001;104:191–196. doi: 10.1161/01.cir.104.2.191. [DOI] [PubMed] [Google Scholar]
- 44.Tricot O., Mallat Z., Heymes C., Belmin J., Lesèche G., Tedgui A. Relation between endothelial cell apoptosis and blood flow direction in human atherosclerotic plaques. Circulation. 2000;101:2450–2453. doi: 10.1161/01.cir.101.21.2450. [DOI] [PubMed] [Google Scholar]
- 45.Ivey K.N., Srivastava D. microRNAs as Developmental Regulators. Cold Spring Harb. Perspect. Biol. 2015;7:a008144. doi: 10.1101/cshperspect.a008144. [DOI] [PMC free article] [PubMed] [Google Scholar]
- 46.Wrann C.D., Eguchi J., Bozec A., Xu Z., Mikkelsen T., Gimble J., Nave H., Wagner E.F., Ong S.E., Rosen E.D. FOSL2 promotes leptin gene expression in human and mouse adipocytes. J. Clin. Invest. 2012;122:1010–1021. doi: 10.1172/JCI58431. [DOI] [PMC free article] [PubMed] [Google Scholar]
- 47.Bouloumie A., Marumo T., Lafontan M., Busse R. Leptin induces oxidative stress in human endothelial cells. FASEB J. 1999;13:1231–1238. [PubMed] [Google Scholar]
- 48.Ma J., Liu C., Yang Y., Yu J., Yang J., Yu S., Zhang J., Huang L. C/EBPβ Acts Upstream of NF-κB P65 Subunit in Ox-LDL-Induced IL-1β Production by Macrophages. Cell. Physiol. Biochem. 2018;48:1605–1615. doi: 10.1159/000492282. [DOI] [PubMed] [Google Scholar]
- 49.Brucker N., Moro A.M., Charão M.F., Durgante J., Freitas F., Baierle M., Nascimento S., Gauer B., Bulcão R.P., Bubols G.B. Biomarkers of occupational exposure to air pollution, inflammation and oxidative damage in taxi drivers. Sci. Total Environ. 2013;463-464:884–893. doi: 10.1016/j.scitotenv.2013.06.098. [DOI] [PubMed] [Google Scholar]
- 50.Wang Y., Li L., Zhao W., Dou Y., An H., Tao H., Xu X., Jia Y., Lu S., Zhang J., Hu H. Targeted Therapy of Atherosclerosis by a Broad-Spectrum Reactive Oxygen Species Scavenging Nanoparticle with Intrinsic Anti-inflammatory Activity. ACS Nano. 2018;12:8943–8960. doi: 10.1021/acsnano.8b02037. [DOI] [PubMed] [Google Scholar]
- 51.Wu G., Zhang J., Zhao Q., Zhuang W., Ding J., Zhang C., Gao H., Pang D.W., Pu K., Xie H.Y. Molecularly Engineered Macrophage-Derived Exosomes with Inflammation Tropism and Intrinsic Heme Biosynthesis for Atherosclerosis Treatment. Angew. Chem. Int. Ed. Engl. 2020;59:4068–4074. doi: 10.1002/anie.201913700. [DOI] [PubMed] [Google Scholar]
- 52.Du P., Wang J., Han Y., Feng J. Blocking the LncRNA MALAT1/miR-224-5p/NLRP3 Axis Inhibits the Hippocampal Inflammatory Response in T2DM With OSA. Front. Cell. Neurosci. 2020;14:97. doi: 10.3389/fncel.2020.00097. [DOI] [PMC free article] [PubMed] [Google Scholar]
- 53.Li P., Wang J., Guo F., Zheng B., Zhang X. A novel inhibitory role of microRNA-224 in particulate matter 2.5-induced asthmatic mice by inhibiting TLR2. J. Cell. Mol. Med. 2020;24:3040–3052. doi: 10.1111/jcmm.14940. [DOI] [PMC free article] [PubMed] [Google Scholar]
- 54.Shatrov V.A., Sumbayev V.V., Zhou J., Brüne B. Oxidized low-density lipoprotein (oxLDL) triggers hypoxia-inducible factor-1alpha (HIF-1alpha) accumulation via redox-dependent mechanisms. Blood. 2003;101:4847–4849. doi: 10.1182/blood-2002-09-2711. [DOI] [PubMed] [Google Scholar]
- 55.Akhtar S., Hartmann P., Karshovska E., Rinderknecht F.A., Subramanian P., Gremse F., Grommes J., Jacobs M., Kiessling F., Weber C. Endothelial Hypoxia-Inducible Factor-1α Promotes Atherosclerosis and Monocyte Recruitment by Upregulating MicroRNA-19a. Hypertension. 2015;66:1220–1226. doi: 10.1161/HYPERTENSIONAHA.115.05886. [DOI] [PubMed] [Google Scholar]
- 56.Lin C.W., Wang L.K., Wang S.P., Chang Y.L., Wu Y.Y., Chen H.Y., Hsiao T.H., Lai W.Y., Lu H.H., Chang Y.H. Daxx inhibits hypoxia-induced lung cancer cell metastasis by suppressing the HIF-1α/HDAC1/Slug axis. Nat. Commun. 2016;7:13867. doi: 10.1038/ncomms13867. [DOI] [PMC free article] [PubMed] [Google Scholar]
- 57.Klieser E., Urbas R., Swierczynski S., Stättner S., Primavesi F., Jäger T., Mayr C., Kiesslich T., Fazio P.D., Helm K., Neureiter D. HDAC-Linked “Proliferative” miRNA Expression Pattern in Pancreatic Neuroendocrine Tumors. Int. J. Mol. Sci. 2018;19:2781. doi: 10.3390/ijms19092781. [DOI] [PMC free article] [PubMed] [Google Scholar]
- 58.Renaud L., Harris L.G., Mani S.K., Kasiganesan H., Chou J.C., Baicu C.F., Van Laer A., Akerman A.W., Stroud R.E., Jones J.A. HDACs Regulate miR-133a Expression in Pressure Overload-Induced Cardiac Fibrosis. Circ. Heart Fail. 2015;8:1094–1104. doi: 10.1161/CIRCHEARTFAILURE.114.001781. [DOI] [PMC free article] [PubMed] [Google Scholar]
- 59.Hyndman K.A., Ho D.H., Sega M.F., Pollock J.S. Histone deacetylase 1 reduces NO production in endothelial cells via lysine deacetylation of NO synthase 3. Am. J. Physiol. Heart Circ. Physiol. 2014;307:H803–H809. doi: 10.1152/ajpheart.00243.2014. [DOI] [PMC free article] [PubMed] [Google Scholar]
- 60.Yin J., Hou X., Yang S. microRNA-338-3p promotes ox-LDL-induced endothelial cell injury through targeting BAMBI and activating TGF-β/Smad pathway. J. Cell. Physiol. 2019;234:11577–11586. doi: 10.1002/jcp.27814. [DOI] [PubMed] [Google Scholar]
- 61.Eguchi A., De Mollerat Du Jeu X., Johnson C.D., Nektaria A., Feldstein A.E. Liver Bid suppression for treatment of fibrosis associated with non-alcoholic steatohepatitis. J. Hepatol. 2016;64:699–707. doi: 10.1016/j.jhep.2015.11.002. [DOI] [PMC free article] [PubMed] [Google Scholar]
- 62.Liu Y., Wang X., Pang J., Zhang H., Luo J., Qian X., Chen Q., Ling W. Attenuation of Atherosclerosis by Protocatechuic Acid via Inhibition of M1 and Promotion of M2 Macrophage Polarization. J. Agric. Food Chem. 2019;67:807–818. doi: 10.1021/acs.jafc.8b05719. [DOI] [PubMed] [Google Scholar]
- 63.Zhang Y., Liu X., Bai X., Lin Y., Li Z., Fu J., Li M., Zhao T., Yang H., Xu R. Melatonin prevents endothelial cell pyroptosis via regulation of long noncoding RNA MEG3/miR-223/NLRP3 axis. J. Pineal Res. 2018;64 doi: 10.1111/jpi.12449. [DOI] [PubMed] [Google Scholar]
Associated Data
This section collects any data citations, data availability statements, or supplementary materials included in this article.