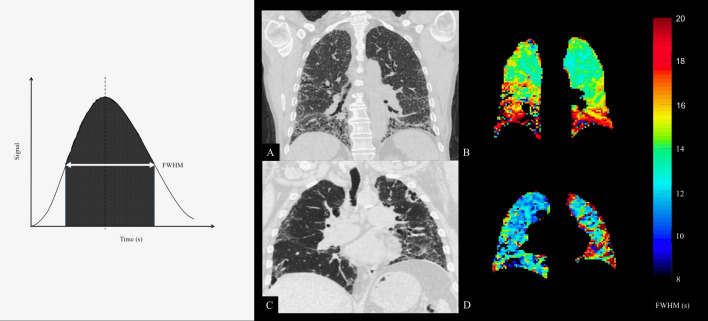
Figure 1.
Left panel: Example of signal change through a parenchymal region of interest. The full width at half-maximum (FWHM) signal is often used as a standard threshold for integration. Right panel: CT with best matching coronal slice mean transit time (FWHM) maps derived from dynamic contrast-enhanced MRI from two participants (A+B and C+D). Reticulation and honeycombing on the CT is related to regions of increased transit time in basal and peripheral regions. Colour bar denotes FWHM in seconds.

