

Abstract

We study the concentration and temperature dependence of the reorientation dynamics of water molecules in binary mixtures of water and 2,6-lutidine below the lower solution critical temperature (LSCT) with femtosecond mid-infrared pump–probe spectroscopy. The measurements reveal the presence of water molecules interacting with both the hydrophobic groups of lutidine and forming a hydrogen bond with the nitrogen atom of lutidine. Both types of molecules show a strongly decreased rotational mobility in comparison to bulk water. From the temperature dependence of the slow water fraction, we conclude that the lutidine molecules form clusters that decrease in size when the temperature is decreased further below the LSCT.
Introduction
Amphiphilic molecules contain both polar (hydrophilic) and apolar (hydrophobic) moieties, which lead to competitive behavior in aqueous solutions of these compounds. This competition drives the rearrangement of amphiphilic molecules in order to realize the interactions favorable for both the hydrophobic and hydrophilic parts. Macroscopically these rearrangements involve a delicate balance of the entropy and the enthalpy of the system, leading to the existence of critical phenomena such as phase separation. Depending on the chemical and physical parameters (composition, temperature, pressure, etc.), a homogeneous liquid mixture can thus reversibly separate into solute- and solvent-rich phases. This type of phase separation is ubiquitous and takes place in a broad range of systems. Recently, several studies have been reported on the role of liquid–liquid phase separations in drug delivery,1 living cell processes (including pathological),2,3 and atmospheric chemistry.4,5
The phase diagram of a liquid mixture in temperature (T)–solute mole fraction (X) coordinates represents whether the compounds are miscible or not. These phase diagrams can include both lower and higher solution critical temperatures, LSCT and HSCT, respectively. By definition, below the LSCT and above the HSCT, the compounds are fully miscible. While the existence of a HSCT is quite common for binary mixtures, the existence of an LSCT for aqueous solutions is limited to a few classes of organic molecules and polymers. Nevertheless, the aqueous solutions of compounds such as tetrahydrofuran, trimethylamine, and isobutyric acid, which are commonly used in organic synthesis, show an LSCT.6−8 Other examples include amphiphilic polymers and ionic liquids.9−11
Pyridine derivatives form a class of amphiphilic compounds, the solvation properties of which strongly differ from their nonpolar analogs. Homoarene benzene (C6H6) and the simplest heteroarene pyridine (C5H5N) differ only by the presence of a polar nitrogen atom in the structure of the latter instead of a =CH– group in the structure of the former. However, pyridine is miscible with water at any ratio at all temperatures,12 while benzene is only weakly soluble in water.13 Interestingly, that very subtle change in the molecular structure of the pyridine derivative may lead to a significant change of the phase diagram of its aqueous solution. Even a change of only the position of an alkyl substituent in the pyridine ring may significantly influence its mixing/demixing behavior.14−16 Overall a broad range of pyridine-like compounds, including natural alkaloid nicotine, show an LSCT in aqueous mixtures.17 The formation of OH...N hydrogen bonds favors miscibility and the hydrophobic interactions involving the weakly polar hydrocarbon core favor demixing.14,15,18 The aggregation of solute molecules driven by hydrophobic interactions can lead to the formation of molecular clusters with sizes up to several nanometers.16,19−21
A mixture of 2,6-lutidine (2,6-dimethylpyridine, lutidine) and water demonstrates a closed-loop phase diagram.22,23 In Figure 1, we show a part of the phase diagram of the 2,6-lutidine/water mixture near the LSCT. In this mixture, LSCT ≈ 307 K at X ≈ 0.062 and the composition range in which the compounds are immiscible is approximately 0.01 ≤ X ≤ 0.3 in between the LSCT and HSCT. Interestingly, the phase diagram also depends on the isotopic composition of the water molecules and the concentration of electrolytes, both illustrating a delicate competition of intermolecular interactions in the system.14,18,22,24 The study of the molecular properties of 2,6-lutidine/water mixtures is of strong general interest. These mixtures have recently been used in liquid templating of the aggregation of colloidal particles via bicontinous Pickering emulsion formation.25 A commercially important process dependent on the mixing properties with water is the transformation of alkyl pyridines to the corresponding N-oxides.26 It is also worth noticing that in spite of the simplicity of this system, the molecular structure of 2,6-lutidine is close to the structures of pyrimidine and purine nucleobases, which are present in the aqueous environment in living cells forming nucleic acids such as DNA and RNA.
Figure 1.

Phase diagram of 2,6-lutidine/water mixtures near the lower solution critical temperature (LSCT). The inset in the right bottom corner shows the structural formula of 2,6-lutidine, and the black, blue, and white spheres represent carbon, nitrogen, and hydrogen atoms, respectively.
In this work, we use polarization-resolved femtosecond infrared pump–probe spectroscopy to study the concentration and temperature dependence of the structural and dynamical properties of water molecules solvating 2,6-lutidine. This method has been successfully applied to the study of the hydration of small organic molecules27−29 and (bio)polymers.30−33 Because of the high sensitivity of molecular vibrations to their chemical environment, this technique is capable of providing unique information on the solvation structure. In our experiments, we observe different water species showing different reorientational dynamics and vibrational relaxation rates. We use the obtained results to explain the molecular events accompanying the phase separation of 2,6-lutidine/water mixtures near the LSCT.
Materials and Methods
We measured linear infrared absorption spectra with a commercial Bruker Vertex 80v Fourier-transform infrared spectrometer with a resolution of 2 cm–1. For the pump–probe experiments, we used a Ti/sapphire regenerative amplifier (Coherent) seeded by the output of a Ti/sapphire oscillator (Coherent). The system produces ∼35 fs 800 nm pulses with a pulse energy of ∼3.3 mJ at a repetition rate of 1 kHz. The output of the system was split ∼70/30 to pump two β-barium borate (BBO)-based optical parametric amplifiers (OPA) to generate the mid-infrared pump and probe pulses, respectively.
In the first (probe) OPA, a small fraction of the 800 nm light (∼1%) was used to generate white light continuum in a sapphire plate. This white light was used to seed an optical parametric amplification process in a BBO crystal that leads to the generation of signal (∼1400 nm) and idler (∼2100 nm) pulses. This process is pumped by another fraction of the 800 nm pulse. The signal pulse was further amplified in a second pass through the BBO crystal using the remaining fraction of the 800 nm as the pump. The amplified signal and regenerated idler pulses were used in a difference-frequency generation (DFG) process in an AgGaS2 (AGS) crystal. In this process, infrared pulses centered at 2500 cm–1 (4 μm) were generated with a pulse energy of ∼3.5 μJ. The second OPA was used to generate the pump pulse. The pump OPA and subsequent DFG stage produced pulses centered at 2500 cm–1 (4 μm) with a pulse energy of ∼20 μJ, with a pulse duration of ∼100 fs long, and a bandwidth of ∼140 cm–1 (FWHH).
The output of the first (probe) OPA was split into two beams using a ZnSe beam splitter. One of these beams (probe beam) was used to measure the pump-induced absorption changes (transient absorption, Δα), and the second (reference beam) was used to normalize the probe intensity to compensate for pulse-to-pulse power fluctuations. The probe beam was sent through a motorized delay stage to control the delay time between the pump and probe pulses.
The polarization of pump pulses was set at 45° with respect to that of the probe beam using a half-wave plate. The pump and probe beams were focused and overlapped at the same spot in the sample, and the probe light polarized parallel or perpendicular to that of the pump was selected with a polarizer behind the sample. After the sample, the probe and reference beams were recollimated and dispersed using a spectrometer and detected with a liquid nitrogen-cooled 3 × 32 pixels array mercury–cadmium–telluride detector. By mechanical chopping of every second pump pulse before the sample, we determined the pump-induced absorption change of the probe pulse. All spectra were corrected by the subtraction of a weak response at a relatively long negative delay time (−20 ps).
The transient absorption signals measured with the probe polarized parallel and perpendicular to that of the pump (Δα∥ and Δα⊥) are used to construct the rotation-free isotropic transient absorption (Δαiso) change:
| 1 |
where t represents the delay time and ω the frequency. The time dependence of this quantity is not affected by the orientation of the excited transition dipole moments and represents the vibrational relaxation and spectral diffusion. From the same Δα∥ and Δα⊥, the anisotropy (R) is constructed:
| 2 |
The dynamics of this parameter reflect the depolarization dynamics of the system caused by reorientation or heat diffusion.
2,6-Lutidine (redistilled, 99%+) was purchased from Sigma Aldrich and was used as received. Isotopically diluted water (HDO) was prepared by mixing deionized water (Millipore) with D2O (Sigma Aldrich, 99.9% D atoms) to achieve a 4 molar % solution of HDO in H2O. We find that the isotopic dilution of H2O by adding 2 molar % D2O does not significantly perturb the phase diagram of water–lutidine.
We measure the transient absorption changes of the OD stretch vibrations of the HDO molecules following the excitation of these vibrations. We use isotopically diluted water to avoid the measurements to be affected by intra- and intermolecular coupling of the water stretching modes.34 The samples were prepared by mixing appropriate volumes of isotopically diluted water and 2,6-lutidine. The samples were squeezed between two circular 2 mm thick CaF2 windows (Crystran) separated by 25–200 μm PTFE spacers. The width of the spacer was chosen such that the transmission of the sample was 50–60% at the maximum of the absorption of the OD stretch vibration. We also took care that the transient absorption change is 0.1 or less at the maximum of the absorption of the OD stretch vibration. We varied the solute fraction from 0.02 to 0.9. For solute fractions higher than 0.3, we used 4 mm thick CaF2 rectangular windows (Crystran), and we injected the mixtures with a syringe through a hole in one of the windows, since squeezing is complicated due to the high wettability of CaF2 by lutidine.
If not mentioned, the temperature of the sample was equal to 295 K. The phase separation temperatures were determined visually by slowly heating the mixtures in vials in a 0.5 L water bath, the temperature of which was controlled with a digital thermometer with a precision of 1 K. We used a home-built sample holder equipped with Peltier elements to perform transient absorption measurements at elevated or decreased temperatures. In these experiments, the temperature of the sample was controlled with the same digital thermometer and maintained using a thermal controller with a feedback loop.
Results
Concentration Dependence
Linear Infrared Absorption Spectra
In Figure 2, we present infrared absorption spectra of the 2,6-lutidine/water mixtures in the frequency region of the OD stretch vibration of HDO. The OD stretch absorption band of the HDO molecules overlaps with other bands assigned to H2O and lutidine. To accurately extract the OD stretch absorption band line shape from the raw linear infrared absorption spectrum, we performed a simple subtraction procedure described in the Supporting Information. Increasing the solute concentration leads to growth of a shoulder in the red wing of the spectrum. This shoulder indicates an increase of the fraction of water (HDO) molecules that form stronger hydrogen bonds than hydrogen bonds in liquid water. We assign this increasing low-frequency shoulder to the formation of OD...N hydrogen bonds; since the pyridine-type nitrogen atom of lutidine is a hydrogen-bond acceptor,16,18,35 2,6-lutidine acts as a weak base (conjugated acid pKa = 6.6) in the aqueous solutions.36
Figure 2.
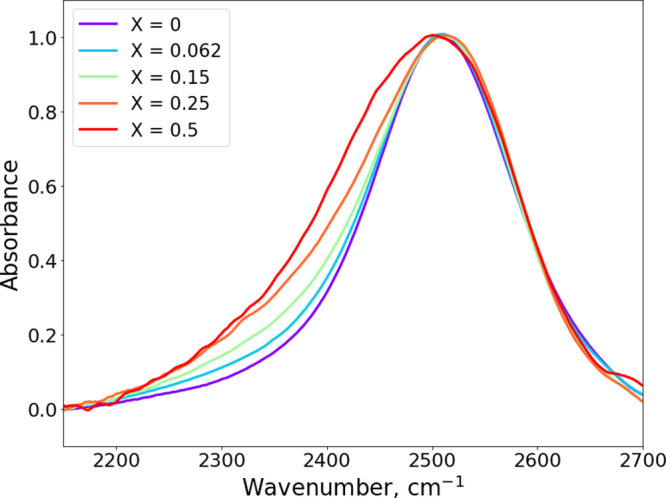
Linear absorption spectra corresponding to the OD stretch absorption band.
Isotropic Transient Absorption
In Figure 3, we present isotropic transient absorption spectra (Δαiso) for systems with solute fractions X = 0.02 and X = 0.3. At early delay times, a negative transient absorption signal around 2500 cm–1 is observed corresponding to the bleaching of the ground state and stimulated emission (v = 1 ↔ 0) of the OD stretch vibrations. The positive signal at lower frequencies corresponds to the induced v = 1 → 2 excited-state absorption. Due to vibrational energy relaxation, Δαiso decreases with delay time at all frequencies. At longer delay times, the transient spectrum looks similar to the thermal difference spectrum of the OD stretch absorption band (difference of the absorption spectra measured at room temperature and elevated temperature). However, although the spectral shape looks similar to a thermal difference spectrum, we observe ongoing dynamics of the amplitude of the transient absorption signal, even after a relatively long delay time of 9 ps. This type of long delay time dynamic has been observed before for solutions of organic molecules in water and indicates that the complete equilibration of the system is delayed with respect to the relaxation of the excited vibrational state.37,38 The long delay time dynamics may be due to a repositioning of the molecules in the solution, e.g., associated with a change of the size and distribution of clusters. No further signal evolution is observed after ∼25 ps delay time for all solute fractions, meaning that at those delay times, complete thermal equilibrium is reached within the excited volume.
Figure 3.

Isotropic transient absorption spectra for (A) X = 0.02 and (B) X = 0.3 lutidine/water mixtures. Points represent experimental values; solid lines represent the fit using the kinetic model described in the text.
A careful analysis of the transient spectra obtained for X > 0.062 reveals a blue-shift of the frequency position of the maximum of the transient absorption signal with the increasing delay time. This can be clearly seen by comparing for instance the signal at ≈ 0.4 ps and at 2 ps for X = 0.3 (Figure 3B). This observation implies that the vibrational relaxation rate (T1) is frequency-dependent for solutions with a higher solute fraction X.
To account for the frequency dependence of the relaxation rate, we apply a kinetic relaxation model in which two excited states relax to a common state, which we denote as the “local hot state” (see the following section). The relaxation dynamics are characterized by time constants T1r and T1b for the low-frequency component and the high-frequency component, respectively (Figure 4A). The initial populations of the two excited states were kept equal, and the spectral shapes (including the amplitudes) were varied without constraints. A similar model has been applied to the description of the vibrational energy relaxation dynamics in water/DMSO and the water/acetone mixtures.27 A more detailed description of the kinetic model can be found in ref27 and the Supporting Information.
Figure 4.

(A) Representation of the kinetic model applied for the description of the vibrational energy relaxation. (B) Spectral shapes of the two decomposed bands extracted from an unconstrained fit of the data of the X = 0.3 mixture. (C) Vibrational relaxation time constants as a function of the solute fraction X at 295 K. The time constants are extracted from the unconstrained fits; the dashed lines are guides to the eye.
We have applied this kinetic scheme to analyze the data obtained for all compositions. The two spectral shapes extracted from the fit for the X = 0.3 mixture are presented in Figure 4B. Both spectra possess bleaching and induced absorption signals. Figure 4C displays the time constants extracted from the fits for different mixtures. It is seen that the relaxation time constants increase with the increasing lutidine concentration. T1r increases from 1 ps at X = 0.02 to ∼2 ps at X = 0.75. T1b changes more significantly, from 2 ps at X = 0.02 to 5.3 ps at X = 0.75.
Anisotropy Dynamics
The transient absorption signal contains both contributions from the excited OD vibrations and a contribution of the state that is created after the relaxation, where the latter contributions will increase with the increasing delay time. In this, the final state has been denoted as the “hot ground state”, representing a state in which the excitation energy has thermally equilibrated over the excited volume. Hence, this state is expected to be isotropic. To determine the delay time dependence of the anisotropy of the signal of the excited OD oscillators, the observed total absorption signal has to be corrected for the response following the relaxation of these oscillators.27,30,37,39 In Figure 5A, it is seen that the assumption that the state created after the vibrational relaxation would be isotropic leads to significant differences between the curves calculated with the relaxation model (dashed lines) and the data. This assumption can even lead to a divergence of the corrected anisotropy (Figure S2). In Figure 5B, it is seen that for X ≥ 0.15, the anisotropy that is constructed directly from the measured Δα∥ and Δα⊥ does not completely relax even at delay times >9 ps. For X = 0.3 at 9 ps delay time, ≈20% of the initial anisotropy is conserved, while no more than 5% of the initial excited OD population is left, and the transient absorption signal is dominated by the end-level signal. Hence, we conclude that the state reached after the vibrational relaxation corresponds to an anisotropic distribution of relaxation-affected OD oscillators that is present long after the vibrational relaxation. This indicates that the energy that is dissipated in the vibrational relaxation primarily affects the originally excited OD oscillator, i.e., remains local. Since the spectral shape corresponding to this state is still very close to that of the thermal difference spectrum and only shows subtle amplitude dynamics, we denote this state as the local hot state.
Figure 5.

(A) Δα∥ and Δα⊥ dynamics for X = 0.3 at delay times >3 ps at the center of the bleach. The points represent the experimental results. The lines represent the fits obtained with the model described in the text. (B) Anisotropy dynamics measured for different concentrations of 2,6-lutidine at the center of the ground state bleach. All curves are normalized to the anisotropy value at 0.4 ps.
The transient absorption signal associated with the local hot state will be anisotropic when a few conditions are met. The first condition is that the reorientation of the water molecules should be slower than the vibrational relaxation; i.e., after the excitation energy is transferred into heat, the orientation of the originally excited molecule is not yet randomized. This condition is fulfilled for water molecules that slowly reorient due to their interaction with the hydrophobic or hydrophilic parts of the lutidine molecules. The reorientation of these molecules will also remain slow after the vibrational relaxation, i.e., when they give rise to the transient absorption signal of the local hot state. A second important condition for the local hot state to be anisotropic is that the heating effect following the relaxation of the OD vibration has very little effect on other OD vibrations that are not excited. This condition is fulfilled if the equilibration of heat between excited and nonexcited oscillators is slow, which will be the case if the OD oscillators are well separated and heat diffusion is not very fast. This second condition is largely fulfilled by the isotopic dilution of the sample, which implies that the concentration of OD groups is much lower than the overall water concentration in the mixture. The separation of the OD groups may be further enhanced as a result of clustering of the lutidine/water mixture, which implies that small clusters or monomers of water molecules are embedded by lutidine molecules and well separated from other water clusters.
To account for the anisotropy of the local hot state, we fit the experimentally observed Δα∥ and Δα⊥, with a combination of Δαiso,i and anisotropy (Ri) values associated with each of the two excited states and the local hot state. The amplitudes Δαiso,i of these three states at a particular delay time are determined by the kinetic relaxation model described in the previous section:
| 3 |
| 4 |
Given the spectral shapes and relaxation rates, only the Ri values need to be fitted in this routine. We assign an identical delay-time dependent anisotropy to each of the two excited states:
| 5 |
where the value (R0) represents the fraction of bulklike water molecules with the corresponding bulk reorientation time constant τbulk and the offset (Rslow), the fraction of slowly relaxing water molecules, for which the orientational relaxation is negligible within the accessible delay-time window of the experiment (the details are described in the Supporting Information).
To describe the anisotropy of the local hot state, we used an approach akin to the one used by Rezus et al.38 In this approach, the hot state partly inherits the anisotropic distribution of the excited OD groups. As the bulklike water molecules show a fast reorientation, also after their reorientation, we only consider the slow water molecules in describing the transfer of anisotropy from the excited OD vibration to the local hot state. We also assume that the anisotropy of the local hot state does not show a significant decay within the probed delay-time range. Additionally, we do not account for the heat diffusion from the excited volume, which happens on a much longer time scale of microseconds and is thus not observed within the accessible experimental delay-time range.
Under these assumptions, the anisotropy of the local hot state can be described with the following simple expression (see the Supplementary Information):
| 6 |
Here, Rh is the anisotropy of the local hot state, and a is a fraction of the anisotropy inherited. As can be seen in Figure 5B, accounting for the local hot state anisotropy leads to a significant improvement of the data description (solid line).
In Figure 6, we show the parameters derived from the fit as a function of the lutidine concentration. Figure 6A represents the fraction of slow water molecules extracted from the fit. As can be seen, this fraction increases with the increasing solute concentration until X = 0.3. At X = 0.3, the slow water fraction saturates at a value of ≈ 0.7. In Figure 6B, we show the number of slow water molecules per lutidine molecule. At low solute fractions, on average six water OD groups are slowed down per lutidine molecule. Since the hydrophobic part of lutidine has a much higher volume than its hydrophilic part, it is most likely that at a low solute content, the fraction of slow water molecules is dominated by water molecules that are slowed down as a result of their interaction with the methyl groups and the aromatic ring of lutidine. It has been shown before39 that hydrophobic hydration can lead to the slowing down of the reorientation of up to four water hydroxyl groups per methyl group.
Figure 6.

Parameters extracted from the fitting of the anisotropy dynamics of Figure 5. (A) Fraction of slow water as a function of the fraction of 2,6-lutidine; (B) number of slow water molecules per 2,6-lutidine molecule as a function of the fraction of 2,6-lutidine; (C) fraction of the anisotropy (a) inherited by the local hot state as a function of the fraction of 2,6-lutidine; the dashed lines are guides to an eye.
Increasing the concentration leads to a gradual decrease in the number of slow water OD groups per lutidine molecule. Dilution of water with lutidine leads to an overall lower number of water molecules per lutidine molecule. Apart from that, when the concentration is increased, the lutidine molecules will cluster due to the aggregation of their hydrophobic parts. As a result, water molecules will be expelled leading to a decrease of the number of slow water hydroxyl groups per lutidine molecule. It is to be expected that even at high concentrations, water will remain interacting with the hydrophilic part of lutidine. Each lutidine molecule can create one strong OH(OD)...N bond. Noticing the significant broadening of the shoulder in the red wing of the linear spectrum (Figure 2), it thus seems likely that at high solute concentration, most of the remaining slow water hydroxyl groups are slowed down because of their interaction with the nitrogen atom of lutidine.
In Figure 6C, we show the fraction a of the anisotropy inherited by the local hot state as a function of the lutidine fraction. At low lutidine fractions, the data can be well described assuming that the local hot state is isotropic (a = 0, see Figure S4). For solute fraction ≥0.15, a has a significant nonzero value and increases with the increasing lutidine fraction.
Temperature-Induced Changes in the Structure and Dynamics
We studied the temperature dependence of the anisotropy dynamics at three lutidine/water compositions: lower than the critical (X = 0.02), around the critical (X = 0.062), and higher than the critical concentration of 2,6-lutidine (X = 0.2). For all compositions, we observe little acceleration in the vibrational relaxation upon decreasing the temperature (Figure S6). This finding is in good agreement with previously reported results for aqueous solutions of small amphiphilic molecules, which showed no change in the relaxation rate40 or only a small acceleration when the temperature is decreased.41 The anisotropy dynamics were analyzed by fitting Δα∥ and Δα⊥ according to the procedure described in the previous section. The bulk reorientation time constant τbulk values at different temperatures are calculated with an Arrhenius equation, using an activation energy Ea of 16.5 kJ/mol and a prefactor A of 332.7. These values are obtained from a previous study of water interacting with amphiphilic molecules.41
The most pronounced effect induced by decreasing the temperature is the increase of the slow water fraction (Figure 7A). This effect is very clear for X = 0.2: when the temperature is decreased from 313 to 275 K, an increase of Rslow by ∼50% is observed. For lower solute fractions, this effect is less pronounced (∼15–20%). The a value shows no significant temperature dependence and equals ∼0.1.
Figure 7.

(A) Temperature dependences of the fraction of slow water molecules and (B) fraction of the inherited anisotropy (a); dashed lines are the guide to an eye.
Discussion
A striking observation in the linear IR absorption spectrum is the rise of a shoulder in the red wing of the OD stretch absorption band with the increasing lutidine concentration. This shoulder results from the formation of a strong OD...N hydrogen bond between HDO and the sp2-hybridized nitrogen atom of the pyridine ring of lutidine. This observation is in good agreement with previous theoretical work.15,42 This situation is very similar to that of the TMAO/water system in which a highly partially charged O atom is present.37 In contrast, for tetramethyl urea, DMSO, and acetone, the oxygen atoms have a weaker affinity to water hydrogen atoms.27,39
We find that the vibrational relaxation of the OD stretch vibrations of the water–lutidine mixtures can be well-modeled with two OD stretch absorption bands with different vibrational relaxation rates. These two bands account for the fact that water–lutidine mixtures contain a broad distribution of hydrogen-bond strengths and that vibrational relaxation proceeds faster for strongly hydrogen-bonded HDO molecules (with low OD stretch frequencies) than for weakly hydrogen-bonded HDO molecules (with high OD stretch frequencies). A frequency dependent relaxation rate has been observed before for DMSO/water, acetone/water, and TMAO/water systems.27,37 In all these cases, vibrational relaxation proceeds faster in the red wing of the spectrum than in the blue one.
Increasing the fraction of 2,6 lutidine leads to a deceleration of the vibrational relaxation at all frequencies. We attribute this effect to a disruption of the hydrogen-bond network by lutidine. With the increasing lutidine concentration, the fraction of water molecules forming hydrogen bonds with the solute increases, but the average amount of hydrogen bonds per water molecule decreases. A similar deceleration with the increasing solute concentration has been observed for aqueous solutions of tetramethyl urea, DMSO, and acetone. Interestingly, for the TMAO/water system, no significant concentration dependence of the vibrational relaxation rate was observed, but in this case, the range over which the solute fraction was varied was limited by ∼0.15.
We observe that the fraction of slowly reorienting water molecules, as expressed by the parameter Rslow, increases with the increasing concentration of 2,6 lutidine. This growth of Rslow follows from the increases of both the fraction of water interacting with the hydrophobic groups of lutidine27,39 and the fraction of water molecules forming a hydrogen bond with the nitrogen atom of lutidine; the latter is evidenced by the rise of the red-shifted shoulder in the IR absorption spectrum.27,37 These different types of solvating water molecules represent a broad distribution of hydrogen-bond strengths, and as both types contribute to the slow water fraction, the anisotropy of the excited OD oscillators shows very little frequency dependence. As a result, Rslow has the same value for the two absorption bands that we use to model the transient OD absorption spectrum. The notion that both the hydrophobic hydrating water molecules and the water molecules hydrogen-bonded to the nitrogen atom contribute to the slow water fraction agrees with the findings of previous theoretical work, nuclear magnetic resonance43 and small-angle scattering16,19,21 studies of mixtures of water and different pyridine derivatives. In these studies, it was shown that water molecules interact with all hydrogen atoms and the nitrogen atom of lutidine. In previous theoretical studies, various hydration structures of lutidine have been reported.14,15,18,43 It is worth noting that a water molecule can potentially coordinate two lutidine molecules. Such a molecular configuration in which a water molecule interacts with two lutidine molecules is expected to have an even more constrained rotational mobility than 1:1 complexes, since in such a configuration also the rotation around the OD...N hydrogen bond would be suppressed due to the interaction with the second lutidine molecule.
A striking observation is that the local hot state that results from the vibrational relaxation is anisotropic, which implies that a significant fraction of the heat-affected water molecules are slowly reoriented and sufficiently isolated from other water molecules to avoid equilibration of the heating effect due to heat diffusion within the time range of our experiment. The anisotropy of the local hot state is determined by the slow water fraction Rslow and the parameter a that represents the transfer of this anisotropy to the local hot state, following relaxation of the OD stretch vibration. If the anisotropy would be completely retained, a would be equal to 1. There are several reasons why a is smaller than 1. In the first place, the fast local dumping of heat by the relaxation of the OD stretch vibration likely temporarily speeds up the reorientation, leading to a partial depolarization of the subsequent heating effect. Second, even though the water is isotopically diluted and the mixture will show microstructuring, i.e., clustering effects, for some of the excited OD groups, the dissipated heat will affect other nonexcited OD groups that happen to be nearby and that have a random orientation, which will decrease the anisotropy of the heating effect. Finally, in the modeling, we assumed the anisotropy of the local hot state to be time-independent to limit the number of free parameters. If this anisotropy does in fact decay on a time scale of tens of picoseconds, either because of reorientation of the heat-affected OD group or because of heat diffusion, this will lead to a lower optimally fitted value of the parameter a.
We observe that the parameter a increases with the increasing lutidine fraction due to several effects. In the first place, water molecules will become more isolated when the lutidine fraction increases. Hydrophobic clustering of lutidine molecules14,44,45 has been observed for 2,6-lutidine/water and similar systems in the vicinity of the LSCT, and those clusters were reported to vary in size between 0.5 and 4 nm.16,19−21 According to ultrasound absorption experiments, the lifetime of these aggregates is on the order of nanoseconds.16 Hence, within the experimentally probed time window, the water molecules will remain enclosed by lutidine molecules. With the increasing lutidine concentration, the number of water molecules in the water clusters enclosed by the lutidine aggregates will decrease and the average distance between the clusters will increase. Both effects will diminish the spreading of the heating effect to other nonexcited OD vibrations, following the relaxation of an excited OD vibration, and thus increase the amount by which the anisotropy is conserved in the local hot state. A second reason that a increases with the increasing lutidine fraction is that the reorientation of slow water molecules becomes even slower. The accessible time window of our fs-IR experiment does not allow for a quantification of this further slowing down, but dielectric relaxation measurements have shown that the reorientation of water molecules near hydrophobic groups becomes slower when the concentration of hydrophobic groups increases,46 probably as a result of a crowding effect. Besides, with the increasing lutidine concentration, the relative contribution of the water molecules forming a hydrogen bond to the nitrogen atom of lutidine will increase. These water molecules likely reorient even more slowly than water molecules near hydrophobic groups due to strong interaction with nitrogen. The enhanced contribution of the N-bonded water molecules to the slow water fraction will thus lead to an average slowing down of the reorientation, which increases the a value.
A decrease of the temperature is observed to lead to an increase of Rslow that comprises both water molecules hydrating the hydrophobic groups of lutidine and water molecules that form a hydrogen bond to the nitrogen atom of lutidine. As the latter hydrogen bond is quite strong, we expect it to be formed at all temperatures, and thus, we do not expect a strong change in the density of these hydrogen bonds with temperature. Hence, the observed increase of the slow water fraction with the decreasing temperature (∼50% for X = 0.2) likely originates from the increased fraction of water molecules hydrating the hydrophobic groups of the solute. This indicates that the size of the lutidine clusters decreases with the decreasing temperature, thus leading to an increase of the total hydrophobic surface that is exposed to water. According to small-angle neutron scattering experiments,16 the size of the heterogeneities formed in the 2,6-lutidine/water system is weakly dependent on temperature, but the probed temperature range in this study was limited to only 7 K lower than the LSCT. In the same study, a significant decrease of the sizes of the heterogeneities was observed for 2-methylpyridine/water mixtures when this mixture was cooled to 40 K below the LSCT. Like 2,6-lutidine/water, 2-methylpyridine/water also possesses a closed-loop phase diagram, and the structure of the solute closely resembles that of 2,6-lutidine. In the present study, samples were cooled down to 30 K below the LSCT, thus making it highly probable that the cluster size decreases, leading to an increase of the hydrophobic surface exposed to water and thus of Rslow.
An interesting observation is that, in contrast to Rslow, the parameter a does not show a significant temperature dependence, which can be explained from the presence of a few counteracting effects. With the decreasing temperature, the reorientational dynamics of OD groups normally would become slower, which would lead to an increase of the a value. However, with the decreasing temperature, the contribution of the hydrophobic hydrating OD groups to the slow water fraction increases relative to the contribution of the OD groups that are hydrogen-bonded to N. The hydrophobic hydrating OD groups likely effectively have shorter reorientation dynamics, thus counteracting the increase of the reorientation time that normally would result from a decrease in temperature. The net result of the two effects is that the average reorientation time of the slow OD groups shows little variation in the studied temperature range, with the result that the parameter a does not show a significant temperature dependence.
It is interesting to consider the present findings from the perspective of the thermodynamics of the water–2,6-lutidine mixture. The mixture will be more likely in a single-phase state when the Gibbs free energy difference (ΔG) of mixing is more negative. We find strong evidence for increased hydrophobic hydration when the temperature is lowered further below the LSCT. Increased hydrophobic hydration leads to a decrease of the mobility of water molecules involved, which points at a decrease of the possible orientations (realizations) of the water molecules, and thus a decrease of the entropy. Far below the LSCT, the formation of lutidine clusters is not strongly pronounced, which implies that there is a substantial interaction between water and the hydrophobic groups of the lutidine molecules. At a low temperature, the entropy contribution to the free energy caused by these interactions is low and is apparently compensated by the enthalpic contribution of the strong OD...N interactions. At higher T, the entropy term becomes more important, making the expulsion of water and hydrophobic aggregation of lutidine molecules more favorable. At the LSCT, the driving force for hydrophobic aggregation becomes that strong that a full macroscopic phase separation results. At concentrations lower than the critical concentration (X < 0.062), the LSCT will be higher because the entropic effects of hydrophobic hydration and aggregation will be smaller. For X > 0.062, hydrogen bonding between water and lutidine contributes to the decrease of mixing Gibbs free energy difference, and the critical temperature increases again. It is interesting to note that the OD...N hydrogen bonds are almost unperturbed by a temperature change within the studied temperature range (down to 30 K below the LSCT), implying that hydrophobic hydration and aggregation play the most important roles in determining the phase transition conditions. Recent DFT studies indicate that the phase separation at the critical temperature is induced by the cleavage of external hydrogen bonds of 2:1 complexes of lutidine and water.18 By combining our findings with previously reported results, we conclude that near the LSCT, water molecules that are not involved in strong interactions with the solute tend to interact with each other, rather than being located in the nearest vicinity of the solute. This result implies that the distribution of water molecules shows an increased heterogeneity near the LSCT.
Conclusions
We studied the dynamics of HDO molecules in 2,6-lutidine/H2O mixtures near the LSCT by probing the OD stretch vibrations with polarization-resolved femtosecond infrared pump–probe spectroscopy. Upon the addition of 2,6-lutidine, the vibrational energy relaxation of the OD stretch vibration is observed to proceed faster in the red wing of the spectrum than in the blue wing. This frequency dependence can be well described with a kinetic relaxation model involving two excited OD stretch vibrational states that relax with different time constants to the common local hot state.
We attributed the frequency dependence of the vibrational relaxation to an increase of the heterogeneity of the strengths of the hydrogen bonds in the mixture with the increasing lutidine concentration, likely as a result of the formation of strong OD...N hydrogen bonds between HDO and the nitrogen atom of lutidine. This result is corroborated by the rise of a shoulder in the red wing of the linear infrared absorption spectrum with the increasing 2,6-lutidine concentration. In spite of this increasing contribution of strongly hydrogen-bonded OD groups, the overall vibrational relaxation rate decreases with the increasing lutidine fraction probably because of the increased perturbation and truncation of the hydrogen-bond network of the mixture.
The anisotropy dynamics of the transient absorption signal show an increasing offset with the increasing lutidine fraction, showing the presence of an increasing fraction of slowly reorienting water molecules. We assign these molecules to water molecules forming a hydrogen bond to the nitrogen atom of lutidine and to water molecules hydrating the hydrophobic groups.
The transient absorption signal induced by the local hot state is observed to be anisotropic when the lutidine fraction is larger than 0.15. This anisotropic character indicates that the dissipated energy primarily affects the originally excited water molecules, which implies that a significant fraction of the heat-affected water molecules shows slow reorientation and is sufficiently isolated from other water molecules to avoid equilibration of the heating effect due to heat diffusion within the time range of our experiment. We describe the degree by which the anisotropy of the excited OD vibrations is retained in the local hot state with a parameter a. This parameter increases with an increase of the lutidine fraction because the reorientational dynamics of the water molecules effectively slow down and the water molecules become more isolated. This slowing down of the reorientation likely results from the increased contribution to the slow water fraction of water molecules forming hydrogen bonds with the nitrogen atom of lutidine.
When the temperature of the water–lutidine mixture is decreased, the fraction of slowly reorienting water molecules increases, and no significant change in the parameter a is observed. Both observations indicate that the fraction of water molecules that hydrate the hydrophobic groups of lutidine increases, which means that with the decreasing temperature, the clusters decrease in size, thereby increasing the overall hydrophobic surface exposed to water.
Acknowledgments
This work is part of the research program of the Netherlands Organization for Scientific Research (NWO) and was performed at the research institute AMOLF. This project has received funding from the European Research Council (ERC) under the European Union’s Horizon 2020 research and innovation program (grant agreement no 694386). We would like to express our gratitude to Dr. Oleksandr Sofronov for careful reading of the manuscript, meaningful suggestions, and technical support.
Supporting Information Available
The Supporting Information is available free of charge at https://pubs.acs.org/doi/10.1021/acs.jpcb.0c09363.
Infrared absorption spectra treatment scheme, infrared absorption spectra of mixtures with X > 0.5, description of the fitting of Δα∥ and Δα⊥: description of the minimization procedure and key approaches to programming it in Python 3; additional explanation of hot ground-state anisotropy analysis, selected delay traces of Δαiso and raw anisotropy, temperature dependence of vibrational relaxation and reorientational dynamics (PDF)
The authors declare no competing financial interest.
Supplementary Material
References
- Indulkar A. S.; Gao Y.; Raina S. A.; Zhang G. G. Z.; Taylor L. S. Exploiting the Phenomenon of Liquid-Liquid Phase Separation for Enhanced and Sustained Membrane Transport of a Poorly Water-Soluble Drug. Mol. Pharmaceutics 2016, 13, 2059–2069. 10.1021/acs.molpharmaceut.6b00202. [DOI] [PubMed] [Google Scholar]
- Babinchak W. M.; Surewicz W. K. Liquid–Liquid Phase Separation and Its Mechanistic Role in Pathological Protein Aggregation. J. Mol. Biol. 2020, 432, 1910–1925. 10.1016/j.jmb.2020.03.004. [DOI] [PMC free article] [PubMed] [Google Scholar]
- Alberti S.; Gladfelter A.; Mittag T. Considerations and Challenges in Studying Liquid-Liquid Phase Separation and Biomolecular Condensates. Cell 2019, 176, 419–434. 10.1016/j.cell.2018.12.035. [DOI] [PMC free article] [PubMed] [Google Scholar]
- Renbaum-Wolff L.; Song M.; Marcolli C.; Zhang Y.; Liu P. F.; Grayson J. W.; Geiger F. M.; Martin S. T.; Bertram A. K. Observations and Implications of Liquid-Liquid Phase Separation at High Relative Humidities in Secondary Organic Material Produced by α-Pinene Ozonolysis without Inorganic Salts. Atmos. Chem. Phys. 2016, 16, 7969–7979. 10.5194/acp-16-7969-2016. [DOI] [Google Scholar]
- Song M.; Liu P.; Martin S. T.; Bertram A. K. Liquid-Liquid Phase Separation in Particles Containing Secondary Organic Material Free of Inorganic Salts. Atmos. Chem. Phys. 2017, 17, 11261–11271. 10.5194/acp-17-11261-2017. [DOI] [Google Scholar]
- Chou Y. C.; Goldburg W. I. Phase Separation and Coalescence in Critically Quenched Isobutyric-Acid Water and 2,6-Lutidine Water Mixtures. Phys. Rev. A 1979, 20, 2105–2113. 10.1103/PhysRevA.20.2105. [DOI] [Google Scholar]
- Counsell J. F.; Everett D. H.; Munn R. J. Recent Redeterminations of the Phase Diagram of the System: Triethylamine + Water. Pure Appl. Chem. 1961, 2, 335–338. 10.1351/pac196102010335. [DOI] [Google Scholar]
- Míguez J. M.; Piñeiro M. M.; Algaba J.; Mendiboure B.; Torré J. P.; Blas F. J. Understanding the Phase Behavior of Tetrahydrofuran + Carbon Dioxide, + Methane, and + Water Binary Mixtures from the SAFT-VR Approach. J. Phys. Chem. B 2015, 119, 14288–14302. 10.1021/acs.jpcb.5b07845. [DOI] [PubMed] [Google Scholar]
- Heskins M.; Guillet J. E. Solution Properties of Poly(N-Isopropylacrylamide). J. Macromol. Sci. Part A - Chem. 1968, 2, 1441–1455. 10.1080/10601326808051910. [DOI] [Google Scholar]
- Saeki S.; Kuwahara N.; Nakata M.; Kaneko M. Upper and Lower Critical Solution Temperatures in Poly (Ethylene Glycol) Solutions. Polymer 1976, 17, 685–689. 10.1016/0032-3861(76)90208-1. [DOI] [Google Scholar]
- Lachwa J.; Szydlowski J.; Najdanovic-Visak V.; Rebelo L. P. N.; Seddon K. R.; Da Ponte M. N.; Esperança J. M. S. S.; Guedes H. J. R. Evidence for Lower Critical Solution Behavior in Ionic Liquid Solutions. J. Am. Chem. Soc. 2005, 127, 6542–6543. 10.1021/ja0510257. [DOI] [PubMed] [Google Scholar]
- Goldstein R. E. Substituent Effects on Intermolecular Hydrogen Bonding from a Lattice Gas Theory for Lower Critical Solution Points : Comparison with Experiments on Aqueous Solutions of Alkylpyridines. J. Chem. Phys. 1983, 79, 4439. 10.1063/1.446329. [DOI] [Google Scholar]
- Karlsson R. Solubility of Water in Benzene. J. Chem. Eng. Data 1973, 18, 290–292. 10.1021/je60058a006. [DOI] [Google Scholar]
- Brovchenko I. V.; Oleinikova A. V. Structural Changes of the Molecular Complexes of Pyridines with Water and Demixing Phenomena in Aqueous Solutions. J. Chem. Phys. 1997, 106, 7756–7765. 10.1063/1.473776. [DOI] [Google Scholar]
- Pápai I.; Jancsó G. Hydrogen Bonding in Methyl-Substituted Pyridine-Water Complexes : A Theoretical Study. J. Phys. Chem. A 2000, 104, 2132–2137. 10.1021/jp994094e. [DOI] [Google Scholar]
- Wojciech M.; Bożena C.; Laśzlo A.; Didier L. Molecular Clusters in Aqueous Solutions of Pyridine and Its Methyl Derivatives. Phys. Chem. Chem. Phys. 2011, 13, 6260–6269. 10.1039/C0CP02771E. [DOI] [PubMed] [Google Scholar]
- Davies N. S. A.; Gillard R. The Solubility Loop of Nicotine:Water. Trans. Metal Chem. 1999, 25, 628–629. 10.1023/A:1007092216627. [DOI] [Google Scholar]
- Chernia Z.; Tsori Y. Complexation Reactions in Pyridine and 2, 6-Dimethylpyridine-Water System: The Quantum-Chemical Description and the Path to Liquid Phase Separation. J. Chem. Phys. 2018, 148, 104306–104315. 10.1063/1.5010177. [DOI] [PubMed] [Google Scholar]
- Kostko A. F.; Anisimov M. A.; Sengers J. V. Criticality in Aqueous Solutions of 3-Methylpyridine and Sodium Bromide. Phys. Rev. E 2004, 70, 026118 10.1103/PhysRevE.70.026118. [DOI] [PubMed] [Google Scholar]
- Balasko M.; Jancso G.; Korosi F. Analyzing of Segregation in Mixtures of 3-Methylpyridine and Heavy Water by Dynamic Neutron Radiography. IEEE Trans. Nucl. Sci. 2005, 52, 285–289. 10.1109/TNS.2005.844015. [DOI] [PubMed] [Google Scholar]
- Jacob J.; Kumar A.; Asokan S.; Sen D.; Chitra R.; Mazumder S. Evidence of Clustering in an Aqueous Electrolyte Solution : A Small-Angle X-Ray Scattering Study. Chem. Phys. Lett. 1999, 304, 180–186. 10.1016/S0009-2614(99)00262-6. [DOI] [Google Scholar]
- Cox J. D. Phase Relationships in the Pyridine Series. Part II. The Miscibility of Some Pyridine Homologues with Deuterium Oxide. J. Chem. Soc. 1949, 4606–4608. 10.1039/JR9520004606. [DOI] [Google Scholar]
- Grattoni C. A.; Dawe R. A.; Seah C. Y.; Gray J. D. Lower Critical Solution Coexistence Curve and Physical Properties (Density , Viscosity, Surface Tension, and Interfacial Tension) Of 2,6-Lutidine + Water. J. Chem. Eng. Data 1993, 38, 516–519. 10.1021/je00012a008. [DOI] [Google Scholar]
- Balevicius V.; Gdaniec Z.; Fuess H. NMR Probing of Structural Peculiarities in Ionic Solutions Close to Critical Point. J. Chem. Phys. 2005, 123, 224503. 10.1063/1.1989312. [DOI] [PubMed] [Google Scholar]
- Reeves M.; Brown A. T.; Schofield A. B.; Cates M. E.; Thijssen J. H. J. Particle-Size Effects in the Formation of Bicontinuous Pickering Emulsions. Phys. Rev. E 2015, 92, 032308 10.1103/PhysRevE.92.032308. [DOI] [PubMed] [Google Scholar]
- Janardanan S.; Perez L. M.; Mannan M. S.; Carlo M. Study of Phase Behavior of 2 , 6-Lutidine, 2, 6-Lutidine- N-Oxide and Water Mixture Using UNIQUAC Model with Interaction Parameters Determined by Molecular Simulations. Thermochim. Acta 2019, 671, 110–118. 10.1016/j.tca.2018.10.001. [DOI] [Google Scholar]
- Lotze S.; Groot C. C. M.; Vennehaug C.; Bakker H. J. Femtosecond Mid-Infrared Study of the Dynamics of Water Molecules in Water – Acetone and Water – Dimethyl Sulfoxide Mixtures. J. Phys. Chem. A 2015, 119, 5228–5239. 10.1021/jp512703w. [DOI] [PubMed] [Google Scholar]
- Zhao W.; Moilanen D. E.; Fenn E. E.; Fayer M. D. Water at the Surfaces of Aligned Phospholipid Multibilayer Model Membranes Probed with Ultrafast Vibrational Spectroscopy. J. Am. Chem. Soc. 2008, 130, 13927–13937. 10.1021/ja803252y. [DOI] [PMC free article] [PubMed] [Google Scholar]
- Wong D. B.; Sokolowsky K. P.; El-barghouthi M. I.; Fenn E. E.; Giammanco C. H.; Sturlaugson A. L.; Fayer M. D. Water Dynamics in Water/DMSO Binary Mixtures. J. Phys. Chem. B 2012, 116, 5479–5490. 10.1021/jp301967e. [DOI] [PubMed] [Google Scholar]
- Groot C. C. M.; Bakker H. J. Proteins Take up Water Before Unfolding. J. Phys. Chem. B 2016, 7, 1800–1804. 10.1021/acs.jpclett.6b00708. [DOI] [PubMed] [Google Scholar]
- Yan C.; Kramer P. L.; Yuan R.; Fayer M. D. Water Dynamics in Polyacrylamide Hydrogels. J. Am. Chem. Soc. 2018, 140, 9466–9477. 10.1021/jacs.8b03547. [DOI] [PubMed] [Google Scholar]
- Fenn E. E.; Moilanen D. E.; Levinger N. E.; Fayer M. D. Water Dynamics and Interactions in Water-Polyether Binary Mixtures. J. Am. Chem. Soc. 2009, 131, 5530–5539. 10.1021/ja809261d. [DOI] [PMC free article] [PubMed] [Google Scholar]
- Sturlaugson A. L.; Fruchey K. S.; Lynch S. R.; Arago S. R.; Fayer M. D. Orientational and Translational Dynamics of Polyether/Water Solutions. J. Phys. Chem. B. 2010, 114, 5350–5358. 10.1021/jp101369e. [DOI] [PubMed] [Google Scholar]
- Woutersen S.; Bakker H. J. Resonant Intermolecular Energy Transfer in Liquid Water. Nature 1999, 402, 507–509. 10.1038/990058. [DOI] [Google Scholar]
- Lifschitz A. M.; Rodgers J. M.; Samet C. Matrix and Polymer Soft-Landing Isolation of Selected Acids with Pyridine and Poly(4-Vinylpyridine): A Comparative Infrared Spectroscopic Study of Hydrogen Bonding. J. Phys. Chem. B 2012, 116, 211–220. 10.1021/jp2080012. [DOI] [PubMed] [Google Scholar]
- Shimizu S.; Watanabe N.; Kataoka T.; Shoji T.; Abe N.; Morishita S.; Ichimura H.. “Pyridine and Pyridine Derovatives” Ullman’s Encyclopedia of Industrial Chemistry, Vol. 30; Wiley-VCH Verlag GmbH & Co. KGaA: Weinheim, 2012. [Google Scholar]
- Hunger J.; Tielrooij K.-J.; Buchner R.; Bonn M.; Bakker H. J. Complex Formation in Aqueous Trimethylamine- N-Oxide (TMAO) Solutions. J. Phys. Chem. B 2012, 116, 4783–4795. 10.1021/jp212542q. [DOI] [PubMed] [Google Scholar]
- Rezus Y. L. A.; Bakker H. J. Orientational Dynamics of Isotopically Diluted H2O and D2O. J. Chem. Phys. 2006, 125, 144512. 10.1063/1.2353831. [DOI] [PubMed] [Google Scholar]
- Rezus Y. L. A.; Bakker H. J. Observation of Immobilized Water Molecules around Hydrophobic Groups. Phys. Rev. Lett. 2007, 99, 148301. 10.1103/PhysRevLett.99.148301. [DOI] [PubMed] [Google Scholar]
- Perakis F.; Hamm P. Two-Dimensional Infrared Spectroscopy of Supercooled Water. J. Phys. Chem. B 2011, 115, 5289–5293. 10.1021/jp1092288. [DOI] [PubMed] [Google Scholar]
- Petersen C.; Tielrooij K.-J.; Bakker H. J. Strong Temperature Dependence of Water Reorientation in Hydrophobic Hydration Shells. J. Chem. Phys. 2009, 130, 214511. 10.1063/1.3142861. [DOI] [PubMed] [Google Scholar]
- Lomas J. S.; Maurel F. Water and Alcohol(s): What’s the Difference? A Proton NMR and DFT Study of Hetero-Association with Pyridine. J. Phys. Org. Chem. 2008, 21, 464–471. 10.1002/poc.1351. [DOI] [Google Scholar]
- Kříž J.; Dybal J. Hydration Modes of an Amphiphilic Molecule 2: NMR, FTIR and Theoretical Study of the Interactions in the System Water-1,2-Dimethoxyethane. Chem. Phys. 2011, 382, 104–112. 10.1016/j.chemphys.2011.03.008. [DOI] [PubMed] [Google Scholar]
- Mishra B. K.; Sathyamurthy N. π - π Interaction in Pyridine. J. Phys. Chem. A 2005, 109, 6–8. 10.1021/jp045218c. [DOI] [PubMed] [Google Scholar]
- Hohenstein E. G.; Sherrill C. D. Effects of Heteroatoms on Aromatic π-π Interactions: Benzene-Pyridine and Pyridine Dimer. J. Phys. Chem. A 2009, 113, 878–886. 10.1021/jp809062x. [DOI] [PubMed] [Google Scholar]
- Tielrooij K.-J.; Hunger J.; Buchner R.; Bonn M.; Bakker H. J. Influence of Concentration and Temperature on the Dynamics of Water in the Hydrophobic Hydration Shell of Tetramethylurea. J. Am. Chem. Soc. 2010, 132, 15671–15678. 10.1021/ja106273w. [DOI] [PubMed] [Google Scholar]
Associated Data
This section collects any data citations, data availability statements, or supplementary materials included in this article.