

Abstract
The tumor microenvironment plays a critical regulatory role in cancer progression, especially in central nervous system metastases. Cancer cells within the spinal fluid-filled leptomeninges (leptomeningeal metastases, LM) face substantial microenvironmental challenges, including inflammation and sparse micronutrients. To investigate the mechanism by which cancer cells overcome these constraints, we subjected cerebrospinal spinal fluid (CSF) from patients with LM to single-cell RNA-Seq. Cancer cells, but not macrophages, within the CSF express the iron-binding protein lipocalin-2 (LCN2) and its receptor SCL22A17. These macrophages generate inflammatory cytokines that induce cancer cell LCN2 expression, but do not generate LCN2 themselves. In mouse models of LM, cancer cell growth is supported by the LCN2/SLC22A17 system and is inhibited by iron chelation therapy. Thus, cancer cells appear to survive in the CSF by outcompeting macrophages for iron.
Spread of cancer cells into the cerebrospinal fluid (CSF)-filled leptomeninges is known as leptomeningeal metastasis (LM). This form of metastasis has become increasingly common(1) and is typically fatal within months(2). Under normal physiological conditions, the leptomeningeal space is isolated from the systemic circulation by the blood-CSF-barrier. This anatomic compartment is hypoxic and contains sparse amounts of metabolic intermediates and micronutrients(3). In the setting of LM, the normally acellular CSF contains cancer cells as well as lymphocytes, macrophages and neutrophils. Cancer cells within this microenvironment must therefore cope with oppressive metabolic constraints while evading immune responses. To elucidate the mechanisms by which cancer cells overcome these constraints, we first applied single cell transcriptomic techniques to CSF collected from cancer patients harboring LM and then undertook functional studies in mouse models of LM.
Cancer cells within human spinal fluid express LCN2 and SLC22A17
Cancer cells in the CSF disseminate throughout the central nervous system. Within this compartment they are vastly outnumbered by immune cells, primarily macrophages and lymphocytes (Fig. 1A)(4). To explore cancer and immune cell responses to the nutritionally sparse CSF, we applied single-cell RNA sequencing (scRNA-Seq) to cellular material collected from the CSF of five patients with LM (Fig. 1B, fig S1 and S2). LM was secondary to breast cancer primaries in three patients and to non-small cell lung cancer primaries in two patients (table S1). After scRNA-Seq, the proportions of each cell type within the CSF remained consistent with those identified by clinical analysis (fig. S3A to B).
Fig. 1. Sparse CSF iron promotes LCN2 expression in cancer cells.

(A) Human LM from breast cancer (Patient B). White plaques of LM visualized by magnetic resonance imaging (right-top panel), Giemsa-stained cytospin of CSF (right-bottom panel). Major cell populations are indicated. (B) Single-cell transcriptional map of cancer and immune cells present in CSF of five patients, projected with uniform manifold approximation and projection (UMAP). Each dot represents a cell, colored by PhenoGraph cluster; major cell types are manually annotated according to fig. S1. Each individual patient is projected in fig. S2. (C and D) LCN2 and SLC22A17 gene expression in LM patients. Violin plots of LCN2 (C) and SLC22A17 (D) imputed gene expression in cells from individual patients. All cells grouped into 3 compartments – cancer cells (cancer patients A-E), lymphoid cells (CD4+ T cells, CD8+ T cells, B cells, NK cells) and myeloid cells (Monocyte 1, Monocyte 2, Macrophage, conventional dendritic cells (cDCs), plasmacytoid dendritic cells (pDCs)). (E and F) LCN2 (E) and SLC22A17 (F) Detection by immunofluorescent (IF) staining of leptomeninges collected at autopsy from patients harboring LM. Cytokeratin (white) indicates cancer cells. Macrophages are indicated by the macrophage-specific proteins CD68 or ionized calcium binding adaptor molecule 1 (IBA1) in green. LCN2 and SLC22A17 are shown in red. n = 3 cancer patients. Scale bars, 50 μm. (G and H) LCN2 (G) and SLC22A17 (H) expression, assessed by cytospin staining of cancer cells and macrophages in CSF collected post-mortem from patients in E and F. Scale bars, 20 μm.
We found that all CSF cells showed upregulated expression of iron transport genes, consistent with functional iron deficiency within this anatomic space (Fig. S3C). Hepcidin, a protein implicated in both inflammation and iron deficiency(5), was detected at higher concentrations in the CSF of cancer patients harboring LM, compared with those without LM (fig. S3D). In contrast, CSF levels of the ubiquitous iron transporter, transferrin, were equivalent in the two groups of patients (fig. S3E). We find that immune cells expressed canonical iron transporter transcripts, but cancer cells expressed a diverse array of genes associated with iron binding and transport (fig. S3C). Of these, transcripts for a single iron-binding and receptor pair were expressed exclusively within the cancer cell population in all patients: lipocalin-2 (LCN2) and solute carrier family 22 member 17 (SLC22A17) (Fig. 1C to D). Protein expression corresponding to these single cell transcriptional data was confirmed by ELISA and flow cytometry of human CSF (fig. S3F to H). Finally, in autopsy tissues, LCN2 and SLC22A17 protein expression was detected by immunofluorescence in the cancer cell population, and not in the macrophage/monocyte populations (Fig. 1E to H, and fig. S3I to O).
LCN2, also known as neutrophil gelatinase-associated lipocalin (NGAL), is a beta barrel secreted protein that binds siderophore-complexed ferric iron with high affinity(6–8). SLC22A17 is a LCN2 transporter expressed in a various cell types, including cancer cells(9). To investigate the functional consequences of LCN2/SLC22A17 expression, we used three mouse models of LM generated through iterative in vivo selection (table S2). Unselected parental cells (Par) are nonspecifically metastatic; the LM subpopulation of cells (LeptoM) readily enter into and grow within the leptomeningeal space(11). The mouse lung adenocarcinoma (LLC-Par, LLC-LeptoM), human lung adenocarcinoma (PC9-Par, PC9-LeptoM) and human breast adenocarcinoma (MDA231-Par, MDA231-LeptoM) models all share key features of human LM (10).
Flow cytometry of CSF from the immunocompetent LLC-LeptoM mouse model revealed infiltrating cancer cells accompanied by lymphocytes, macrophages and neutrophils (Fig. 2A). Concentrations of hepcidin and LCN2 were elevated in the CSF of mice with LM (fig. S4, A and B). LCN2 staining by immunohistochemistry (IHC) was specific to cancer cells within the leptomeningeal space (fig. S4C). We also found higher levels of LCN2 mRNA and protein in LeptoM cells than in their parental (Par) counterparts (fig. S2, D and E). While previous studies have documented LCN2 expression in activated macrophages within other anatomic sites (e.g., mammary fat pad) (11, 12), we found that LCN2 was expressed by cancer cells and not macrophages within the leptomeningeal space (Fig. S4F). LCN2 binds productively to three known receptors (SLC22A17, LRP2 and MC4R)(13, 14). In both humans and mouse models, SLC22A17 constituted the major LCN2 receptor (Fig. 1, F and H; fig S4G to J).
Fig. 2. LCN2 supports cancer cell growth in the leptomeninges.

(A) Mouse model of LM. Left: In vivo bioluminescence imaging (BLI) of the LLC model at day 14 post intracardiac dissemination. Middle: Immunohistochemistry (IHC) for pan-cytokeratin. Scale Bar, 1000 μm in larger picture; 50 μm in inset. Right: t-distributed stochastic neighbor embedding (tSNE) of multicolor flow cytometry of CSF collected from syngeneic LLC mouse model (day 14), major cell types indicated as follows: cancer cell (CD45−); orange, neutrophil (CD45+CD11b+Ly6G+); purple, lymphocyte (CD45+CD3+); green, myeloid cell (CD45+CD11b+ excluding neutrophils); blue, and other leukocytes (CD45+CD11b−Ly6G−CD3−); red. n = 5 mice. Representative sample is shown. (B) Tumor growth in mice injected with PC9-LeptoM cells expressing either shCtl or shLCN2. Two independent shRNAs (sh1 and sh2) were employed to target human LCN2. Left: Histogram represents in vivo BLI imaging post-inoculation at day 28. n = 8–10 per group in each of two independent experiments. Right: Representative BLI images. *** indicates p < 0.001 (unpaired t test). Data represent mean ± SEM. (C) Kaplan-Meier survival curve of mice shown in (B). p < 0.0001. (D) Tumor growth in mice injected with PC9-LeptoM cells expressing either shCtl or shSLC22A17. Two independent shRNAs (sh1 and sh2) were employed to target human SLC22A17. Left: Histogram represents in vivo BLI imaging at day 28 post-inoculation. n = 8–10 per group in each of two independent experiments. Right: Representative BLI images. * indicates p < 0.05, **** indicates p < 0.0001 (Unpaired t test). Data represent mean ± SEM. (E) Kaplan-Meier survival curve of mice shown in (D). p < 0.0001. (F) Tumor growth in mice injected with PC9-Par cells expressing either green fluorescent protein (GFP) or LCN2. Left: Histogram represents in vivo BLI imaging post-inoculation at day 21. n = 8–10 per group in each of two independent experiments. Right: Representative BLI images. * indicates p < 0.05 (unpaired t test). Data represent mean ± SEM. (G) Kaplan-Meier survival curve of mice shown in (F). p < 0.0001.
LCN2 promotes cancer cell growth within the leptomeningeal space in mice
We next investigated the functional relevance of LCN2/SLC22A17 in the CSF. We found that shRNA-mediated loss of LCN2 expression in LeptoM cells inhibited their growth within the leptomeninges in all three mouse models and conferred a survival benefit to the animals (Fig. 2B–C, fig. S5A to G). In contrast, LCN2 knockdown did not alter growth of LeptoM cells within iron-replete anatomic sites in vivo (fig. S5H to J). Knockdown of the LCN2 receptor, SLC22A17, phenocopied these results (Fig. 2D–E, and fig. S5K–L).
Conversely, overexpression of LCN2 in parental (Par) cells with no propensity for growth in the leptomeninges promoted growth of these cells in the leptomeningeal space and hastened the death of these animals (Fig. 2F–G, fig. S6). Together, these results support a mechanistic role for the LCN2/SLC22A17 axis in leptomeningeal cancer cell growth.
Inflammatory cytokines induce LCN2 expression in cancer cells
We next explored the mechanism leading to LCN2 expression in cancer cells within the LM. Downstream of both STAT and NF-κB transcriptional promoters, expression of LCN2 may be induced by a variety of inflammatory stimuli(15, 16). To assess the inflammatory state of cells during LM, we queried the scRNA-Seq dataset and found high expression levels of transcripts downstream of JAK-STAT and NFKB promoters in the macrophage population (Fig. 3A, fig. S7A). Consistent with this, inflammatory cytokine (IL-6, IL-8 and IL-1β) concentrations were significantly higher in the CSF of cancer patients with LM versus control patients without LM (fig. S7B). This was also observed in mouse models (fig. S7C–D). We hypothesized that macrophage-generated cytokines stimulated cancer cell LCN2 expression in the CSF.
Fig. 3. Cancer cells generate LCN2 in response to inflammatory cytokines.
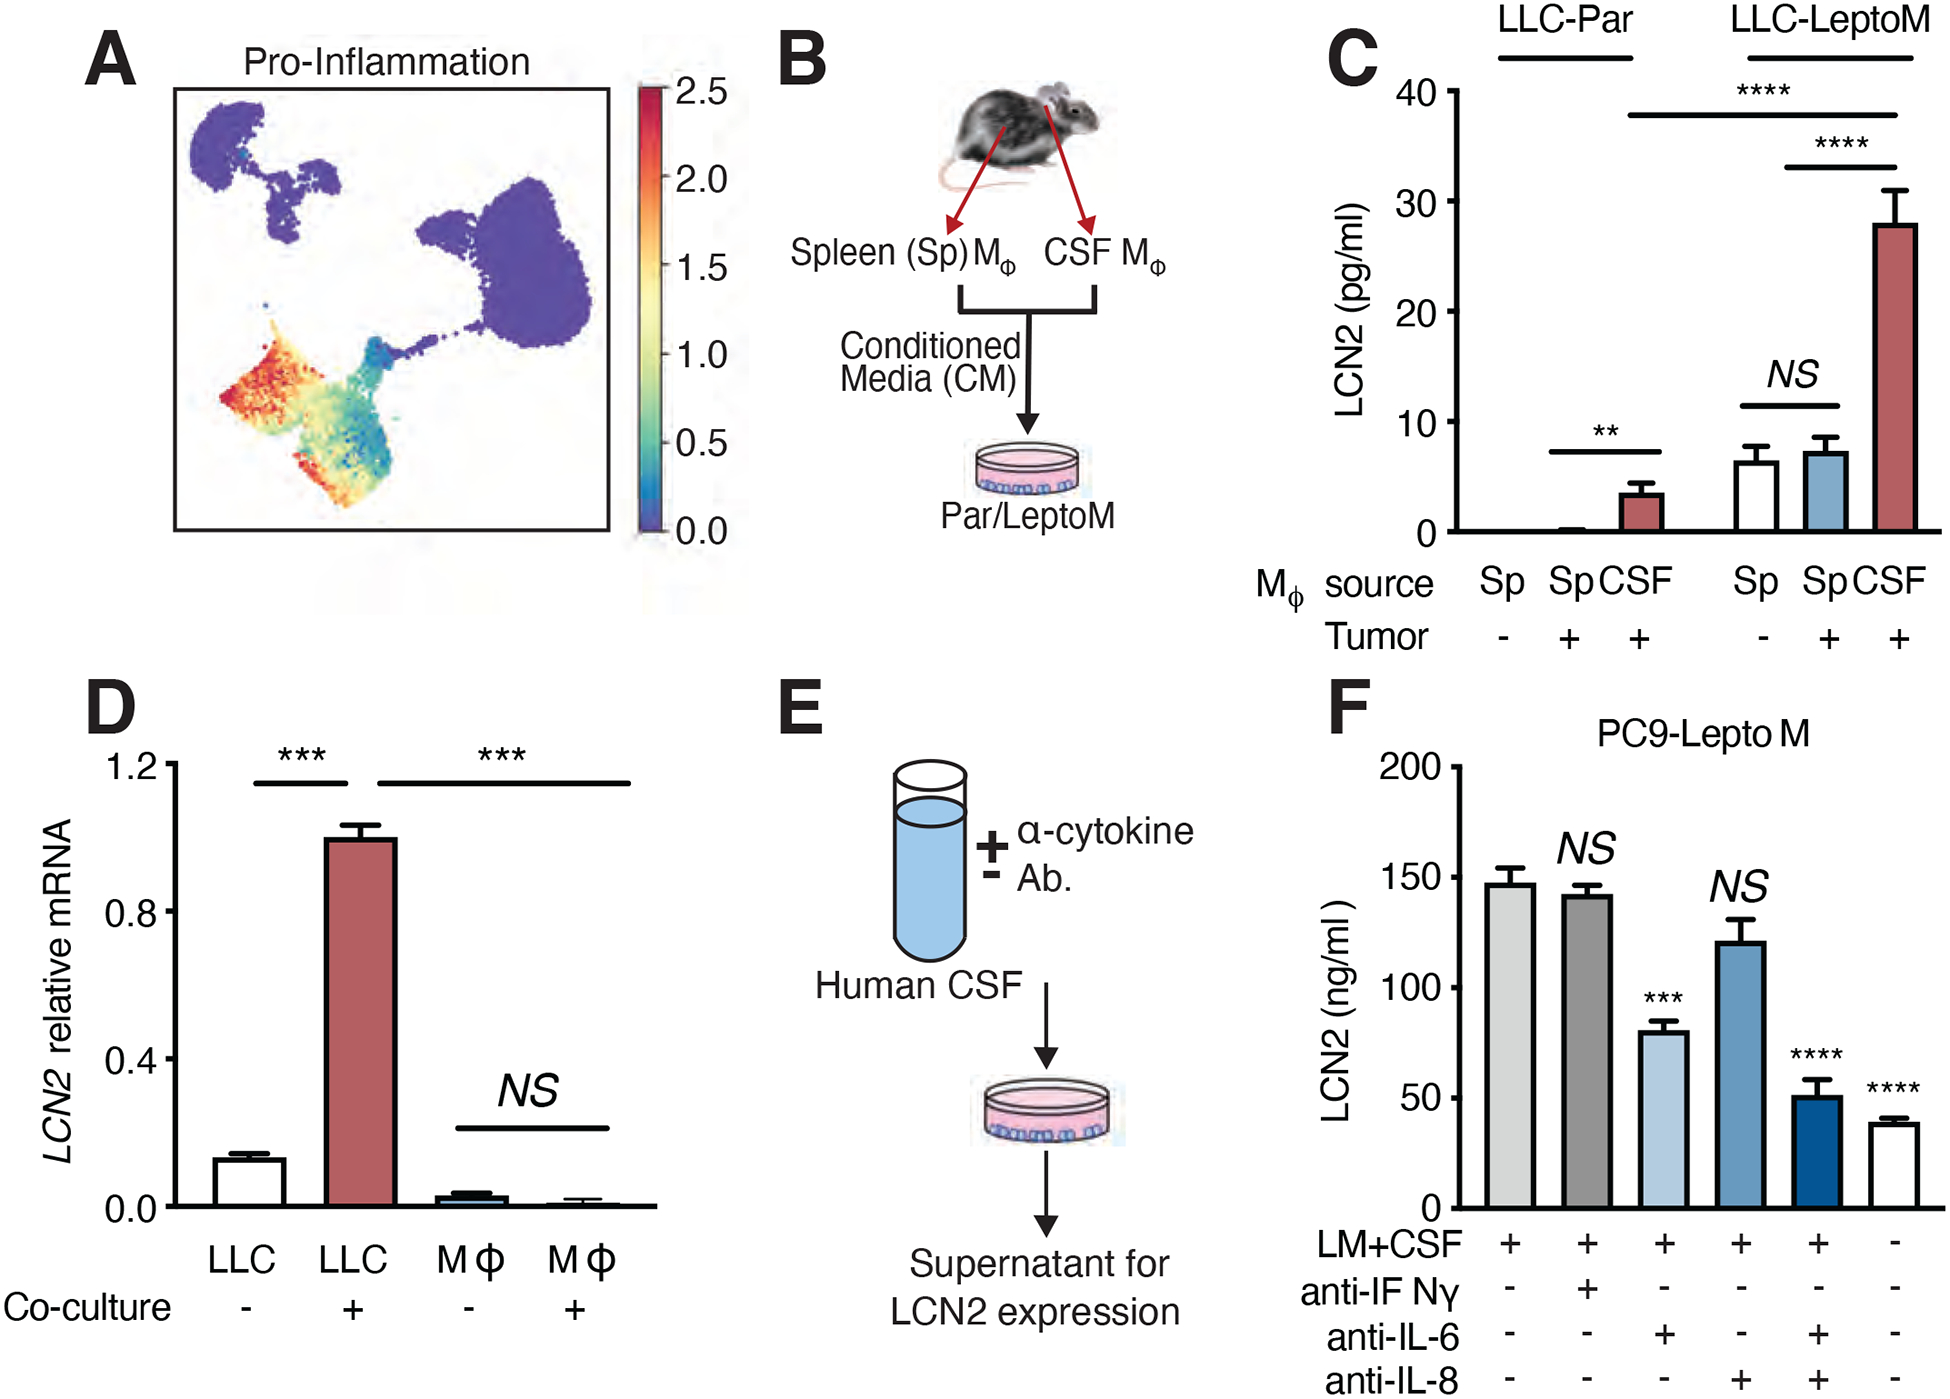
(A) Mean expression of canonical pro-inflammatory cytokines from single-cell transcriptomics. Markov affinity-based graph imputation of cells (MAGIC)-imputed cytokine expression was standardized to zero mean and unit of standard deviation. Please also refer to pro-inflammatory cytokine dataset provided in Table S5. (B) Schematic for cancer cell co-culture with supernatant from macrophages in LLC-LeptoM model. Conditioned media was collected from macrophages, freshly sorted from CSF or spleen of C57Bl/6 mice harboring LLC-LeptoM cells or no cancer by fluorescence-activated cell sorting (FACS) and added to cultures of Par cells or LeptoM cells for 14 days, exchanging fresh conditioned media every 3 days. (C) Evaluation of LCN2 levels by enzyme-linked immunosorbent assay (ELISA) in conditioned media generated as per (B). n = 3 in each of two independent experiments. NS = not significant, ** indicates p < 0.01, **** indicates p < 0.0001 (unpaired t test). Data represent mean ± SEM. (D) LCN2 mRNA detection by qPCR in CSF-derived macrophages and LLC-LeptoM cells after co-culture at day 14. n = 3 in each of two independent experiments. NS = not significant, *** indicates p < 0.001 (unpaired t test). Data represent mean ± SEM. (E and F) CSF from patients harboring LM was treated with neutralizing antibodies against IL-6, IL-8, or IFNγ and added to PC9-LeptoM cells for 12 hours. LCN2 was quantified by ELISA in conditioned media 24 hours after removing CSF. n = 3 in each of two independent experiments. NS = not significant, *** indicates p < 0.001, **** indicates p < 0.0001 (unpaired t test). Data represent mean ± SEM.
To test this hypothesis, we co-cultured LeptoM cancer cells with supernatant collected from macrophages freshly isolated from either the CSF or spleen of mice harboring LLC-LeptoM or LLC-Par tumor cells (Fig. 3B and fig. S7E). We found that macrophages from the CSF of mice harboring LM strongly induced LCN2 expression in LeptoM cancer cells (Fig. 3C). Co-culture of these CSF macrophages with LeptoM cancer cells induced expression of LCN2 in cancer cells but not in macrophages (Fig. 3D). Outside the leptomeninges, LCN2 expression by macrophage/monocytes and neutrophils is typically induced by inflammation(17). In our models, although LCN2 expression was increased in extracranial splenic monocytes and neutrophils after lipopolysaccharide (LPS) treatment, LCN2 expression remained unchanged in these cells in the CSF (fig. S3G, fig. S4F, fig. S7F). Moreover, while LCN2 may induce influx of neutrophils to extracranial sites(18), we do not appreciate LCN2-dependent changes in CSF leukocyte composition (fig. S7G), underlining the unique physiology of the leptomeninges.
To identify the relevant cytokines in human disease, we immune-depleted select inflammatory cytokines from LM-positive human CSF (Fig. 3E). Whereas whole CSF from LM patients strongly induced LCN2 expression in cancer cells, immune-depletion of IL-6 and/or IL-8 or inhibited this biological effect in both PC9 and MDA231 model systems (Fig. 3F and fig. S8A). Conversely, addition of recombinant IL-6, IL-8 or IL-1β to artificial CSF induced expression of LCN2 from PC9, MDA231 or LLC (fig. S8B to D) LeptoM cells. Together, these data indicate that macrophage-generated cytokines induce expression of LCN2 in cancer cells within the LM.
To gain more insight into the properties of these pro-inflammatory leptomeningeal macrophages, we examined the transcriptome of the macrophage/monocyte population in our scRNA-Seq dataset. Consistent with the known transcriptional heterogeneity of these cells(19), we observed non-reciprocal expression of both M1 (proinflammatory) and M2 (anti-inflammatory) polarization transcriptional gradients (fig. S8E). Unexpectedly, this analysis revealed the hypoxia transcriptional signature as a major feature of this macrophage population.
LCN2 supports cancer cell growth in the hypoxic leptomeninges in mice
Hypoxia signaling is intimately linked to iron homeostasis(20). We found that freshly isolated CSF cancer cells and immune cells from human LM samples showed evidence of hypoxia-induced transcriptional changes as well as a correlation between hypoxia and iron metabolic signatures (Fig. 4, A and B and fig. S9A). In mouse models, bulk RNA-Seq of LeptoM derivative cell lines with and without LCN2 knockdown revealed LCN2-dependent expression of the hypoxia transcriptional signature, suggesting a role for LCN2 in hypoxia (Fig. 4C and fig. S9B–C).
Fig. 4. LCN2 supports cancer cell growth in the hypoxic CSF microenvironment.

(A and B) Correlation between hypoxia and iron ion transport gene signatures. Axis value represents mean gene signature expression per cell, standardized to have zero mean and unit of standard deviation. Each dot represents a cell, colored by cell type; please also refer to Fig 1B. (B) Cancer cell populations from (A) alone. (C) Gene set enrichment (GSA) analysis of PC9 and LLC models by bulk RNA sequencing of LeptoM shCtl and shLCN2. Number of significantly upregulated (red) and downregulated (blue) genes in GSA analysis are indicated on the x axis. n = 2 per group. p < 0.05. Please also refer to Fig. S7B. (D) Leptomeningeal tumor growth in a dual reporter in vivo system. PC9-LeptoM cells express Firefly luciferase (Fluc) constitutively; NanoLuc (Nluc) is induced downstream of hypoxia response element (HRE). Left: Fluc and Nluc are assayed by BLI at indicated time points. Right: representative BLI images at day 0 and day 7. n = 8–10 per group in each of two independent experiments. Data represent mean ± SEM. (E) Leptomeningeal tissue sections stained with hematoxylin and eosin (H&E) and IHC for LCN2, hypoxia-inducible factors (HIF) HIF-1α and HIF-2α in PC9-LeptoM model. Scale bar, 50 μM.
The biological relevance of hypoxia signaling in LM remains undetermined. In the absence of disease, the CSF is hypoxic with ppO2 ranging from 65–130 +/− 49 mmHg. However, in inflammatory injury (21) or an impaired blood-CSF-barrier (10) CSF oxygenation is improved. To study hypoxia in our LM mouse models we generated a dual-luciferase reporter system consisting of constitutive firefly luciferase and nano-luciferase downstream of hypoxia response elements (HREs). The PC9-LeptoM and LLC-LeptoM models demonstrated NLuc activation (an indication of hypoxia) upon inoculation into the CSF and this activation remained stable over the disease course (Fig. 4D). Despite this hypoxia, the LeptoM cells continued to grow, and expressed hypoxia-inducible factors HIF1A and HIF2A (Fig 4D, E and fig. S9D and E). In vitro, LeptoM derivatives demonstrated robust growth under hypoxic conditions in an LCN2-dependent manner: Knockdown of LCN2 expression with shRNA inhibited LeptoM growth and promoted apoptosis in hypoxia (fig. S9F to P), overexpression of LCN2 provided resistance to hypoxic stress (fig. S9Q–R). From these experiments we conclude that cancer cell LCN2 expression supports cancer cell growth within hypoxic CSF in LM.
Cancer cells employ LCN2 to collect sparse extracellular iron in the CSF
In the absence of disease, CSF contains minimal extracellular iron. To investigate the levels of this micronutrient in LM, we assayed total iron levels by mass spectroscopy in the CSF of cancer patients. We found that total iron concentration and the proportion of iron bound to LCN2 was increased in the CSF of patients with LM compared with patients without LM, (fig. S10A and B). In addition, patient CSF LCN2 levels correlated with iron concentration (table S3). Reflecting the importance of inflammatory signaling, CSF iron levels also correlated with IL-6 and hepcidin. Turning to our mouse models, we found that LCN2 gene expression was upregulated in LeptoM cells when compared with Par cells (fig. S4D and fig. S10C). In vivo, LCN2 knockdown by shRNA was partially rescued through addition of iron-loaded transferrin (Fig. 5A–B, and fig. S10D to F), suggesting that iron transport plays a key role in LCN2-dependent cancer cell growth in the CSF. To investigate this further, we examined iron uptake in these LeptoM cells in vitro. Inhibition of either SLC22A17 or LCN2 expression in LeptoM cells by shRNA in vitro inhibited iron accumulation and cell growth (fig. S10G to I). Intracellular iron accumulation and cell growth were rescued by addition of exogenous transferrin (fig. S10G to I).
Fig. 5. LCN2 transports iron to support cancer cell growth.

(A) Tumor growth in mice injected with MDA231-LeptoM cells expressing shCtl or shLCN2. Treatment with either vehicle or 5 mg/mL holo-transferrin (diferric [Tf]) began on day 1 and continued every third day for a total of 7 doses. Left: Histogram represents in vivo BLI imaging post-inoculation at day 21. n = 8–10 per group in each of two independent experiments. Right: Representative BLI images. ** indicates p < 0.01 (unpaired t test). Data represent mean ± SEM. (B) Kaplan-Meier survival curve of LeptoM groups from (A). sh1 + Veh vs sh1 + Tf , p < 0.0001. sh2 + Veh vs sh2 + Tf, p < 0.0001. (C) Soluble iron concentration from macrophages collected from CSF in lipopolysaccharide (LPS)-stimulated, LeptoM or LeptoM-shLCN2 (sh1 and sh2) mouse model at day 14. Soluble iron was measured by mass spectroscopy. n = 4 per group. ** indicates p < 0.01, *** indicates p < 0.001, **** indicates p < 0.0001 (unpaired t test). Data represent mean ± SEM. (D and E) Phagocytosis (D) and reactive oxygen species (ROS) generation (E) in CSF-derived macrophages by flow cytometric analysis after LeptoM (LLC model), shLCN2 LPS, or vehicle (Ctl) treatment. Phagocytosis detected by FITC-labeled E. coli. CellROX Green+ cells represent percent of live cells with ROS. n = 12–15 (Ctl), n = 4–5 (LPS), n = 11–18 (LeptoM), n = 8 (shLCN2). NS = not significant, * indicates p < 0.05, ** indicates p < 0.01, **** indicates p < 0.0001 (unpaired t test). Data represent mean ± SEM in two independent experiments. (F) Tumor growth in MDA231-LeptoM model after chelator treatment: deferoxamine (DFO), D-penicillamine (D-Pen) on day 0 (early) or day 7 (late); see also Fig. S11. Left: in vivo BLI imaging in day 28 post-inoculation. n = 8–10 per group in each of two independent experiments. Right: Representative BLI images. **** indicates p < 0.0001. Data represent mean ± SEM. (G) Kaplan-Meier survival curve of mice treated in (F). p < 0.0001.
To generate reactive oxygen species, activated macrophages have a heightened need for iron(22). We hypothesized that macrophages within the CSF, particularly in LM, have lower iron stores than macrophages circulating in the blood. To address this, we studied the syngeneic LLC-LeptoM mouse model (table S2). We collected macrophages from either the CSF or the spleen in the setting of LM or after challenge with lipopolysaccharide (LPS) (Fig. 5F). We found that the intracellular iron content of CSF macrophages declined significantly in the setting of LM when compared with LPS treatment (Fig. 5C and fig. S10J). We also found that shRNA-mediated knockdown of cancer cell LCN2 expression increased macrophage iron content (Fig. 5C and fig. S10K). Finally, we found that the impairment of iron uptake in the CSF has functional consequences for these macrophages: both respiratory burst and phagocytosis were impaired in the setting of LM in a LCN2-dependent fashion (Fig. 5D–E). Together, these observations are consistent with a model in which inflammatory signals promote cancer cell LCN2 production. This, in turn, allows cancer cells to acquire the iron that is present in limiting amounts in CSF, which not only supports their own growth but inhibits iron uptake and iron-dependent functional activities of macrophages.
Analysis of iron chelation therapy for LM in mice
Because iron is limiting in the CSF, we reasoned that iron chelation might impair cancer cell growth in the CSF and tested this hypothesis in our mouse models (table S2). We inoculated recipient mice with either MDA231-LeptoM or PC9-LeptoM cells and treated them intracisternally with vehicle, the iron chelator deferoxamine (DFO), or the copper chelator D-penicillamine (D-Pen) on day 0 or day 7 after engraftment and every 3 days thereafter (Fig. S11A–B). DFO treatment substantially suppressed iron levels within the LeptoM cells as well as their growth (Fig. 5F, and fig. S11, C to F). Importantly, DFO treatment conferred a survival benefit to the MDA231 and PC9 mouse models compared with vehicle control (Fig. 5G, and fig. S11G–H, and table S4). As expected for this chelator treatment, we found that iron concentration in the CSF from DFO treated mice was decreased at day 28 compared to that in control mice (Fig. S11I–J). The number of CSF macrophages was slightly reduced by the D-Pen or DFO treatment, whereas the numbers of neutrophils, T cells and monocytes were not affected (Fig. S11K–L).
Discussion
Circulating immune cells routinely encounter nutritionally sparse environments as they migrate from the circulation into the tissues. Indeed, immune cells employ a discrete set of transcriptional programs to make use of limited resources, including iron and oxygen. In the case of inflammatory macrophages, interferon-γ signaling promotes generation of nitric oxide (23), impairing oxidative phosphorylation (OXPHOS) (24) and allowing for generation of reactive oxygen species (ROS) (25).
Cancer cells cope with challenging environmental constraints differently from immune cells. The genetic heterogeneity of cancer cells provides these cells with a selective advantage over other cell types. To study cellular competition for sparse nutrients at human scale, we applied single-cell RNA-Seq to patient-derived samples of LM, a lethal complication of cancer. In doing so, we uncovered a specific example of how the dynamic transcriptional heterogeneity of cancer cells can confer a functional selective advantage (26–28). We found that cancer cells make use of LCN2/SLC22A17, a high-affinity iron collection system that enables them to effectively outcompete other cells in the leptomeninges for sparse environmental iron. The other major iron-utilizing cell in the CSF, the macrophage, is rendered iron-deficient by this process, resulting in impaired respiratory burst and phagocytosis.
The leptomeninges pose unique constraints on both the infiltrating immune system and cancer cells; we found that inter-cellular signaling is substantially altered within the leptomeningeal space. Investigators studying other experimental systems focused on extracranial sites have observed macrophage LCN2 generation(29), promoting cancer cell migration and invasion(13, 30). In LM, CSF macrophages do not produce LCN2. Rather, the inflammatory microenvironment promotes the generation of LCN2 in cancer cells. As obligate partners for cancer cell migration, invasion and metastasis, tumor-associated macrophages are well known to alter the behavior of cancer cells (31). The evolutionary dynamics that we have discovered between malignant and non-malignant cells within the leptomeninges reveal both the robust nature of cancer’s transcriptional plasticity and highlight microenvironmental vulnerabilities ripe for therapeutic exploitation.
Supplementary Material
Acknowledgements:
We are deeply grateful to the patients and families who donated clinical samples for this research.
Funding: This work was supported by NCI P30 CA008748; NCI R35 CA220508 (to C.I.D.), NCI 1U2CCA233284 (to D.P.), The Pew Charitable Trusts GC241069 (to A.B.), The Damon Runyon Cancer Research Foundation GC240764 (to A.B.), The Pershing Square Sohn Cancer Research Alliance GC239280 (to A.B.), The Baker Family Foundation (to A.B.), The American Brain Tumor Association BRF1900019 (to J.R. and A.B.), The Robert J. Kleberg, Jr and Helen C. Kleberg Foundation (to C.I.D.), The Alan and Sandra Gerry Metastasis and Tumor Ecosystems Center (to D.P.).
Footnotes
Competing interests: A.B. is an inventor on United States Provisional Patent Application No.: 62/258,044 “Modulating Permeability of The Blood Cerebrospinal Fluid Barrier” filed by Memorial Sloan Kettering Cancer Center. A.B. is an unpaid member of the Scientific Advisory Board of EVREN Technologies.
Data and materials availability: Single-cell and bulk RNA-sequencing data have been deposited to NCBI GEO as GSE150681 SuperSeries. Cell lines LLC-LeptoM, PC9-LeptoM and MDA231-LeptoM are available from A.B.
References:
- 1.Kesari S, Batchelor TT, Leptomeningeal metastases. Neurol Clin 21, 25–66 (2003). [DOI] [PubMed] [Google Scholar]
- 2.Oechsle K, Lange-Brock V, Kruell A, Bokemeyer C, de Wit M, Prognostic factors and treatment options in patients with leptomeningeal metastases of different primary tumors: a retrospective analysis. J Cancer Res Clin Oncol 136, 1729–1735 (2010). [DOI] [PMC free article] [PubMed] [Google Scholar]
- 3.Spector R, Robert Snodgrass S, Johanson CE, A balanced view of the cerebrospinal fluid composition and functions: Focus on adult humans. Exp Neurol 273, 57–68 (2015). [DOI] [PubMed] [Google Scholar]
- 4.Subira D et al. , Role of flow cytometry immunophenotyping in the diagnosis of leptomeningeal carcinomatosis. Neuro Oncol 14, 43–52 (2012). [DOI] [PMC free article] [PubMed] [Google Scholar]
- 5.Nemeth E et al. , IL-6 mediates hypoferremia of inflammation by inducing the synthesis of the iron regulatory hormone hepcidin. J Clin Invest 113, 1271–1276 (2004). [DOI] [PMC free article] [PubMed] [Google Scholar]
- 6.Yang J et al. , An iron delivery pathway mediated by a lipocalin. Mol Cell 10, 1045–1056 (2002). [DOI] [PubMed] [Google Scholar]
- 7.Goetz DH et al. , The neutrophil lipocalin NGAL is a bacteriostatic agent that interferes with siderophore-mediated iron acquisition. Mol Cell 10, 1033–1043 (2002). [DOI] [PubMed] [Google Scholar]
- 8.Kjeldsen L, Bainton DF, Sengelov H, Borregaard N, Identification of neutrophil gelatinase-associated lipocalin as a novel matrix protein of specific granules in human neutrophils. Blood 83, 799–807 (1994). [PubMed] [Google Scholar]
- 9.Mertens C et al. , Intracellular Iron Chelation Modulates the Macrophage Iron Phenotype with Consequences on Tumor Progression. PLoS One 11, e0166164 (2016). [DOI] [PMC free article] [PubMed] [Google Scholar]
- 10.Boire A et al. , Complement Component 3 Adapts the Cerebrospinal Fluid for Leptomeningeal Metastasis. Cell 168, 1101–1113 e1113 (2017). [DOI] [PMC free article] [PubMed] [Google Scholar]
- 11.Mertens C et al. , Macrophage-derived lipocalin-2 transports iron in the tumor microenvironment. Oncoimmunology 7, e1408751 (2018). [DOI] [PMC free article] [PubMed] [Google Scholar]
- 12.Jung M et al. , Lipocalin 2 from macrophages stimulated by tumor cell-derived sphingosine 1-phosphate promotes lymphangiogenesis and tumor metastasis. Sci Signal 9, ra64 (2016). [DOI] [PubMed] [Google Scholar]
- 13.Devireddy LR, Gazin C, Zhu X, Green MR, A cell-surface receptor for lipocalin 24p3 selectively mediates apoptosis and iron uptake. Cell 123, 1293–1305 (2005). [DOI] [PubMed] [Google Scholar]
- 14.Mosialou I et al. , MC4R-dependent suppression of appetite by bone-derived lipocalin 2. Nature 543, 385–390 (2017). [DOI] [PMC free article] [PubMed] [Google Scholar]
- 15.Hamzic N, Blomqvist A, Nilsberth C, Immune-induced expression of lipocalin-2 in brain endothelial cells: relationship with interleukin-6, cyclooxygenase-2 and the febrile response. J Neuroendocrinol 25, 271–280 (2013). [DOI] [PubMed] [Google Scholar]
- 16.Liu Q, Nilsen-Hamilton M, Identification of a new acute phase protein. J Biol Chem 270, 22565–22570 (1995). [DOI] [PubMed] [Google Scholar]
- 17.Flo TH et al. , Lipocalin 2 mediates an innate immune response to bacterial infection by sequestrating iron. Nature 432, 917–921 (2004). [DOI] [PubMed] [Google Scholar]
- 18.Moschen AR et al. , Lipocalin 2 Protects from Inflammation and Tumorigenesis Associated with Gut Microbiota Alterations. Cell Host Microbe 19, 455–469 (2016). [DOI] [PubMed] [Google Scholar]
- 19.Mosser DM, Edwards JP, Exploring the full spectrum of macrophage activation. Nat Rev Immunol 8, 958–969 (2008). [DOI] [PMC free article] [PubMed] [Google Scholar]
- 20.Torti SV, Torti FM, Iron and cancer: more ore to be mined. Nat Rev Cancer 13, 342–355 (2013). [DOI] [PMC free article] [PubMed] [Google Scholar]
- 21.Cha JH et al. , Prompt meningeal reconstruction mediated by oxygen-sensitive AKAP12 scaffolding protein after central nervous system injury. Nat Commun 5, 4952 (2014). [DOI] [PMC free article] [PubMed] [Google Scholar]
- 22.Cairo G, Recalcati S, Mantovani A, Locati M, Iron trafficking and metabolism in macrophages: contribution to the polarized phenotype. Trends Immunol 32, 241–247 (2011). [DOI] [PubMed] [Google Scholar]
- 23.Arts RJ et al. , Glutaminolysis and Fumarate Accumulation Integrate Immunometabolic and Epigenetic Programs in Trained Immunity. Cell Metab 24, 807–819 (2016). [DOI] [PMC free article] [PubMed] [Google Scholar]
- 24.Van den Bossche J et al. , Mitochondrial Dysfunction Prevents Repolarization of Inflammatory Macrophages. Cell Rep 17, 684–696 (2016). [DOI] [PubMed] [Google Scholar]
- 25.Mills EL et al. , Succinate Dehydrogenase Supports Metabolic Repurposing of Mitochondria to Drive Inflammatory Macrophages. Cell 167, 457–470 e413 (2016). [DOI] [PMC free article] [PubMed] [Google Scholar]
- 26.Azizi E et al. , Single-Cell Map of Diverse Immune Phenotypes in the Breast Tumor Microenvironment. Cell 174, 1293–1308 e1236 (2018). [DOI] [PMC free article] [PubMed] [Google Scholar]
- 27.Tirosh I et al. , Dissecting the multicellular ecosystem of metastatic melanoma by single-cell RNA-seq. Science 352, 189–196 (2016). [DOI] [PMC free article] [PubMed] [Google Scholar]
- 28.Lavin Y et al. , Innate Immune Landscape in Early Lung Adenocarcinoma by Paired Single-Cell Analyses. Cell 169, 750–765 e717 (2017). [DOI] [PMC free article] [PubMed] [Google Scholar]
- 29.Jung M et al. , Interleukin-10-induced neutrophil gelatinase-associated lipocalin production in macrophages with consequences for tumor growth. Mol Cell Biol 32, 3938–3948 (2012). [DOI] [PMC free article] [PubMed] [Google Scholar]
- 30.Duan X et al. , Tumor associated macrophages deliver iron to tumor cells via Lcn2. Int J Physiol Pathophysiol Pharmacol 10, 105–114 (2018). [PMC free article] [PubMed] [Google Scholar]
- 31.Condeelis J, Pollard JW, Macrophages: obligate partners for tumor cell migration, invasion, and metastasis. Cell 124, 263–266 (2006). [DOI] [PubMed] [Google Scholar]
Associated Data
This section collects any data citations, data availability statements, or supplementary materials included in this article.