

Abstract
Effective and sustained inhibition of non-enzymatic oncogenic driver proteins represents a major pharmacologic challenge. The clinical success of thalidomide analogs demonstrates the therapeutic efficacy of drug-induced degradation of transcription factors and other cancer targets1–3, but a significant subset of proteins are recalcitrant to targeted protein degradation using current approaches4,5. Here we report an alternative mechanism, whereby a small molecule induces highly specific, reversible polymerization, sequestration into cellular foci, and subsequent degradation of a target protein. BI-3802 is a small molecule that binds the BTB domain of the oncogenic transcription factor BCL6 and results in proteasomal degradation6. We used cryo-EM to reveal how the solvent-exposed moiety of a BCL6 inhibitor contributes to a composite ligand/protein surface that engages BCL6 homodimers to form a supramolecular structure. Drug-induced formation of BCL6 filaments facilitates ubiquitination by the SIAH1 E3 ubiquitin ligase. Our findings demonstrate that a small molecule can induce polymerization coupled to highly specific protein degradation, which in the case of BCL6 leads to superior pharmacological activity. These findings create new avenues for the development of therapeutics and synthetic biology.
Small molecule-induced protein degradation has emerged as a powerful therapeutic strategy, as demonstrated by the clinical efficacy of thalidomide analogs for the treatment of hematologic malignancies. Thalidomide analogs, including lenalidomide and pomalidomide, modulate the activity of the CUL4-RBX1-DDB1-CRBN (CRL4CRBN) E3 ubiquitin ligase to recruit and ubiquitinate neo-substrates including IKZF1, IKZF3, and CK1α, which leads to their proteasomal degradation1–3. Other small molecules including hetero-bifunctional degraders (also known as PROTACs)7 have been developed to degrade a wide range of clinically relevant targets including kinases4, nuclear receptors8 and epigenetic enzymes9. These small molecule degraders engage both the E3 ligase and the target protein substrate, to promote formation of a substrate-drug-ligase ternary complex10–12. While degraders can show remarkable efficacy and sustained target depletion, some proteins have proven recalcitrant to this approach. One such example is the B cell lymphoma 6 (BCL6) protein, for which hetero-bifunctional degraders have shown insufficient target modulation to induce growth inhibition5.
BCL6 is a promising drug target for non-Hodgkin lymphomas including diffuse large B cell lymphoma (DLBCL)13,14 and follicular lymphoma15. Pathologically increased BCL6 expression, as a result of somatic BCL6 translocation, exonic mutation, promoter mutation, or mutations in regulatory pathways, is a common driver of B cell malignancies16. In genetically engineered mice, overexpression of BCL6 is sufficient to drive lymphoma development17. BCL6 acts as a master transcriptional repressor enabling rapid expansion of germinal center (GC) B cells and tolerance to genomic instability caused by hypermutation of the immunoglobulin genes and class switch recombination16. BCL6 represses a broad range of genes involved in the DNA damage response18, cell cycle checkpoints19, and differentiation20. As expected, knock-out of BCL6 in lymphoma cells results in tumor stasis21. Several peptide and small molecule inhibitors targeting BCL6 have shown efficacy in vivo, but only at high concentrations, which has limited their translation into clinical therapeutic agents13,14.
Screens for novel BCL6 inhibitors led to the identification of small molecules that unexpectedly induce BCL6 degradation, including BI-38026. These molecules bind the Broad complex/Tramtrack/Bric-a-brac (BTB) domain, which mediates BCL6 homodimerization and its interactions with co-repressor proteins22. BI-3802 induces rapid ubiquitination and degradation of BCL6, resulting in profound de-repression of BCL6 target genes and anti-proliferative effects in DLBCL cell lines, comparable to a genetic knock-out21, and superior to non-degrading BCL6 inhibitors such as BI-3812 or heterobifunctional BCL6 degraders5,6. To uncover the underlying basis of this superior pharmacology, we sought to determine the mechanism by which BCL6 is degraded by BI-3802.
BI-3802 induces specific BCL6 degradation
To determine the specificity of BI-3802 as a degrader of BCL6 (Fig. 1a), we performed quantitative mass spectrometry (MS) based proteomics in SuDHL4 cells, a DLBCL-derived cell line, following compound treatment for 4 hours. BCL6 was the only protein with significantly decreased abundance (Fig. 1b). BI-3802 efficiently depleted chromatin-bound BCL6 (Extended Data Fig. 1a) and did not alter BCL6 mRNA expression (Extended Data Fig. 1b). Treatment with the structurally similar BCL6 inhibitor BI-3812 (Fig. 1a) did not alter the abundance of any protein (Extended Data Fig. 1c).
Fig. 1 |. BI-3802 treatment induces reversible BCL6 foci formation in vivo.

a, Chemical structures of BI-3802 (BCL6 degrader) and BI-3812 (BCL6 inhibitor) with solvent exposed moieties in red and blue respectively. b, Whole-proteome quantification of SuDHL4Cas9 cells treated with 1 μM BI-3802 (n = 1) or DMSO (n = 3) for 4 hours (two-sided moderated t-test, n = 3). c, Schematic of the BCL6 stability reporter. d, Flow cytometry analysis of HEK293TCas9 cells expressing the full length eGFPBCL6FL reporter after treatment with DMSO, 0.5 μM MLN7243, 5 μM MLN4924 or 10 μM MG132 for 3 hours in total. After 2 hours, DMSO, 1 μM BI-3812 or 1 μM BI-3802 were added for 1 hour (bars represent mean, n = 3). e, Flow cytometry analysis of HEK293TCas9 cells expressing the indicated BCL6 reporter treated with DMSO or 1 μM BI-3802 for 7 hours (bars represent mean, n = 3). f, g, Localization of eGFPBCL61−275 or eGFPBCL61−250 expressed in HEK293TCas9 cells treated with DMSO, 1 μM BI-3802 or 10 μM BI-3812 (n = 2). Scale bars are 5 μm.
To identify the critical region of BCL6 that mediates drug-induced degradation, we generated a fluorescent reporter system in HEK293T cells, in which the full length BCL6 (BCL6FL) is fused in-frame with eGFP followed by an internal ribosome entry site (IRES) and mCherry (Fig. 1c)23. BI-3802 induced degradation of the full-length BCL6 reporter, while the inhibitor, BI-3812, did not alter stability of the reporter. BI-3802-induced degradation of eGFPBCL6FL, was attenuated by chemical inhibition of the 26S proteasome with MG132 or inhibition of the ubiquitin activating enzyme UBA1 by MLN7243, but not by inhibition of the neddylation pathway with MLN4924, which is required for activity of the Cullin-RING family of E3 ubiquitin ligases (Fig. 1d, Extended Data Fig. 1d, e).
Analysis of stepwise C-terminal truncations of the BCL6 protein in our reporter demonstrated that the first 275 amino acids, which include the drug-binding BTB domain, are sufficient for BI-3802 degradation (Fig. 1e). These studies demonstrate that BI-3802 induces selective degradation of BCL6, that degradation is mediated by a non-Cullin E3 ubiquitin ligase, and that a 275 amino acid region is sufficient for drug-dependent degradation.
BI-3802 induces cellular BCL6 foci
We next examined the cellular localization of the BCL6-eGFP fusion construct upon exposure to BI-3802 by live cell fluorescence microscopy. Strikingly, we observed the appearance of distinct eGFP-containing foci within minutes of BI-3802 treatment for both the full length BCL6 construct and the minimal degradable construct eGFPBCL61−275 (Fig. 1f, Supplementary Videos 1-7). The eGFP signal and foci subsequently disappeared, consistent with BCL6 degradation. Immunofluorescence studies in SuDHL4 cells confirmed that endogenous BCL6 also formed foci upon treatment with BI-3802 (Extended Data Fig. 1f). Addition of an excess of the BCL6 inhibitor, BI-3812, which competes for the same binding site on the BCL6-BTB domain, efficiently blocked BI-3802-induced BCL6 degradation (Extended Data Fig. 1g). To interrogate the dynamics of drug-induced foci formation, we generated a BTB containing, non-degradable eGFPBCL61−250 construct. This construct formed BI-3802-induced foci that persisted even after prolonged drug treatment (Fig. 1g). These drug-induced foci were fully reversible by addition of excess BI-3812 (Fig. 1g).
BI-3802 induces BCL6 polymerization
To explore the molecular basis of BCL6 foci formation, we sought to examine the behavior of recombinant BCL6 in vitro. During purification of BCL6 recombinant protein, we noted that the presence of BI-3802, but not BI-3812, led to higher molecular weight species of BCL6 (Fig. 2a). Given the formation of reversible cellular foci upon BI-3802 treatment, we hypothesized BCL6 might form regular higher-order structures upon binding to BI-3802, which we examined by negative stain electron microscopy (EM). In the absence of BI-3802, BCL6 is present as monodisperse particles. However, upon incubation of BCL6 with BI-3802, we observed the formation of regular structures with a sinusoidal shape (Fig. 2b).
Fig. 2. |. BI-3802 induces helical filament of BCL6 in vitro.

a, Size-exclusion chromatogram of purified BCL65−360 in DMSO, 2 μM BI-3812 or 2 μM BI-3802. b, Negative stain electron microscopy micrographs of BCL65−360 protein in DMSO or 20 μM BI-3802. Scale bars are 100 nm (n > 10 images). c, A BCL6-BTB filament constructed by extending the F2F_2 model (Extended Data Fig. 2) by RosettaDock. d, Reference-free 2D class averages for a BCL6-BTB filament. Scale bar is 10 nm. e, Cryo-EM model of the BCL6-BTB filament with BI-3802. Each BCL6 dimer is labeled in a distinct color. Close-up of the interface highlighting critical residues for polymerization. f, Localization of eGFPBCL6 alanine mutants after treatment with 0.5 μM MLN7243 (3 hours) and 1 μM BI-3802 (1 hour) (n = 2). Scale bars are 5 μm. g, Alanine mutagenesis screen of BCL6-BTB domain for resistance to 1 μM BI-3802 in SuDHL4Cas9 cells. Mutations that confer resistance are labeled. Four different codons were collapsed to each unique amino acid position (> 1.6-fold enrichment, p-value <10−2; n = 2; 4 codons/position; two-sided empirical rank-sum test-statistics).
To model the filaments, we computationally docked two BCL6-BTB domain dimers (PDB: 5MW2) in the presence of BI-3802 to determine energetically favorable binding modes, and extended the structure by sequentially aligning dimers in the same binding mode to obtain polymer models (Extended Data Fig. 2). Only a symmetric association of two dimers with two molecules of BI-3802 at the interface (Extended Data Fig. 2) gave rise to a helical superstructure approximating the pitch and the shape observed by negative stain EM (Fig. 2c).
To understand the helical assembly at the molecular level, we examined the structure of BI-3802-induced BCL6 filaments by cryo-electron microscopy (cryo-EM). Consistent with the model and negative stain data, the cryo-EM micrographs show well-dispersed helical filaments (Extended Data Fig. 3a). Two-dimensional class averages revealed flexibility and variations in helical pitch, suggesting that the data is not suitable for helical processing (Fig. 2d)24. We therefore performed single-particle analysis, treating a BCL6-BTB homo-octamer as one particle, leading to a three-dimensional reconstruction at a nominal resolution of 3.7 Å but with significant preferred orientations (Fig. 2e, Extended Data Fig. 3b-g, Extended Data Table 1, Methods).
The crystal structure of BCL6-BTB bound to BI-3802 (PDB: 5MW2) was readily fitted into the cryo-EM density. At the interface between BCL6 dimers, we observed density representing BI-3802, overlapping with the location of the compound in the crystal structure (Extended Data Fig. 4a, b). BI-3802 binds a groove between BCL6 dimers, directly in contact with Y58 of BTB α, and facilitates higher order assembly through hydrophobic interactions of the compound with C84 on an adjacent BCL6 dimer (BCL6 γ/δ). In addition to the compound-mediated interaction between BCL6 dimers, the new intermolecular interface comprises a key interaction between R28 of BTB β and E41 of BTB γ (Fig. 2e). The resulting interface from our cryo-EM model resembles the interface seen in the crystallographic lattice of the BCL6-BTB dimer in the BI-3802 co-crystal structure (PDB: 5MW2, Extended Data Fig. 4c, d). Modeling the structurally similar BCL6 inhibitor, BI-3812, onto the cryo-EM structure reveals a steric clash with the extended carboxamide group and explains the lack of BCL6 polymerization (Fig. 2a, Extended Data Fig. 4e) and consequent lack of degradation (Extended Data Fig. 1c).
To determine whether BCL6 polymerization is required for foci formation in cells, we introduced and assayed mutations designed to impair drug binding or the dimer-dimer interaction. Mutation of Y58 to alanine in BCL6 prevents BI-3802 binding in vitro (Extended Data Fig. 4f) and consequently BCL6 foci formation in cells (Fig. 2f). R28 and E41 form a salt bridge critical for dimer-dimer interaction (Fig. 2e), and mutations R28A or E41A prevented foci formation upon BI-3802 treatment (Fig. 2f). Importantly, the E41A substitution did not impair drug binding to BCL6 (Extended Data Fig. 4f). In addition, C84 forms a hydrophobic interaction with the methyl group of the neighboring BI-3802 molecule (Fig. 2e), and a C84A mutation significantly reduced foci formation in cells (Fig. 2f). Together, these results demonstrate that mutation of the BCL6 amino acids that are critical for dimer-dimer interactions disrupts drug-induced polymerization.
To identify key amino acids that are critical for BI-3802 activity in an unbiased fashion, we performed a systematic alanine scan of the BTB domain (residues 32–99). We evaluated the effect of each mutation on BI-3802 cellular toxicity in SuDHL4 lymphoma cells (Fig. 2g, Extended Data Fig. 5a) and on BI-3802-induced degradation of the BCL6 reporter in HEK293T cells (Extended Data Fig. 5b, c), from which we selected the top 4 residues for detailed validation (E41A, G55A, Y58A, and C84A). Overexpression of these variants in the BCL6-dependent SuDHL4 and Raji cell lines conferred resistance to BI-3802 but had no effect in the BCL6-independent DEL cell line (Extended Data Fig. 5d, e). In agreement with our structural analysis, the residues identified in this unbiased mutagenesis experiment were located either close to the drug-binding site (G55A, Y58A), likely preventing drug-binding, or on the polymerization interface (E41A, C84A) (Extended Data Fig. 5f). Together, the cryo-EM and mutagenesis studies established that BI-3802 induces polymerization of BCL6, and that blocking BCL6 polymerization impairs foci formation, BCL6 degradation, and BI-3802 cellular toxicity in lymphoma cells.
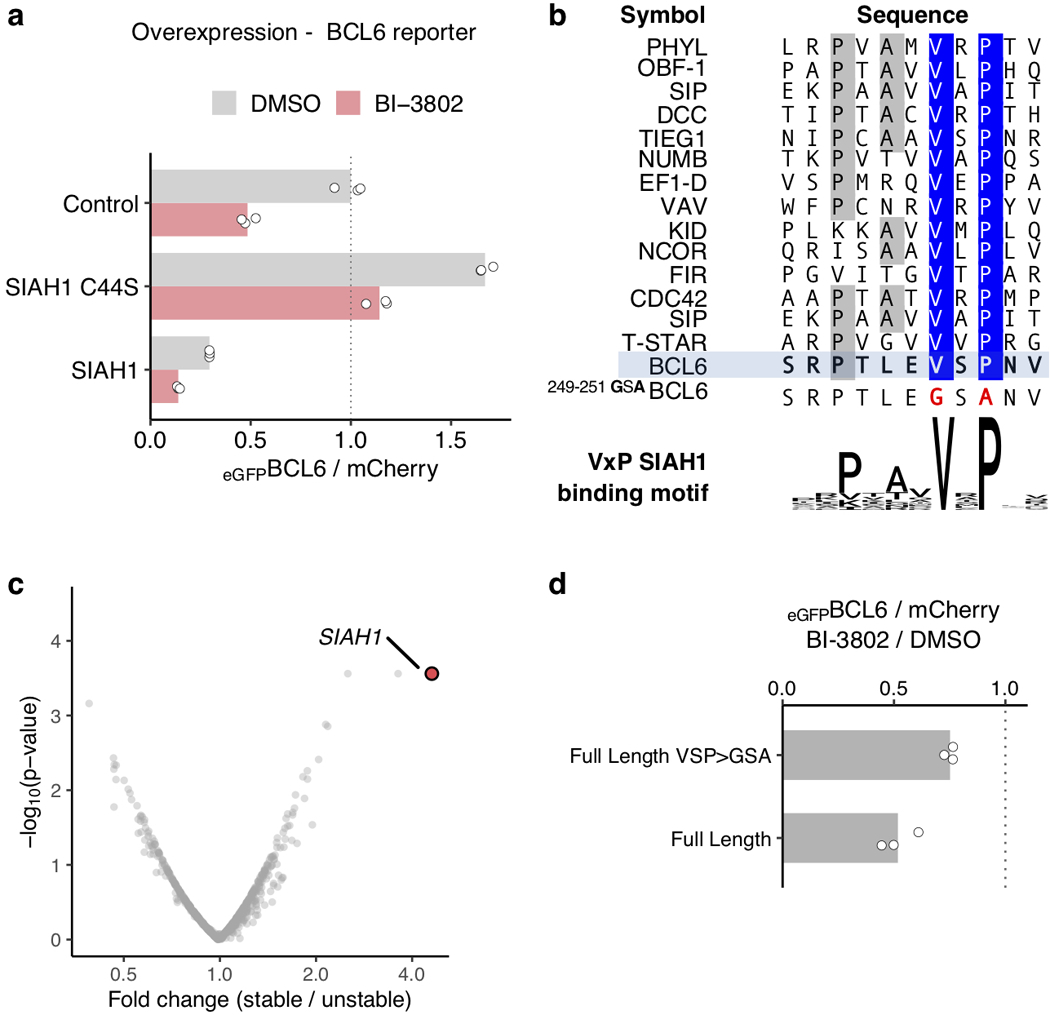
SIAH1 is involved in degradation of polymerized BCL6
We next sought to identify the cellular machinery necessary for BI-3802-induced BCL6 degradation. We employed two complementary, genome-scale CRISPR-Cas9 genetic screens to interrogate the mechanism of drug-induced BCL6 degradation. First, we performed a flow cytometry-based BCL6 reporter screen in HEK293T cells, where cells infected with the sgRNA library were treated with BI-3802 or DMSO, and cell populations with increased (highest 5% eGFP/mCherry ratio) or decreased (lowest 5% eGFP/mCherry ratio) levels of eGFPBCL6FL were sorted from the bulk population (Extended Data Fig. 6a-d). Second, we performed a BI-3802 resistance screen in SuDHL4 cells (Extended Data Fig. 6e, f). The only gene that scored significantly in both screens was the non-cullin E3 ubiquitin ligase SIAH1 (Fig. 3a).
Fig. 3. |. BCL6 polymerization enhances SIAH1 interaction and ubiquitination.

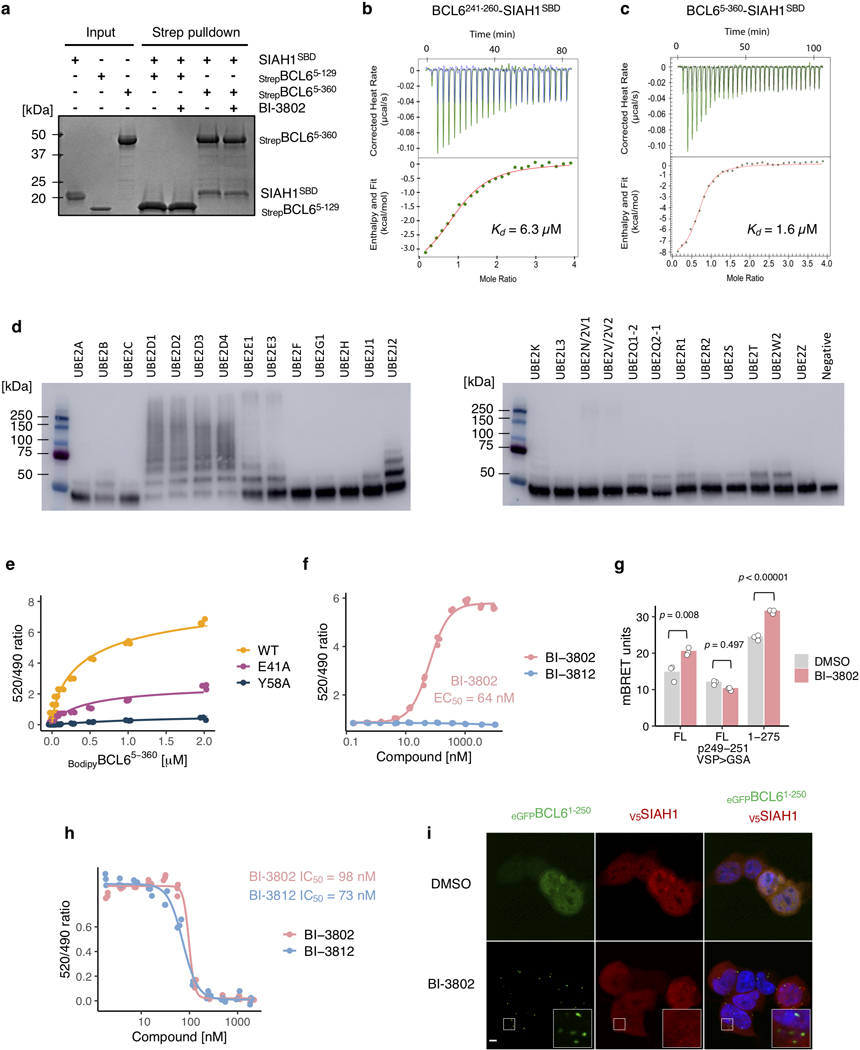
a, Correlation of p-values for two genome-wide CRISPR-Cas9 knockout screens: x-axis - reporter screen for eGFPBCL6 stability in HEK293TCas9 cells upon BI-3802 treatment, and y-axis - BI-3802 resistance screen in SuDHL4Cas9 cells. Guides were collapsed to gene level (n = 3; 4 guides/gene; two-sided empirical rank-sum test-statistics). b, Flow cytometry analysis of HEK293TCas9 cells expressing the indicated BCL6-BTB domain fusion construct treated with DMSO or 1 μM BI-3802 for 7 hours (bars represent mean, n = 3). c, Immunoblots of eGFP immunoprecipitation in the presence of 2μM BI-3802 or DMSO from HEK293TCas9 cells transduced with indicated eGFPBCL6 constructs and V5SIAH144C>S (n = 2). d, Immunoblots of StrepBCL65−360 in vitro ubiquitination by SIAH1FL in the presence of DMSO or 1 μM BI-3802 (n = 2). e, BodipyBCL65−360 was titrated to 0.2 μM BiotinSIAH1SBD in DMSO, 2 μM BI-3812, or 2 μM BI-3802, and the signal was measured by TR-FRET. Lines represent standard four parameter log-logistic curve fit (n = 3). f, HEK293TCas9 cells expressing the eGFPBCL61−275 reporter and V5SIAH1 were treated with 0.5 μM MLN7243 for 2 hours, and 1 μM BI-3802 for 1 hour. Cells were imaged by indirect immunofluorescence as indicated (n = 2). Scale bar is 5 μm.
To validate the role of SIAH1 in drug-induced BCL6 degradation and resistance to BI-3802, we targeted SIAH1 with multiple independent sgRNAs. Each sgRNA attenuated eGFPBCL6FL degradation upon BI-3802 treatment and induced resistance to BI-3802 treatment (Extended Data Fig. 6g, h). Overexpression of wild-type SIAH1 not only enhanced BI-3802-dependent BCL6 degradation, but also reduced BCL6 abundance in the absence of drug (Extended Data Fig. 7a), implicating a role of SIAH1 in both drug-dependent and endogenous BCL6 degradation. The SIAH1 E3 ligase recognizes a VxP motif on substrate proteins25,26, and this motif is present in BCL6 residues 249–251 (Extended Data Fig. 7b). Deletion of the VxP motif provides an explanation for our C-terminal truncation analysis, in which BCL61−275 was effectively degraded in the presence of BI-3802 but BCL61−250 was not, despite the ability of this shorter construct to form foci in the presence of drug (Fig. 1e, g). Direct C-terminal fusion of the VxP-containing peptide (BCL6241−260) to the BTB domain (BCL61−129) was sufficient for BI-3802-induced degradation mediated by SIAH1 (Extended Data Fig. 7c), and degradation was attenuated by mutation of the BCL6 VxP motif (VSP > GSA) (Fig. 3b, Extended Data Fig. 7d). In this BTB-SIAH1 degron construct, mutations in the BTB domain critical for polymerization (R28A, E41A, C84A) or drug binding (G55A, Y58A) completely abolished BI-3802-induced degradation. Together these data demonstrate that SIAH1 is an E3 ligase involved in BI-3802-induced BCL6 degradation.
To examine whether the BCL6 VxP motif mediates the interaction with SIAH1, we performed co-immunoprecipitation studies with catalytically inactive SIAH144C>S. We found that BCL6 and SIAH1 co-immunoprecipitate in cells (Fig. 3c) and in vitro using recombinant proteins (Extended Data Fig. 8a), and that mutation or deletion of the VxP motif prevented the co-immunoprecipitation. The VxP-containing peptide alone (BCL6241−260) was sufficient for SIAH1 interaction (Extended Data Fig. 8b, c). In vitro ubiquitination assays with recombinant proteins demonstrated that BCL6 is a substrate for SIAH1 (Extended Data Fig. 8d), and that the rate and magnitude of ubiquitination is accelerated by BI-3802 (Fig. 3d). Together, these data establish SIAH1 as a bona-fide E3 ligase for BCL6.
To investigate how BI-3802-induced BCL6 polymerization affects SIAH1-mediated degradation, we examined SIAH1 recruitment and BCL6 ubiquitination both in vitro and in cells. Using a time-resolved fluorescence energy transfer (TR-FRET) assay, we observed moderate baseline affinity between BCL6 and SIAH1, which is strongly enhanced for BI-3802-polymerized BCL6 (KDapp = 0.2 μM) (Fig. 3e, Extended Data Fig. 8e). We found that BI-3802 increased the interaction between BCL6 and SIAH1 (EC50 = 64 nM) both in vitro (Extended Data Fig. 8f) and in cells (Extended Data Fig. 8g), while BI-3812 did not influence the BCL6-SIAH1 interaction, despite comparable affinity of both BI-3802 and BI-3812 to BCL6 (Extended Data Fig. 8h). Finally, in the presence of BI-3802, SIAH1 colocalizes to BCL6 foci in a VxP motif dependent manner (Fig. 3f, Extended Data Fig. 8i). Together, our in vitro and cellular assays indicate that BI-3802-induced polymerization enhances the interaction between BCL6 and SIAH1, leading to accelerated ubiquitination and degradation of BCL6.
Discussion
Through a combination of functional screens, biochemical dissection and structural characterization, we demonstrate that BI-3802 binding to the BCL6-BTB domain triggers higher order assembly of BCL6 into filaments. Polymerization promotes ubiquitination of BCL6 by SIAH1, an E3 ligase that recognizes a VxP motif distal to the drug binding site, and proteasomal degradation. BI-3802 results in formation of intracellular foci containing BCL6 and SIAH1. These findings represent a novel mechanism by which a small molecule inactivates a target through specific drug-induced protein polymerization and subsequent degradation.
Structurally, BI-3802 and BI-3812, a BCL6 degrader and an inhibitor, respectively, differ only in their solvent-exposed dimethyl-piperidine moiety. BI-3802 induces polymerization of the BCL6-BTB domain and foci formation in cells while BI-3812 does not. The cryo-EM structure presented here reveals that the dimethyl-piperidine moiety of BI-3802 interacts directly with distal amino acids on an adjacent BTB domain homodimer. Due to the symmetry of the BTB domain, BI-3802 can iterate this dimer-dimer interaction to assemble supramolecular filaments. A previous study has shown that introduction of amino acid mutations on the surface of symmetric proteins can trigger supramolecular self-assembly27. Since the solvent-exposed moiety in BI-3802 triggers BCL6 polymerization, it is possible that modification of the solvent-exposed part in a small molecule could induce new protein-protein interactions more generally, as we have recently shown for a kinase inhibitor28. In the case of symmetric proteins, small molecules have the potential to induce polymerization which can then lead to degradation with extraordinary specificity.
BI-3802, as well as structurally related bioavailable analogs29, have markedly increased activity against lymphoma cells compared to BI-38126, which is likely due to the combined effects of inhibiting co-activator binding, sequestering BCL6 into foci, and degrading BCL6. It has been previously shown that inhibition of BCL6 or degradation by PROTACs results in insufficient inhibition of downstream targets and consequently only minor anti-proliferative effects5. The unique mechanism of action of BI-3802 overcomes these limitations and helps to explain its improved efficacy. In fact, the antiproliferative and transcriptional effect of BI-3802 is comparable to knock-out of BCL6 using an inducible CRISPR-Cas9 system21. The molecular details provided here enable optimization towards this mechanism of action, which could advance the development of therapeutics targeting malignancies driven by aberrant BCL6 activity.
Drug-induced polymerization expands the repertoire of pharmacologic modalities that mediate targeted protein degradation as shown here for BCL6, with likely applications to other transcription factors and proteins with internal symmetry that have traditionally been difficult to drug. A subtle derivatization in solvent-exposed moiety distinguishes BI-3802 from BCL6 inhibitors that do not induce degradation, providing a potential path towards the rational design of molecules that induce polymerization.
Methods
Mammalian cell culture
The human HEK293T, SuDHL4Cas9, RajiCas9, and DELCas9 cell lines were provided by the Genetic Perturbation Platform, Broad Institute30. HEK293TCas9 was previously published12. HEK293TCas9 cells were cultured in DMEM (Gibco) and SuDHL4Cas9 RajiCas9, and DELCas9 cells in RPMI (Gibco), with 10% FBS (Invitrogen), glutamine (Invitrogen) and penicillin–streptomycin (Invitrogen) at 37 °C and 5% CO2.
Compounds
BI-3802 and BI-3812 were obtained from opnMe, Boehringer Ingelheim, MLN7243 (CT-M7243) from ChemieTek, MLN4924 (HY-70062) from MedChem Express, MG132 (S2619) from Selleck Chemicals, Chloroquine (C6628) from Sigma-Aldrich.
Primers
All primers used in this study are listed in Supplementary Table 1.
Antibodies
The following antibodies were used in this study: anti-BCL6 (Santa Cruz Biotechnology, sc-7388), anti-beta-tubulin (Cell Signaling, 2146S), anti-Hsp90 (Cell Signaling, 4874S), anti-HDAC1 (Cell Signaling, 2062S), anti-Histone H3 (Cell Signaling, 12648S), anti-eGFP (Cell Signaling, 2956), anti-V5-tag (ThermoFisher Scientific, MA5–15253), anti-Streptavidin (Sigma, 71591–3), anti-Mouse 800CW (LI-COR Biosciences, 926–32211), anti-Rabbit 680LT (LI-COR Biosciences, 925–68021), anti-mouse Alexa Fluor 633 (ThermoFisher Scientific, A-21052), and Alexa anti-mouse 488 (Biolegend, 405319).
Whole proteome quantification using tandem mass tag mass spectrometry
10 × 106 SuDHL4Cas9 cells were treated with DMSO, 1 μM BI-3802 or 1 μM BI-3812 for 4 h and cells were harvested by centrifugation. Samples were processed, measured and analyzed as previously described31. Data are available in the PRIDE repository (PXD016185).
Cellular fractionation
1 × 10⁶ SuDHL4Cas9 cells were treated with DMSO or 1 μM BI-3802 for 24 h and fractionated using the CelLytic™NuCLEAR™Extraction Kit (Sigma-Alrich) according to the manufacturer’s protocol, resolved on a polyacrylamide gel, and immunoblotted for the indicated targets.
Quantitative PCR
1 × 10⁶ SuDHL4Cas9 cells were treated with DMSO or 1 μM BI-3802 for 1 h, collected by centrifugation, washed with PBS, and flash frozen in dry ice. mRNA was isolated using the QIAGEN RNA kit (Qiagen, 74106). For cDNA synthesis, total RNA was reverse transcribed with SuperScript™ VILO™ Master Mix (Invitrogen, 11755050) before qPCR analysis with TaqMan Fast Advanced Master Mix (ThermoFisher Scientific, 4444557) for BCL6 (TaqMan, Hs02758991_g1, Life Technologies) and GAPDH (TaqMan, Hs02758991_g1). Reactions were run and analyzed on QStudio 6 FLX real-Time PCR System (ThermoFisher Scientific).
Immunoblots
SuDHL4Cas9 cells were treated as indicated in figure legends. 2 × 10⁶ cells were collected (1000 rpm, 5 min) and flash frozen in dry ice. Cells were lysed in 150 μL of lysis buffer (PBS + 0.25% NP-40 +125 U/ml Benzonase (Invitrogen), 1:100 Halt Protease and Phosphatase Inhibitor Cocktail (Thermo Scientific)) for 2 min at room temperature. The soluble fraction was separated by centrifugation (5000 rpm, 5 min). Protein lysates were mixed with Laemmli (SDS-Sample Buffer, Reducing, 6X, Boston BioProducts), resolved on a polyacrylamide gel, and immunoblotted for the indicated targets (Supplementary Figure 1).
Lentivirus production
In a 6-well plate format, 500,000 HEK293T cells were seeded per well in 2 mL medium. The next day, 3 μl of TransIT-LT1 (Mirus, MIR2305) were added to 15μl of OPTI-MEM (Invitrogen), incubated for 10 minutes, and combined with a mix consisting of 500 ng of the desired plasmid, 500 ng psPAX2, and 50 ng pVSV-G in 32.5 μl OPTI-MEM. The solution was incubated for 30 minutes at RT and 50 μl were added to HEK293T cells in a dropwise manner. The lentivirus containing medium was collected two days post-transfection and stored at −80°C.
Lentiviral transduction
Cells were infected by spin infection. 2 million cells per well in 2 ml of culture medium were transferred to a well of a 6-well plate. For constructs where puromycin selection was possible, 20% (volume/volume) of virus was added. For constructs where puromycin selection was not possible 50 % (volume/volume) of virus was added. The plates were centrifuged for 2 h (2000 rpm, 37 °C).
Degradation of BCL6 reporter constructs in HEK293T cells
The eGFPBCL6FL BCL6 stability vector was constructed by shuffling BCL6 from pDONR223-BCL6 (Broad Institute human ORFeome library) into a gateway compatible version of “Artichoke” by a LR gateway reaction. eGFPBCL61−250 / 1−275 / 1−360 / 1−500 / 1−129+Linker+241−260 / 1−129+Linker+241−260 VSP>GSA inserts were synthesized or PCR amplified with BsmBI sites and ligated into “Cilantro2” (Addgene #74450) by golden gate assembly. eGFPBCL6E41A / G55A / Y58A / C84A / R28A mutations were designed on the minimal construct containing the BTB domain fused to a linker and the SIAH1 binding site (BCL6 1–129+Linker+241–260 VSP>GSA), synthesized through IDT and ligated into “Cilantro2” by golden-gate assembly. Lentivirus was packaged in HEK293T cells using TransIT (Mirus) and subsequently used for spin infection.
HEK293TCas9 cells expressing indicated constructs in “Artichoke” or “Cilantro2” stability reporter vectors (PGK or SFFV Target – eGFP – IRES – mCherry, puromycin resistance) were plated in 96 well plates and treated for indicated times. BCL6-eGFP and mCherry expression were quantified by flow cytometry (Supplementary Figure 2). (CytoFLEX, Beckman or LSR Fortessa flow cytometer BD Biosciences). All degradation assays were done in at least triplicates. Geometric means of eGFP and mCherry fluorescent signals for live and mCherry positive cells were exported using flow cytometry analysis software (FlowJo, BD). Ratios of eGFP to mCherry were normalized to the average of DMSO-treated controls.
Live cell imaging
1 × 10³ HEK293T cells per cm2 were seeded in a μ-Slide 8 Well chamber (ibidi) and cultured for 18–24 h under standard growth conditions. Cell culture medium was exchanged to CO2 independent media (Gibco) and imaged with the DeltaVision Ultra High-Resolution Microscope (GE Healthcare, 100x lens, oil refraction index = 1.520). The following acquisition parameters were used: Image size 896 × 896 pixels, binning 1×1, GFP exposure time 0.08 sec, and the Neutral Density (%T) filter 32 %. To capture foci within all cell volume, around 26 μm per cell was imaged every 0.4 – 0.5 μm. Images were deconvolved (10 cycles, conservative conditions) and projected using maximal intensity by softWoRx® 7.0.0. Images for videos were taken every 10 minutes and combined to a video by QuickTime.
CytoSpin
0.8 × 10⁶ cells/mL SuDHL4Cas9 cells were treated with DMSO or 0.5 μM E1 Inhibitor (3 h) + 1 μM BI-3802 (1 h) and 200 μL of the cell suspension was immobilized on a slide using the Cytospin™ 4 Cytocentrifuge (CytoSpin 4, A78300003; 6000 rpm, 6 min). Medium was aspirated and cells were fixed with 4% formaldehyde diluted in warm PBS for 15 min at room temperature. Slides were washed three times for 5 min with PBS, blocked and permeabilized with blocking solution (5% Normal Goat Serum (Cell Signaling), 0.3% Triton X-100 in PBS) for 60 min and stained with anti-BCL6 antibody in blocking solution overnight at 4 °C. Cells were washed three times with PBS for 5 min each, incubated with Alexa Fluor 488-conjugated anti-mouse antibodies, washed with three times with PBS for 5 min each and covered with coverslip slides using Prolong®Gold Antifade Reagent (ThermoFisher, P36934). Cells were imaged using the DeltaVision microscope as described above.
Protein expression and purification
The human wild-type and mutant versions of BCL6 (Uniprot entry: A5PL18, residue 5–129 or 5–360) and SIAH1 variants (Uniprot Entry: Q8IUQ4, residue 90–282 (substrate binding domain, SBD) or full length), were cloned in pAC-derived vectors32. Baculovirus for protein expression (Invitrogen) was generated by transfection into Spodoptera frugiperda (Sf9) cells at a density of 0.9 × 10⁶ cells/mL grown in ESF 921 media (Expression Systems), followed by three rounds of infection in Sf9 cells to increase viral titer. Recombinant proteins were expressed and purified as N-terminal His6 C-terminal Spy (wild-type and mutant versions of BCL65−360), N-terminal Strep II-Avi (BCL65−129, BCL65−360, and SIAH1SBD), and N-terminal Flag (SIAH1FL) fusions in Trichoplusiani High Five insect cells using the baculovirus expression system (Invitrogen) as described previously33.
Negative stain electron microscopy (EM) analysis
To prepare grids for negative stain EM analysis of BCL6, Strep II-Avi BCL65−360 (0.6 mg/mL, 13.4 μM) in buffer (25 mM HEPES pH 7.4, 200 mM NaCl, 1 mM TCEP) was incubated with DMSO or 20 μM BI-3802 for 1 h at room temperature. The incubated protein samples were rapidly diluted to 10 μg/mL (sample treated with DMSO) or 50 μg/ml (samples treated with BI-3802). A 5 μL aliquot was applied to glow-discharged 400-mesh carbon-coated nickel grids (CF400-NI-UL, Electron Microscopy Sciences). After incubating for 1 min, protein was wicked off with a filter paper and the grid was washed twice with distilled water, followed by two rounds of staining with 2% uranyl acetate for 5 s and 20 s, respectively. Grids were imaged at a nominal magnification of 40,000 x on a JEOL JEM-1400Plus operated at 80 kV.
Docking simulations and fiber visualization
The starting models of the BCL6-BTB domain dimer and BI-3802 were obtained from PDB ID 5MW2. Using Rosetta 3.12 and RosettaDock 4.034, independent local docking simulations (3 Å and 8° moves) were performed by placing two BI-3802-bound BTB domain dimers in three separate starting orientations where BI-3802 was at the interface (viz. end-to-end, end-to-face, and dimers facing each other). No constraints were imposed. The command line used was:
$ROSETTA3_BIN/docking_protocol.macosrelease
-nstruct 10000 -partners AB_CD -dock_pert 3 8 -spin
-docking_low_res_score motif_dock_score
-mh:path:scores_BB_BB $ROSETTA/main/database/additional_protocol_data/motif_dock/xh_16_
-mh:score:use_ss1 false -mh:score:use_ss2 false -mh:score:use_aa1 true
-mh:score:use_aa2 true -ex1 -ex2aro
For each starting orientation, from the 10,000 models generated, 25 top-scoring models (by interface score) were selected. Using PyMOL, more dimers were added to the tetramer model by aligning them in the same binding mode as observed in the model. Many tetramer models could not be extended to produce polymers. For the ones that did, the pitch and the radius of the helix were calculated using HELFIT35 and compared to those observed in negative stain EM images.
Cryo-EM sample preparation and data collection
Strep II-Avi BCL65−360 (0.6 mg/ml, 13.4 μM) in buffer (25 mM HEPES pH 7.4, 200 mM NaCl, 1 mM TCEP) was incubated with 20 μM BI-3802 (1.5 molar excess, 1% DMSO) for 1 h at room temperature. The sample was diluted (10-fold) and concentrated again to decrease total DMSO concentration (0.1%). This process yielded polymerized BCL6 protein (0.48 mg/ml) as confirmed by negative stain EM. The sample was further mixed with CHAPSO (0.8 mM final concentration) to yield a final sample for vitrification. 4 μl sample were applied twice to glow-discharged 1.2/1.3 Quantifoil grids, and the grids were blotted for 1.3 seconds after each application and vitrified using a Leica EM-GP (10 °C, 95% relative humidity). A total of 7,552 movies (60 frames each) were collected on a FEI Titian Krios operated at 300 kV with a Gatan Quantum Image filter (20 eV slit width) and a post-GIF Gatan K3 camera, at a nominal magnification of 105,000 x in counting mode with a pixel size of 0.825 Å/pixel. Per stage position, two movies were acquired in four holes, resulting in 8 image acquisition groups. Movies were recorded in a defocus range from −1.0 to −2.5 μm over an exposure time of 3 s and with a total dose of 63.4 e-/Å2.
Image processing and model building
The movie frames were aligned and initially Fourier-cropped by a factor of 2, yielding a pixel size of 1.65 Å with MotionCor236 and CTF parameters were estimated with CTFFIND437. Particle picking was carried out using crYOLO38 for 1,610,413 initial particles. All subsequent processing steps were performed with Relion 3.039. Multiple rounds of 2D classification were used to clean the data, after which 274,999 particles were pooled for initial 3D classification. After re-extraction of the particles from the un-cropped micrograph (final pixel size of 0.825 Å), three rounds of 3D classification at 7.5 degree sampling and an additional round of 3D classification at 3.7 degree sampling left 128,526 particles that were used for 3D refinement, followed by CTF refinement and Bayesian polishing. Polished particles led to a reconstruction at 4.1 Å nominal resolution (using the FSC=0.143 threshold criterion). The polished particles were subjected to one additional round of 3D classification with application of a soft mask (Angular sampling = 7.5 degree, Regularization T = 6), which led to one major class with 95% of the particles (112,048 particles). 3D refinement and subsequent beam-tilt correction resulted in the final reconstruction at 3.7 Å nominal resolution (using the FSC=0.143 threshold criterion)40. Local resolution was estimated using Relion 3.0. Because of a highly preferred orientation of the ribbon-like filament on the EM grid, the reconstruction suffers from an anisotropic resolution distribution. However, 8 instances of the BCL6-BTB domain bound to BI-3802 from PDB entry 5MW2 could unambiguously be fitted into the cryo-EM density using Coot41. The resulting model was refined using global minimization, rigid body and adp refinement implemented in phenix.real_space_refine42, with reference restraints to the high resolution crystal structure (5MW2). Due to the limited resolution of the map, the placement of side-chains is approximated from the crystal structure (5MW2). The model resolution at FSC=0.5 appears low (8.1 Å), which is due to a dip in the model-vs-map FSC resulting from the preferred orientation.
Construction of the BCL6-BTB alanine scan library.
An alanine scan library, in which each amino acid of full length BCL6 between positions 32 and 99 was individually mutated to alanine and each alanine to arginine, was introduced into the full length eGFPBCL6 stability reporter (Fig. 1c). Two 176 bp long oligo libraries were synthesized (Twist Bioscience) in one oligo pool, encoding for BCL6-BTB variants. The first library covered BCL6 AA 32–65 (5’-TCCGGAGTCGAGACATCTTG… AAATGCAACCTTAGTGTGATCAATC-3’) and the second library covered BCL6 AA 66–99 (5’-CTATAGCATCTTTACAGACCAGTTG… GGCAACATCATGGCTGTGAT). The two libraries were amplified from the oligo pool by PCR with the NEBNext polymerase (NEB M0541, 98 °C for 30 sec, 26 cycles of [98 °C for 10 sec, 64 °C for 10 sec. 72 °C for 6 min], 72°C for 2 min).
The pDONR-BCL6 plasmid backbone was amplified with NEBNext polymerase (98 °C for 30 sec, 6 cycles of [98 °C for 10 sec, 59 °C for 10 sec. 72 °C for 150 sec], 24 cycles of [98 °C for 10 sec, 64 °C for 10 sec, 72 °C for 150 sec], 72 °C for 2 min), dephosphorylated with Dpn1 (NEB), and purified by gel purification using the QIAquick Gel Extraction Kit (Qiagen). Two separate libraries were constructed by Gibson assembly (NEB) (50 ng of the backbone plus 100 ng of the insert, 1 h at 50 °C) and salts were removed by dialysis (membrane filter, 0.025 μm pore size, Millipore). Libraries were transformed into Stbl3 chemical competent bacteria (Invitrogen) and plated on LB plates with carbenicillin for chemical selection. Resulting colonies were scraped, pooled, and purified using the QIAprep Spin Miniprep Kit (Qiagen). To shuffle the Alanine Scan Library into the Artichoke expression backbone, 150 μg of the pDONR BCL6-BTB alanine scan library and 150 μg of the gateway-pArtichoke vector were incubated over night with LR Clonase (ThermoFisher) at room temperature. After Proteinase K treatment, salts were removed by dialysis (membrane filter, 0.025 μm pore size, Millipore). Libraries were transformed into Stbl3 chemical competent bacteria (Invitrogen) and plated on LB plates with carbenicillin for chemical selection. Resulting colonies were scraped, pooled, and purified using the QIAprep Spin Miniprep Kit (Qiagen). Lentivirus for the BCL6-BTB alanine scan library was packaged using HEK293T cells.
BI-3802 resistance screen – Alanine scan screen
6 × 10⁶ SuDHL4Cas9 cells were transduced with 5% (v/v) Alanine – Scan 1 or Scan 2 libraries, and selected with 2 μg/mL of puromycin 24 h later. 48 h post infections, cells were treated with either DMSO or 1 μM BI-3802. Cells were split every 3–4 days for 21 days and 1 × 10⁶ cells were harvested for each time point and were flash frozen in dry ice, subsequently subjected to direct lysis buffer adding 1 × 10⁶ cells/100 μL (1 mM CaCl2, 3 mM MgCl2, 1 mM EDTA, 1% Triton X-100, Tris pH 7.5) with freshly supplemented 0.2 mg/mL proteinase. 20 μL of this mix was used for library amplifications in each sorted sample, resulting in 48 first PCR amplification with eight staggered primers in a 50 μL reaction volume (0.04U Titanium Taq (Takara Bio 639210), 0.5 x Titanium Taq buffer, 800 μM dNTP mix, 200 nM P5-SBS3 forward primer, 200 nM SBS12-pXPR003 reverse primer), 94 °C for 5 min, 15 cycles of (94 °C for 30 sec, 58 °C for 15 sec, 72 °C for 30 sec), 72 °C for 2 min. 2 μL of the first PCR reaction was used as the template for 15 cycles of the second PCR, where Illumina adapters and barcodes were added (0.04U Titanium Taq (Takara Bio 639210), 1 x Titanium Taq buffer, 800 μM dNTP mix, 200 nM SBS3-Stagger-pXPR003 forward primer, 200 nM P7-barcode-SBS12 reverse primer). An equal amount of all samples was pooled and subjected to preparative agarose electrophoresis followed by gel purification (Qiagen). Eluted DNA was further purified by NaOAc and isopropanol precipitation. Amplified alanine scan libraries were quantified by Illuminas novaseq_sp_100 platform with 123 cycles from SBS3 and 6 barcodes from SBS12. Forward and reverse reads number were combined and analyzed as described below.
BCL6 stability – Alanine scan screen
6 × 10⁶ HEK293TCas9 cells were transduced with 5% (v/v) Alanine – Scan 1 or Scan 2 libraries and 24 h later selected with 2 μg/mL of puromycin. Six days post infection cells were treated either with DMSO or 1 μM BI-3802 for 18 h and sorted using FACS. Four populations were collected (top 5%, top 5–15%, low 5–15% and low 5%) based on the eGFP-BCL6/mCherry ratio (Supplementary Figure 2). For each condition, at least 100 × 106 cells were subjected for sorting. BCL6 stable (5% highest GFP/mCherry) and BCL6 unstable (5% lowest GFP/mCherry) cells were harvested by centrifugation and cell pellets were flash frozen in dry ice. Sorted cell pellets were resuspended in direct lysis buffer as specified above. Amplified sgRNAs were quantified using the Illuminas NextSeq platform.
Genome-scale BCL6 reporter screen in HEK293T cells
The puromycin resistance cassette of the eGFPBCL6FL construct was swapped to a neomycin resistance cassette (eGFPBCL6FL-Neo). 5% (v/v) of the human genome-scale CRISPR-KO Brunello library43 with 0.4 μL polybrene/mL was added to 440 × 106 HEK293TCas9 cells expressing eGFPBCL6FL-Neo in 220 mL of RPMI medium. The culture was divided into three replicated and transduced (2400 rpm, 2 h, 37 °C). 24 h post infection sgRNA cells were selected with 2 μg/mL of puromycin for two days. On the seventh day, cells were treated with either DMSO or 1 μM BI-3802 and then sorted on day eight (Supplementary Figure 2). Sorted cells were harvested by centrifugation and subjected to direct lysis, library preparation, and sequencing as specified above.
Genome-scale BI-3802 resistance screen in SuDHL4Cas9 cells
The resistance screen was performed similarly to the genome-scale BCL6 reporter screen in HEK293TCas9 cells with the following modifications. For three replicates, 500 × 106 SuDHL4Cas9 cells in 200 mL of RPMI medium were transduced with 3.5 mL of the human genome-scale CRISPR KO Brunello library with 0.4 μL/mL polybrene. 24 h post infection, cells were selected with 1 μg puromycin/mL for four days. Eight days post infection, cells were exposed to either 1 μM BI-3802 or DMSO. The cells were then cultured for 20 more days until harvesting, with one split every 3–4 days, where fresh drug was added. Genomic DNA was purified with QIAamp DNA Maxi kit (Qiagen) and up to 3 μg of DNA was submitted for multiple reaction 94 °C for 2 min, 18 cycles of (94 °C for 30 sec, 58 °C for 15 sec, 72 °C for 30 sec), 72 °C for 2 min.
Targeted BCL6 reporter screen in HEK293T cells
The BISON CRISPR library targets 713 E1, E2, and E3 ubiquitin ligases, deubiquitinases, and control genes and contains 2,852 guide RNAs. It was cloned into the pXPR003 as previously described35. The virus for the library was produced in a T-175 flask format, as described above with the following adjustments: 1.8 × 10⁷ HEK293T cells in 25 mL complete DMEM medium, 244 μL of TransIT-LT1, 5 mL of OPTI-MEM, 32 μg of library, 40 μg psPAX2, and 4 μg pVSV-G in 1 mL OPTI-MEM. 10% (v/v) of BISON CRISPR library was added to 6 × 10⁶ HEK293TCas9 cells and processed as describe above for the genome wide screens.
Data analysis of CRISPR-Cas9 knockout screens and alanine scans
The CRISPR-Cas9 knockout screen and alanine scan data were analyzed using the R programming language (3.5.1) and RStudio (1.1.453) with the following packages: tidyverse (1.2.1), ggrepel (0.8.1), GGally (1.4.0), dr4pl (1.1.11), ShortReads (Bioconductor 3.10) and Statistical Analysis Limma Package 3.42.2 (Bioconductor 3.0). The data analysis pipeline comprised following steps: (1) Reads per guide or alanine variant codon for each sample were normalized to the total number of reads across all samples for comparison. (2) For each guide or alanine variant codon, the ratio of reads in the stable vs. unstable sorted gate was calculated, which subsequently was used to rank guide RNAs or alanine variant codons. (3) The replicates were combined by summing up the ranks across replicates for each individual guide or alanine variant codon. (3) The gene or alanine variant rank was then determined as the median rank of the four guides targeting the gene or the four alanine codons encoding the variant. (4) p-values were calculated by simulating a distribution with guide RNAs or alanine variant codons that had randomly assigned ranks over 100 iterations. R scripts are available in Supplementary Information.
Individual validation of alanine scan variants
The eGFPBCL6FL E41A, eGFPBCL6FL G55A, eGFPBCL6FL Y58A, and eGFPBCL6FL C84A mutations were introduced by Q5 Site-Directed Mutagenesis (NEB) in pDONR223-BCL6 and then shuffled into the “Artichoke” stability reporter. After the lentivirus production, SuDHL4Cas9, RajiCas9 and DELCas9 cells were infected with the indicated BCL6 variants and treated with 1 μM BI-3802 or DMSO over 21 days. The percentage of mCherry-positive cells was monitored over time by flow cytometry.
Single gene knockouts
gRNAs targeting genes of interest were cloned into the sgRNA.EFS.tBFP vector using BsmBI digestion as previously described44. Briefly, vectors were linearized with BsmBI (New England Biolabs) and gel purified (Qiagen spin miniprep). Annealed oligos were phosphorylated with T4 polynucleotide kinase (New England Biolabs), ligated into linearized vector backbone. Constructs were transformed into XL10-Gold ultracompetent Escherichia coli (Stratagene/Agilent Technologies, La Jolla, CA, USA), plasmids were purified using the MiniPrep Kit (Qiagen) and validated by Sanger sequencing. Lentivirus was produced as described above. HEK293TCas9 or SuDHL4Cas9 cells were transduced with sgRNAs. For BCL6 reporter assays, the effect of the knockdown was determined by quantifying the GFP/mCherry ratios in BFP/RFP657 positive and negative populations by flow cytometry seven days post infection. For competition assays, the percentage of BFP positive cells was monitored over time by flow cytometry (Supplementary Figure 2).
Overexpression of SIAH1 in HEK293T cells
HEK293TCas9 cells expressing eGFPBCL6FL were transduced with V5SIAH1 or V5SIAH144C>S. Cells were trypsinized 72 h after infection and eGFP and mCherry expression quantified by flow cytometry (Supplementary Figure 2). For construction of V5SIAH1 expression vectors, inserts were PCR amplified with attP sites and cloned into pDONR221 by a BP clonase reaction and then transferred into the pLEX_307 (Addgene #41392) expression vector by a LR clonase reaction. To construct V5SIAH144C>S, mutations were introduced by site-directed mutagenesis in pDONR221-SIAH1 and then transferred into pLEX_307 (Addgene #41392).
Co-immunoprecipitation
HEK293TCas9 cells expressing eGFPBCL6FL, eGFPBCL6FL 249−251 VSP>GSA, eGFPBCL61−250, and eGFPBCL61−275 constructs were transduced with V5SIAH1C44S. 1 × 10⁶ cells were plated into 10 cm dishes, cultured for one day, treated with 0.5 μM MLN7249 for 2 h, and then with either 2 μM BI-3802 or DMSO for 1 h. The cells were harvested and lysed in RIPA lysis buffer (ThermoFisher Scientific, #89900) infused with protease inhibitor (ThermoFisher Scientific, HaltTM Protease Inhibitor Cocktail #78438) for 30 min at 4 °C. 5 μM BI-3802 was infused to all buffers used for the BI-3802 treated arm. Lysates were cleared by centrifugation (17,000 g, 20 min, 4 °C). 20 μL of pre-cleaned GFP-trap magnetic agarose beads (Chromotek, gmta-20) was added to the lysates. The beads-lysate mix was incubated at 4 °C for 30 min. Proteins were eluted in 2x sample buffer at 98 °C. Eluates and whole-cell lysates were run on a polyacrylamide gel, transferred to a nitrocellulose membrane and immunoblotted for eGFP and V5.
In vitro pull down
For the pull-downs of BCL6 (Strep II-Avi BCL65−129 or BCL65−360) with SIAH1 (tag-cleaved SIAH1SBD), 20 μM BCL6 variants and 30 μM SIAH1SBD were incubated in 300 μL binding buffer (25 mM HEPES pH 7.4, 200 mM NaCl, 2 mM TCEP) with 2 μM BI-3802 (0.5% DMSO) for 1 h. 50 μL of Strep-Tactin XT Superflow (IBA) beads were added and incubated for another 1 h. Beads were washed quickly three times with 100 μL of washing buffer, and samples were eluted with 100 μL of elution buffer (binding buffer with 50 mM Biotin). All samples were analyzed by SDS-PAGE.
Isothermal titration calorimetry (ITC)
All calorimetric experiments were carried out using an Affinity ITC from TA Instruments (New Castle, DE) equipped with auto sampler in a buffer containing 20 mM HEPES, pH 7.5, 150 mM NaCl, and 0.5 mM TCEP at 25 °C. For the BCL6-SIAH1 interaction, 25 μM BCL65−360 protein solution in the calorimetric cell was titrated by injecting 2 μL of 250 μM SIAH1SBD protein solution in 200 sec intervals with stirring speed at 125 rpm. For the isolated BCL6 peptide (residues 241–260) and SIAH1 interaction, 25 μM SIAH1SBD protein solution in the calorimetric cell was titrated by injecting 2 μL of 250 μM BCL6241−260 peptide solution in a same setup. Resulting isotherm was fitted with a single site model to yield thermodynamic parameters of DH, DS, stoichiometry, and Kd using NanoAnalyze software (TA instruments).
BCL6-SIAH1 time-resolved fluorescence resonance energy transfer (TR-FRET)
Titrations of compounds to induce BCL65−360-SIAH1 complex were carried out by mixing 200 nM biotinylated Strep II Avi-tagged SIAH1SBD, 200 nM BodipyFL-labeled BCL65−360 variants, and 2 nM terbium-coupled streptavidin (Invitrogen) in an assay buffer containing 50 mM Tris pH 8.0, 200 mM NaCl, 0.1% Pluronic F-68 solution (Sigma), 0.5% BSA (w/v), 1 mM TCEP. After dispensing the assay mixture (15 μL volume), increasing concentrations of compounds were dispensed in a 384-well microplate (Corning, 4514) using a D300e Digital Dispenser (HP) normalized to 1% DMSO. After excitation of terbium fluorescence at 337 nm, emission at 490 nm (terbium) and 520 nm (BodipyFL) were recorded with a 70 μs delay over 600 μs to reduce background fluorescence, and the reaction was followed over 60 cycles of each data point using a PHERAstar FS microplate reader (BMG Labtech). The TR-FRET signal of each data point was extracted by calculating the 520/490 nm ratio. The half-maximal effective concentration (EC50) values were estimated using dose-response analysis standard four parameter log-logistic curves, fitted to the experimental data using the dr4pl R package.
Titrations of BodipyFL-BCL65−360 were carried out by mixing 400 nM biotinylated Strep II Avi-tagged SIAH1SBD, 2 μM compounds or equivalent volume of DMSO, and 4 nM terbium-coupled streptavidin in the same assay buffer. After dispensing the assay mixture, increasing concentration of BodipyFL-BCL65−360 was added to the SIAH1 mixture in a 1:1 volume ratio (7.5 μL each, total 15 μL assay volume). The 520/490 nm ratios were measured in as described above and plotted to calculate the KDAPP values using dose-response analysis standard four parameter log-logistic curves using the dr4pl R package.
BCL6-BCoR TR-FRET (compound binding assay)
Competitive titration of BI-3802 or BI-3812 were carried out by mixing 100 nM biotinylated BCL65−129, 100 nM N-terminal FITC-labeled BCoR peptide (sequence: RSEIISTAPSSWVVPGP), and 2 nM terbium-coupled streptavidin in the same assay buffer. After dispensing the assay mixture (15 μL volume), increasing concentrations of compounds were dispensed in a 384-well microplate (Corning, 4514) using a D300e Digital Dispenser (HP) normalized to 1% DMSO. The 520/490 nm ratios were measured as described above and plotted to calculate the KDAPP values using dose-response analysis standard four parameter log-logistic curves using the dr4pl R package.
BRET analysis
Bioluminescence resonance energy transfer (BRET) experiments were performed using a NanoBRET PPI starter kit (Promega N1821) according to the manufacturer’s instructions and as previously described45.
In vitro ubiquitination
In vitro ubiquitination for identification of compatible E2 conjugating enzymes was performed by following the manufacturer’s instruction (K-982, Boston Biochem), using Strep II-Avi-BCL65−360 and Flag-SIAH1FL. Time-course in vitro ubiquitination was performed by mixing the substrate (BCL6, 2 μM), E3 (SIAH, 0.5 μM), E1 (UBA1, Boston Biochem, 0.2 μM, E2 (UBE2D1, Boston Biochem, 0.5 μM), and ubiquitin (Boston Biochem, 50 μM), with a reaction buffer (B-71, Boston Biochem) containing BI-3802 or DMSO (normalized to 1% DMSO) in 15 μL volume each. Reactions were initiated by adding 5 μL of Mg-ATP solution (B-20, Boston Biochem), incubated for up to 60 min at 37 ºC, and analyzed by western blot using Strep tag II Antibody HRP conjugate (71591–3, Sigma) at 1:4,000.
Immunofluorescence
HEK293TCas9 cells expressing eGFPBCL6250 and eGFPBCL6275 constructs were transduced with V5SIAH1C44S (infection rate > 70%). 0.1 × 10⁶ cells were plated per chamber of a four-well chamber slide, cultured overnight, pre-treated with 0.5 μM MLN7243 for 2 h, followed by treatment with either DMSO or 2 μM BI-3802 for 1 h. The cells were fixed with 4% formaldehyde for 15 min and permeabilized with 0.1% Triton X100 for 30 min. Epitopes were blocked with 10% BSA for 10 min. Anti-V5 antibodies were added and incubated on slides overnight at 4 °C. After removal of the primary antibodies and washes, Alexa Fluor 633-conjugated anti-mouse antibodies were added and incubated at room temperature for 45 min. Finally, the slides were stained with DAPI (BD Biosciences, #564907, 1:5,000 in H2O) and mounted with SlowFade™ Diamond Antifade Mountant (Thermo Fisher Scientific, S36963). Cells were imaged with the Leica TCS SP5 confocal microscope.
Reporting summary
Further information on research design is available in the Nature Research Reporting Summary linked to this paper.
Statistics and Reproducibility
The “n” denoted in the figure legends refer to independent experiments following genetic perturbation or drug treatment, which were also performed as independent replicates for each experiment. For micrographs, immunoblots, and microscopy images, a representative image from n replicates is shown. For pooled CRISPR-knockout screens and alanine scans, n denotes independent experiments with 4 unique sgRNAs/gene or 4 codons/substitution for the alanine scan that were infected in a pool but then treated separately throughout the screen.
Data Availability
Structural data have been deposited to the EMDB and RCSB (EMD-22265, PDB-6XMX). Proteome quantification data are available in the PRIDE repository (PXD016185). Uncropped gel and western blot source data are shown in Supplementary Figure 1. The flow cytometry gating strategy is displayed in Supplementary Figure 2. All source data associated with the paper are either included as SI or deposited.
Code Availability
The scripts used for modeling and analysis in this study is available on Github (https://github.com/fischerlab/scripts-publications/tree/master/2020_BCL6_polymerization).
Extended Data
Extended Data Fig. 1. |. Characterization of BI-3802-induced BCL6 degradation.

a, Immunoblots of BCL6 levels in cytoplasmic, nuclear or chromatin bound fractions of SuDHL4Cas9 cells after 24 hours DMSO or 1 μM BI-3802 treatment (n = 2). b, mRNA levels quantified by qPCR in SuDHL4Cas9 cells after treatment with 1 μM BI-3802 or DMSO for 1 hour (bars represent mean and s.d., n = 3). c, Whole proteome quantification of SuDHL4Cas9 cells treated with 1 μM BI-3812 (n = 1) or DMSO (n = 3) for 4 hours (two-sided moderated t-test, n = 3). d, Immunoblots of BCL6 levels in SuDHL4Cas9 cells treated with 10 μM MG132 (26S proteasome inhibitor) for 1 hour, 1 μM BI-3802 for 45 minutes and 10 μM BI-3812 for 10 minutes. A subset of the polymerized BCL6 was insoluble and lost during the western blot sample preparation, however, treatment with an excess of BI-3812 shortly before protein harvest reverts polymerization, solubilized BCL6, and allowed for reliable quantification (n = 2). e, Immunoblots of BCL6 levels in SuDHL4Cas9 cells treated with DMSO, 10 μM MLN7243 (ubiquitin activating enzyme inhibitor), 10 μM MG132 (26S proteasome inhibitor), 10 μM Chloroquine (lysosomal inhibitor), or 5 μM MLN4924 (neddylation inhibitor) for 15 minutes, then, for indicated samples, 1 μM BI-3802 was added and 35 minutes later, 10 μM BI-3812 was added for the final 10 minutes, resulting in a total of 1 hour treatment with MLN7243, MG132, Chloroquine, and MLN4924, 45 minutes of BI-3802, and 10 minutes with BI-3812 (n = 2). f, Cytospin immunofluorescence images of SuDHL4Cas9 cells treated with DMSO (left) or 0.5 μM MLN7243 for 2 hours and 1 μM BI-3802 (right) for 1 hour. Scale bar is 5 μm (n = 2). g, Flow cytometry analysis of HEK293TCas9 cells expressing the eGFPBCL61−275 which were exposed simultaneously to the indicated concentrations of BI-3802 and BI-3812 for 24 hours. Lines represent standard four parameter log-logistic curve fit (n = 3).
Extended Data Fig. 2 |. Computational docking of BCL6 helical filaments models with distinct binding modes.

Visualization of top scoring BCL6-BTB domain filament model from three different binding modes: end-to-end (E2E), face-to-end (F2E) and face-to-face (F2F). Each BTB monomer used for building the tetramer model is labeled in a distinct color. BI-3802 is visualized as a sphere. The interface score is an estimate of the binding energy between the dimers. The helical pitch was calculated by extending the tetramer. Sub-angstrom variations in the F2F binding mode has a profound effect on helical pitch (>10 nm).
Extended Data Fig. 3. |. Structure determination of BCL6 filaments by cryo-EM.

a, Representative cryo-EM micrograph at −2 μm defocus. Micrograph was low-pass filtered. Scale bar is 100 nm. b, Local resolution map of the final reconstruction with a threshold of 0.0154 (Chimera) calculated using Relion 3.0. c, Data processing scheme for the BCL6 filaments. Iterative 2D classifications resulted in 274,999 particles. Multiple subsequent rounds of 3D classification, refinement, and polishing improved map resolution to a final overall resolution of 3.7 Å. Percentages refer to the particles in each class. Red density maps indicate the classes that were used for the next round of processing, while blue density maps are from 3D refinements. d, Fourier shell correlation (FSC) plots for unmasked and masked maps. Overall resolution is indicated at FSC = 0.143. e, Histogram and directional FSC plot for BCL6 cryo-EM map. f, g, Regions of the cryo-EM model for the BCL6 filament fit into the density map, demonstrating side chain density for multiple residues. Each density is shown at a threshold of 0.0178 (from Chimera).
Extended Data Fig. 4. |. Structural details of BI-3802-induced BCL6 filaments.

a, Density for BI-3802 in the 3.7 Å cryo-EM reconstruction. The crystal structure of BCL6 bound to BI-3802 (PDB: 5MW2) was docked into the cryo-EM map and refined using phenix.real_space_refine. The cryo-EM density is shown in grey at a threshold of 0.0178 (from Chimera). b, Density of BI-3802 and key interacting residues (R28, E41, Y58, C84) for BCL6 polymerization. Each density in mesh is shown at a threshold of 0.0178 (from Chimera). c, d, Comparison of the cryo-EM model of polymerized BCL6 (white) with the BCL6 crystallographic lattice (yellow, PDB: 5MW2) for c, dimer-dimer, and d, filament. e, Superimposed structures of BI-3802 (yellow) and BI-3812 (orange) bound to the BCL6 filament. BI-3812 was docked to the crystal structure of BCL6-BTB (PDB: 5MW2), which was then aligned to the BI-3802-mediated BCL6 filament model. The solvent exposed moiety of the inhibitor is clashing with the adjacent BCL6 dimer (grey). f, Preassembled 0.1 μM FITCBCoR peptide and 0.1 μM BiotinBCL65−129 variants were exposed to increasing concentration of BI-3802, and the signal measured by TR-FRET. Interaction of BCL6 with the BCOR co-repressor peptide was used to quantitively determine drug binding. Lines represent standard four parameter log-logistic curve fit (n = 3).
Extended Data Fig. 5. |. Analysis of BCL6-BTB variants in vivo.

a, Schematic of alanine mutagenesis resistance screen of the BCL6-BTB domain in SuDHL4Cas9 cells. b, SuDHL4Cas9, RajiCas9 (both BCL6-dependent) and DELCas9 (BCL6-independent) cells were infected with the indicated BCL6 variants and treated with 1 μM BI-3802 or DMSO over 21 days. Lines represent measurement from each replicate (n = 2). c, Schematic of alanine mutagenesis reporter screen of the BCL6-BTB domain in HEK293TCas9 cells. d, Alanine mutagenesis screen of the BCL6-BTB domain for impaired BI-3802 induced degradation at 1 μM BI-3802 in HEK293TCas9 cells. Mutations that confer resistance are labeled. Four different codons were collapsed to each unique amino acid position ( > 3-fold enrichment, p-value <10−4; n = 2; 4 codons/position; two-sided empirical rank-sum test-statistics). e, Correlation of BCL6 mRNA expression (TPM) and BCL6 dependency (CERES score) in a set of 559 cancer cell lines from the Dependency Map Project. Cell lines chosen for experiments are labeled. f, BI-3802 in the polymerization interface. Residues identified in the alanine scan are highlighted, with the following color code: orange – G55, Y58 (residues involved in drug binding), magenta – E41, C84 (residues involved in polymerization). Hydrogen atoms in G55 are depicted as spheres.
Extended Data Fig. 6. |. Genome-wide CRISPR-Cas9 screens to identify the molecular machinery involved in BI-3802-induced degradation of BCL6.

a, Schematic of the BCL6 stability reporter-based sorting screen. b, c, Genome-wide CRISPR-Cas9 knockout screen for eGFPBCL6 stability in HEK293TCas9 cells after 16 hours of treatment with 1 μM BI-3802 or DMSO. Results for SIAH1 and FBXO11 (a previously reported E3 ligase involved in BCL6 endogenous degradation) are labeled. Guides were collapsed to gene level (n = 3; 4 guides/gene; two-sided empirical rank-sum test-statistics). d, Normalized read counts in each sorted gate for 4 sgRNAs targeting SIAH1 and 4000 non-targeting controls (NTC). Symbols indicate the mean normalized read numbers for each sgRNA. (n = 3). e, Flow cytometry analysis of HEK293TCas9 cells expressing the full length eGFPBCL6 reporter and individual sgRNAs after 4 hours treatment with DMSO or 1 μM BI-3802. Bars represent mean (n = 3). f, Schematic of the genome-wide CRISPR-Cas9 resistance screen. g, Genome-wide CRISPR-Cas9 knockout screen for resistance to BI-3802. Guides were collapsed to gene level (n = 3; 4 guides/gene; two-sided empirical rank-sum test-statistics). h, Flow cytometry analysis of SuDHL4Cas9 cells expressing sgRNAs and blue florescent protein (marker) exposed to DMSO or 1 μM BI-3802. Lines represent measurement from each replicate (n = 3).
Extended Data Fig. 7. |. SIAH1 induces degradation of BCL6 via VxP motif.
a, Flow cytometry analysis of HEK293TCas9 cells expressing full length eGFPBCL6 stability reporter and vectors expressing no-insert control, SIAH1 or SIAH1C44S, exposed to DMSO or BI-3802 for 2 hours. Bars represent the mean (n = 3). b, Alignment of the BCL6 SIAH1 recognition site with previously published peptide sequences recognized by SIAH1 with inferred consensus SIAH1 binding site. c, CRISPR-Cas9 knockout screen with the Bison library for eGFPBCL6AA1−129+241−260 stability in HEK293TCas9 cells after 16 hours of treatment with 1 μM BI-3802 or DMSO. Guides were collapsed to gene level (n = 1; 4 guides/gene; two-sided empirical rank-sum test-statistics). d, Flow cytometry analysis of HEK293TCas9 cells expressing eGFPBCL6FL or eGFPBCL6FL VSP>GSA treated with DMSO or 1 μM BI-3802 for 7 hours (bars represent mean, n = 3).
Extended Data Fig. 8. |. Characterization of SIAH1-mediated degradation of polymerized BCL6.
a, SDS-page gel analysis of the in vitro pull-down between recombinant SIAH1SBD and recombinant StrepBCL6 in the presence of BI-3802 or DMSO. Strep, strep•Tag II (n = 2). b, Titration of BCL6241−260 peptide binding to SIAH1SBD using isothermal calorimetry (n = 1). c, Titration of SIAH1SBD binding to BCL65−360 using isothermal calorimetry (n = 1). d, Recombinant StrepBCL65−360 was combined with full length SIAH1 and a panel of E2 enzymes (Boston Biochem) and screened for ubiquitination activity in vitro. Samples were analyzed by western blot and visualized by strep•Tag II antibody-HRP conjugate (n = 1). e, BodipyBCL65−360 variants (WT, E41A, Y58A) were titrated to 0.2 μM BiotinSIAH1SBD in presence of 2 μM BI-3802, and the signal was measured by TR-FRET. Dots represent mean. Lines represent standard four parameter log-logistic curve fit (n = 3). f, Preassembled 0.2 μM BodipyBCL65−360 and 0.2 μM BiotinSIAH1SBD were exposed to increasing concentration of BI-3802 or BI-3812, and the signal was measured by TR-FRET. Dots represent mean. Lines represent standard four parameter log-logistic curve fit (n = 3). g, HEK293T cells transiently transfected with Nano-LuciferaseSIAH1C44S and HaloTagBCL6 constructs were treated with DMSO, 1 μM BI-3802 or 1 μM BI-3812 for 2 hours and the mBRET signal was measured. Bars represent mean (n = 3). One-sided t-test. h, Preassembled 0.1 μM FITCBCoR peptide and 0.1 μM BiotinBCL65−129 were exposed to increasing concentration of BI-3802 or BI-3812, and the signal measured by TR-FRET. Lines represent standard four parameter log-logistic curve fit (n = 3). i, HEK293TCas9 cells expressing the eGFPBCL61−250 stability reporter and V5SIAH1 were treated with 0.5 μM MLN7243 for 2 hours and 1 μM BI-3802 for 1 hour. Cells were imaged by indirect immunofluorescence as indicated. Scale bar is 5 μm (n = 2).
Extended Data Table 1. |.
Cryo-EM data collection, refinement and validation statistics.
| Polymerized BCL6 bound to BI-3802 (EMD-22265) | |
|---|---|
| Data collection and processing | |
| Magnification | 105,000 |
| Voltage (kV) | 300 |
| Electron exposure (e-/Å2) | 63.4 |
| Defocus range (μm) | −1 to -2.5 |
| Pixel size (Å) | 0.825 |
| Symmetiy imposed | Cl |
| Initial particle images (no.) | 1,610,413 |
| Final particle images (no.) | 112,048 |
| Map resolution (Å) | 3.7 |
| FSC threshold | 0.143 |
| Map resolution range (Å) | 3.65 to 5.25 |
| Refinement† | |
| Initial model used (PDB code) | 8 x 5MW2 |
| Model resolution (Å) | 8.1 |
| FSC threshold | 0.5 |
| Model resolution range (Å) | 3.65 to 5.25 |
| Map sharpening B factor (Å2) | −98.3 |
| Model composition | |
| Non-hydrogen atoms | 8072 |
| Protein residues | 976 |
| Ligands | 8 |
| B factors (Å2) | |
| Protein | 23.42 |
| Ligand | 22.21 |
| R.m.s. deviations | |
| Bond lengths (Å) | 0.012 |
| Bond angles (°) | 1.112 |
| Validation | |
| MolProbity score | 1.36 |
| Clashscore | 6.48 |
| Poor rotamers (%) | 0.89 |
| Ramachandran plot | |
| Favored (%) | 98.33 |
| Allowed (%) | 1.67 |
| Disallowed (%) | 0 |
Footnote:
Strongly preferred orientation causes dip in Model vs Map FSC, leading to low model resolution (8.1 Å) estimation at FSC=0.5.
Supplementary Material
Acknowledgements
We thank the Broad Institute Flow Facility, particularly Patricia Rogers, the Broad Institute Walk-up Sequencing Team, particularly Tamara Mason and the Broad Institute Genetic Perturbation Platform and Whitehead Institute Microscopy Facility, particularly Wendy Salmon for technical assistance. Cryo-EM data were collected at the Harvard Cryo-Electron Microscopy Center for Structural Biology. We thank Sarah Sterling and Richard Walsh for microscopy support, Shaun Rawson for comments and computing support. We acknowledge the Research Computing Group at Harvard Medical School for computational modeling, and the SBGrid suite for structural biology software packages. We thank Hyuk-Soo Seo for help with ITC experiment. We thank James Kennedy for providing sgRNA.SFFV.tBFP backbone. We are grateful to all member of the Ebert and Fischer Labs for discussion, particularly Brian Liddicoat, Roger Belizaire, Sebastian Koochaki, Quinlan L. Sievers, Rob S. Sellar, Max Jan, Paul M.C. Park, Dora Levin, Tyler B. Faust as well as Nicolas H. Thomä, Georg Petzold, Zuzanna Kozicka, Kathleen Mulvaney, Debjani Pal, Jonathan Schmid-Burgk.
M.S. has received funding from the European Union’s Horizon 2020 Research and Innovation Program under the Marie Skłodowska-Curie grant agreement no. 702642. H.Y. was supported by a Chleck Foundation fellowship and is a recipient of the NCI Predoctoral to Postdoctoral Fellow Transition (F99/K00) Award (F99CA253754). S.S.R.B. is the recipient of a Cancer Research Institute/Irvington Postdoctoral Fellowship (CRI 3442). A.S. is supported by a DF/HCC K12 grant, a Conquer Cancer Foundation Young Investigator Award and an award from the Wong Family Foundation. M.H. is supported by a Swiss National Science Foundation Fellowship 174331. This work was supported by the NIH R01HL082945, P01CA108631, and P50CA206963 (grant to B.L.E.), the Howard Hughes Medical Institute, the Edward P. Evans Foundation, and the Leukemia and Lymphoma Society (grant to B.L.E.), NIH grant NCI R01CA214608 and R01CA218278 (grant to E.S.F.), and a Mark Foundation Emerging Leader Award 19–001-ELA (grant to E.S.F.).
Footnotes
Competing interests
B.L.E. has received research funding from Celgene and Deerfield. He has received consulting fees from GRAIL, and he serves on the scientific advisory boards for and holds equity in Skyhawk Therapeutics and Exo Therapeutics. E.S.F. is a founder, member of the scientific advisory board (SAB), and equity holder of Civetta Therapeutics and Jengu Therapeutics, holds equity in C4 Therapeutics, and a consultant to Novartis, Astellas, AbbVie, EcoR1 capital and Pfizer. The Fischer lab receives or has received research funding from Novartis, Deerfield and Astellas. E.S.F. has had a consulting or advisory role, received honoraria, research funding, and/or travel/accommodation expenses funding from the following for-profit companies: Bayer, Roche, Amgen, Eli Lilly, PharmaMar, AstraZeneca, and Pfizer.
Additional Information
Supplementary Information is available for this paper.
Main References
- 1.Kronke J. et al. Lenalidomide causes selective degradation of IKZF1 and IKZF3 in multiple myeloma cells. Science 343, 301–305, doi: 10.1126/science.1244851 (2014). [DOI] [PMC free article] [PubMed] [Google Scholar]
- 2.Lu G. et al. The myeloma drug lenalidomide promotes the cereblon-dependent destruction of Ikaros proteins. Science 343, 305–309, doi: 10.1126/science.1244917 (2014). [DOI] [PMC free article] [PubMed] [Google Scholar]
- 3.Kronke J. et al. Lenalidomide induces ubiquitination and degradation of CK1alpha in del(5q) MDS. Nature 523, 183–188, doi: 10.1038/nature14610 (2015). [DOI] [PMC free article] [PubMed] [Google Scholar]
- 4.Huang HT et al. A Chemoproteomic Approach to Query the Degradable Kinome Using a Multi-kinase Degrader. Cell Chem Biol 25, 88–99 e86, doi: 10.1016/j.chembiol.2017.10.005 (2018). [DOI] [PMC free article] [PubMed] [Google Scholar]
- 5.McCoull W. et al. Development of a Novel B-Cell Lymphoma 6 (BCL6) PROTAC To Provide Insight into Small Molecule Targeting of BCL6. ACS Chem Biol 13, 3131–3141, doi: 10.1021/acschembio.8b00698 (2018). [DOI] [PubMed] [Google Scholar]
- 6.Kerres N. et al. Chemically Induced Degradation of the Oncogenic Transcription Factor BCL6. Cell Rep 20, 2860–2875, doi: 10.1016/j.celrep.2017.08.081 (2017). [DOI] [PubMed] [Google Scholar]
- 7.Toure M. & Crews CM Small-Molecule PROTACS: New Approaches to Protein Degradation. Angew Chem Int Ed Engl 55, 1966–1973, doi: 10.1002/anie.201507978 (2016). [DOI] [PubMed] [Google Scholar]
- 8.Bondeson DP et al. Catalytic in vivo protein knockdown by small-molecule PROTACs. Nat Chem Biol 11, 611–617, doi: 10.1038/nchembio.1858 (2015). [DOI] [PMC free article] [PubMed] [Google Scholar]
- 9.Winter GE et al. DRUG DEVELOPMENT. Phthalimide conjugation as a strategy for in vivo target protein degradation. Science 348, 1376–1381, doi: 10.1126/science.aab1433 (2015). [DOI] [PMC free article] [PubMed] [Google Scholar]
- 10.Nowak RP et al. Plasticity in binding confers selectivity in ligand-induced protein degradation. Nat Chem Biol 14, 706–714, doi: 10.1038/s41589-018-0055-y (2018). [DOI] [PMC free article] [PubMed] [Google Scholar]
- 11.Petzold G., Fischer ES & Thoma NH Structural basis of lenalidomide-induced CK1alpha degradation by the CRL4(CRBN) ubiquitin ligase. Nature 532, 127–130, doi: 10.1038/nature16979 (2016). [DOI] [PubMed] [Google Scholar]
- 12.Sievers QL et al. Defining the human C2H2 zinc finger degrome targeted by thalidomide analogs through CRBN. Science 362, doi: 10.1126/science.aat0572 (2018). [DOI] [PMC free article] [PubMed] [Google Scholar]
- 13.Cerchietti LC et al. A small-molecule inhibitor of BCL6 kills DLBCL cells in vitro and in vivo. Cancer Cell 17, 400–411, doi: 10.1016/j.ccr.2009.12.050 (2010). [DOI] [PMC free article] [PubMed] [Google Scholar]
- 14.Cardenas MG et al. Rationally designed BCL6 inhibitors target activated B cell diffuse large B cell lymphoma. J Clin Invest 126, 3351–3362, doi: 10.1172/JCI85795 (2016). [DOI] [PMC free article] [PubMed] [Google Scholar]
- 15.Bosga-Bouwer AG et al. BCL6 alternative translocation breakpoint cluster region associated with follicular lymphoma grade 3B. Genes Chromosomes Cancer 44, 301–304, doi: 10.1002/gcc.20246 (2005). [DOI] [PubMed] [Google Scholar]
- 16.Hatzi K. & Melnick A. Breaking bad in the germinal center: how deregulation of BCL6 contributes to lymphomagenesis. Trends Mol Med 20, 343–352, doi: 10.1016/j.molmed.2014.03.001 (2014). [DOI] [PMC free article] [PubMed] [Google Scholar]
- 17.Cattoretti G. et al. Deregulated BCL6 expression recapitulates the pathogenesis of human diffuse large B cell lymphomas in mice. Cancer Cell 7, 445–455, doi: 10.1016/j.ccr.2005.03.037 (2005). [DOI] [PubMed] [Google Scholar]
- 18.Ranuncolo SM, Polo JM & Melnick A. BCL6 represses CHEK1 and suppresses DNA damage pathways in normal and malignant B-cells. Blood Cells Mol Dis 41, 95–99, doi: 10.1016/j.bcmd.2008.02.003 (2008). [DOI] [PMC free article] [PubMed] [Google Scholar]
- 19.Tunyaplin C. et al. Direct repression of prdm1 by Bcl-6 inhibits plasmacytic differentiation. J Immunol 173, 1158–1165, doi: 10.4049/jimmunol.173.2.1158 (2004). [DOI] [PubMed] [Google Scholar]
- 20.Phan RT, Saito M., Basso K., Niu H. & Dalla-Favera R. BCL6 interacts with the transcription factor Miz-1 to suppress the cyclin-dependent kinase inhibitor p21 and cell cycle arrest in germinal center B cells. Nat Immunol 6, 1054–1060, doi: 10.1038/ni1245 (2005). [DOI] [PubMed] [Google Scholar]
- 21.Schlager S. et al. Inducible knock-out of BCL6 in lymphoma cells results in tumor stasis. Oncotarget 11, 875–890, doi: 10.18632/oncotarget.27506 (2020). [DOI] [PMC free article] [PubMed] [Google Scholar]
- 22.Ghetu AF et al. Structure of a BCOR corepressor peptide in complex with the BCL6 BTB domain dimer. Mol Cell 29, 384–391, doi: 10.1016/j.molcel.2007.12.026 (2008). [DOI] [PMC free article] [PubMed] [Google Scholar]
- 23.Sievers QL, Gasser JA, Cowley GS, Fischer ES & Ebert BL Genome-wide screen identifies cullin-RING ligase machinery required for lenalidomide-dependent CRL4(CRBN) activity. Blood 132, 1293–1303, doi: 10.1182/blood-2018-01-821769 (2018). [DOI] [PMC free article] [PubMed] [Google Scholar]
- 24.Hunkeler M. et al. Structural basis for regulation of human acetyl-CoA carboxylase. Nature 558, 470–474, doi: 10.1038/s41586-018-0201-4 (2018). [DOI] [PubMed] [Google Scholar]
- 25.House CM et al. A binding motif for Siah ubiquitin ligase. Proc Natl Acad Sci U S A 100, 3101–3106, doi: 10.1073/pnas.0534783100 (2003). [DOI] [PMC free article] [PubMed] [Google Scholar]
- 26.Ji L. et al. The SIAH E3 ubiquitin ligases promote Wnt/beta-catenin signaling through mediating Wnt-induced Axin degradation. Genes Dev 31, 904–915, doi: 10.1101/gad.300053.117 (2017). [DOI] [PMC free article] [PubMed] [Google Scholar]
- 27.Garcia-Seisdedos H., Empereur-Mot C., Elad N. & Levy ED Proteins evolve on the edge of supramolecular self-assembly. Nature 548, 244–247, doi: 10.1038/nature23320 (2017). [DOI] [PubMed] [Google Scholar]
- 28.Slabicki M. et al. The CDK inhibitor CR8 acts as a molecular glue degrader that depletes cyclin K. Nature, doi: 10.1038/s41586-020-2374-x (2020). [DOI] [PMC free article] [PubMed] [Google Scholar]
- 29.Bellenie BR et al. Achieving In Vivo Target Depletion through the Discovery and Optimization of Benzimidazolone BCL6 Degraders. J Med Chem, doi: 10.1021/acs.jmedchem.9b02076 (2020). [DOI] [PMC free article] [PubMed] [Google Scholar]
Supplementary References
- 30.Meyers RM et al. Computational correction of copy number effect improves specificity of CRISPR-Cas9 essentiality screens in cancer cells. Nat Genet 49, 1779–1784, doi: 10.1038/ng.3984 (2017). [DOI] [PMC free article] [PubMed] [Google Scholar]
- 31.Donovan KA et al. Thalidomide promotes degradation of SALL4, a transcription factor implicated in Duane Radial Ray syndrome. Elife 7, doi: 10.7554/eLife.38430 (2018). [DOI] [PMC free article] [PubMed] [Google Scholar]
- 32.Abdulrahman W. et al. A set of baculovirus transfer vectors for screening of affinity tags and parallel expression strategies. Anal Biochem 385, 383–385, doi: 10.1016/j.ab.2008.10.044 (2009). [DOI] [PubMed] [Google Scholar]
- 33.Faust TB et al. Structural complementarity facilitates E7820-mediated degradation of RBM39 by DCAF15. Nat Chem Biol 16, 7–14, doi: 10.1038/s41589-019-0378-3 (2020). [DOI] [PMC free article] [PubMed] [Google Scholar]
- 34.Marze NA, Roy Burman SS, Sheffler W. & Gray JJ Efficient flexible backbone protein-protein docking for challenging targets. Bioinformatics 34, 3461–3469, doi: 10.1093/bioinformatics/bty355 (2018). [DOI] [PMC free article] [PubMed] [Google Scholar]
- 35.Enkhbayar P., Damdinsuren S., Osaki M. & Matsushima N. HELFIT: Helix fitting by a total least squares method. Comput Biol Chem 32, 307–310, doi: 10.1016/j.compbiolchem.2008.03.012 (2008). [DOI] [PubMed] [Google Scholar]
- 36.Zheng SQ et al. MotionCor2: anisotropic correction of beam-induced motion for improved cryo-electron microscopy. Nat Methods 14, 331–332, doi: 10.1038/nmeth.4193 (2017). [DOI] [PMC free article] [PubMed] [Google Scholar]
- 37.Rohou A. & Grigorieff N. CTFFIND4: Fast and accurate defocus estimation from electron micrographs. J Struct Biol 192, 216–221, doi: 10.1016/j.jsb.2015.08.008 (2015). [DOI] [PMC free article] [PubMed] [Google Scholar]
- 38.Wagner T. et al. SPHIRE-crYOLO is a fast and accurate fully automated particle picker for cryo-EM. Commun Bio l 2, 218, doi: 10.1038/s42003-019-0437-z (2019). [DOI] [PMC free article] [PubMed] [Google Scholar]
- 39.Zivanov J. et al. New tools for automated high-resolution cryo-EM structure determination in RELION-3. Elife 7, doi: 10.7554/eLife.42166 (2018). [DOI] [PMC free article] [PubMed] [Google Scholar]
- 40.Tan YZ et al. Addressing preferred specimen orientation in single-particle cryo-EM through tilting. Nat Methods 14, 793–796, doi: 10.1038/nmeth.4347 (2017). [DOI] [PMC free article] [PubMed] [Google Scholar]
- 41.Emsley P., Lohkamp B., Scott WG & Cowtan K. Features and development of Coot. Acta Crystallogr D Biol Crystallogr 66, 486–501, doi: 10.1107/S0907444910007493 (2010). [DOI] [PMC free article] [PubMed] [Google Scholar]
- 42.Adams PD et al. PHENIX: a comprehensive Python-based system for macromolecular structure solution. Acta Crystallogr D Biol Crystallogr 66, 213–221, doi: 10.1107/S0907444909052925 (2010). [DOI] [PMC free article] [PubMed] [Google Scholar]
- 43.Doench JG et al. Optimized sgRNA design to maximize activity and minimize off-target effects of CRISPR-Cas9. Nat Biotechnol 34, 184–191, doi: 10.1038/nbt.3437 (2016). [DOI] [PMC free article] [PubMed] [Google Scholar]
- 44.Sanjana NE, Shalem O. & Zhang F. Improved vectors and genome-wide libraries for CRISPR screening. Nat Methods 11, 783–784, doi: 10.1038/nmeth.3047 (2014). [DOI] [PMC free article] [PubMed] [Google Scholar]
- 45.Sperling AS et al. Patterns of substrate affinity, competition, and degradation kinetics underlie biological activity of thalidomide analogs. Blood 134, 160–170, doi: 10.1182/blood.2019000789 (2019). [DOI] [PMC free article] [PubMed] [Google Scholar]
Associated Data
This section collects any data citations, data availability statements, or supplementary materials included in this article.
Supplementary Materials
Data Availability Statement
Structural data have been deposited to the EMDB and RCSB (EMD-22265, PDB-6XMX). Proteome quantification data are available in the PRIDE repository (PXD016185). Uncropped gel and western blot source data are shown in Supplementary Figure 1. The flow cytometry gating strategy is displayed in Supplementary Figure 2. All source data associated with the paper are either included as SI or deposited.