

SUMMARY
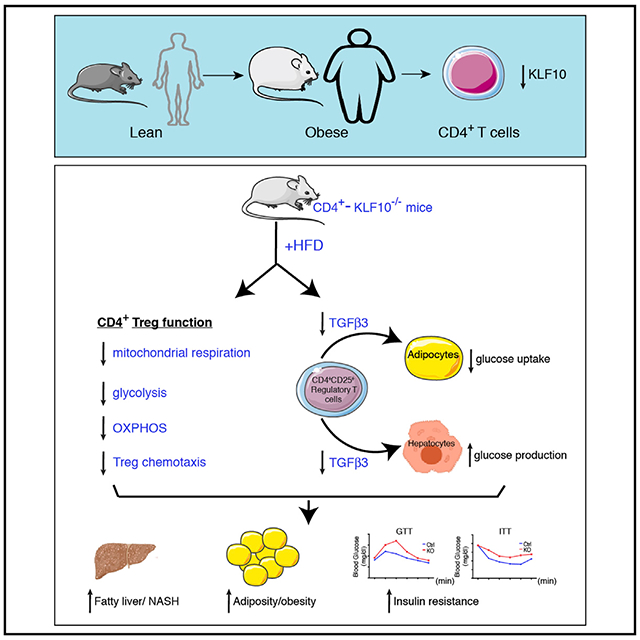
CD4+ T cells regulate inflammation and metabolism in obesity. An imbalance of CD4+ T regulatory cells (Tregs) is critical in the development of insulin resistance and diabetes. Although cytokine control of this process is well understood, transcriptional regulation is not. KLF10, a member of the Kruppel-like transcription factor family, is an emerging regulator of immune cell function. We generated CD4+-T-cell-specific KLF10 knockout (TKO) mice and identified a predisposition to obesity, insulin resistance, and fatty liver due to defects of CD4+ Treg mobilization to liver and adipose tissue depots and decreased transforming growth factor β3 (TGF-β3) release in vitro and in vivo. Adoptive transfer of wild-type CD4+ Tregs fully rescued obesity, insulin resistance, and fatty liver. Mechanistically, TKO Tregs exhibit reduced mitochondrial respiration and glycolysis, phosphatidylinositol 3-kinase (PI3K)-Akt-mTOR signaling, and consequently impaired chemotactic properties. Collectively, our study identifies CD4+ T cell KLF10 as an essential regulator of obesity and insulin resistance by altering Treg metabolism and mobilization.
Graphical Abstract
In Brief
Immune cell accumulation in adipose tissues and liver contributes to the development of insulin resistance and obesity. Wara et al. demonstrate that the transcription factor KLF10 is a critical regulator of CD4+ T regulatory cell accumulation in liver and adipose depots, leading to obesity, insulin resistance, and fatty liver.
INTRODUCTION
Obesity is increasing at an alarming rate worldwide with more than 650 million obese subjects with a body mass index (BMI) over 30 kg m−2 (WHO, 2018; NCD Risk Factor Collaboration, 2017). Obesity is accompanied by a high risk of insulin resistance and type 2 diabetes, which are major threats to global human health (Hotamisligil, 2006, 2017; Lee et al., 2018; Yamauchi and Kadowaki, 2013). Accumulating studies have linked inflammation, in particular T cells and macrophage subsets, with the onset of glucose intolerance, insulin resistance, hepatic steatosis, dyslipidemia, and the subsequent progression to diabetes (Brestoff and Artis, 2015; Reaven, 1988; Wellen and Hotamisligil, 2005) .
Immune cell activation and infiltration in metabolically critical organs, such as adipose tissues and liver, play a crucial role in obesity and insulin resistance (Brestoff and Artis, 2015). Interactions between adipocytes, macrophages, and T cells are a pathophysiological hallmark that underlies the chronic, low-grade inflammation of obesity and insulin resistance (Brestoff and Artis, 2015; Hotamisligil, 2006). Alteration of the delicate balance between pro- and anti-inflammatory immune subsets or their secreted repertoire of cytokines and chemokines can readily skew the local milieu toward metabolic impairment and the development of obesity and insulin resistance (Lee et al., 2018; Sell et al., 2012). For example, the localization of CD4+ T cells in metabolic tissues and the release of interferon-γ (IFN-γ) can induce macrophage phenotypic switching toward an M1 proinflammatory subtype, whereas CD4+ T cell secretion of interleukin-4 (IL-4), IL-13, or IL-10 can induce an M2 anti-inflammatory subtype, which are effects that contribute to the pathogenesis of obesity and insulin resistance in mice and humans (Wentworth et al., 2010). Although considerable attention has focused on macrophage and adipocyte interactions in the development of obesity and insulin resistance, the role of CD4+ T cell subsets that may impact these interactions is less understood.
Several different CD4+ T cell subsets are implicated in regulating adipose inflammation, obesity, and insulin resistance. In general, CD4+CD25− T cells (Teffs) such as T helper 1 (Th1) or Th17 promote adipose tissue inflammation, whereas T regulatory cells (Tregs) suppress immune responses (Bluestone et al., 2009; Newton et al., 2016). In the activation of CD4+ T cells, resting naive CD4+ T cells differentiate to Teffs and Tregs to exert immunological responses (Bluestone et al., 2009). Increasing Treg differentiation suppresses inflammation and maintains a normal homeostatic metabolic environment (Cipolletta, 2014; Fan and Turka, 2018; Tang and Vincenti, 2017; Zhang et al., 2017). Obesity and insulin resistance induce either a suppression of Treg differentiation or impairment of Treg function (Cipolletta et al., 2012; Feuerer et al., 2009; Wagner et al., 2013). The cellular metabolism of Tregs is mainly dependent on mitochondrial oxidation of lipid and pyruvate, although it also relies partially on glycolysis by a glucose transporter Glut1-independent pathway (Gerriets et al., 2016; Newton et al., 2016). In contrast, CD4+ Teffs use energy mostly from glycolysis by a Glut1-dependent pathway. The ratio of mitochondrial respiration to glycolysis also increases with enhanced expression of Foxp3, a marker of CD4+ Tregs (Gerriets et al., 2016). However, the mechanisms governing these metabolic effects in CD4+ T cells in response to obesity and insulin resistance are not well understood.
KLF10, a transforming growth factor β1 (TGF-β1) responsive transcription factor and member of the Kruppel-like zinc-finger family (KLF) (Cao et al., 2010; Subramaniam et al., 1995), regulates both CD4+CD25− T cell effectors and CD4+CD25+ Tregs (Cao et al., 2009). KLF10-deficient CD4+ T cells have impaired Treg differentiation, and the CD4+CD25− T cells are hyperactivated in vitro. Our prior studies and others demonstrated that KLF10 systemic knockout (KO) mice have a proinflammatory phenotype in response to ischemic vascular injury and atherosclerotic lesion formation (Beier et al., 2015; Cao et al., 2009; Gerriets et al., 2015; Wara et al., 2011b). However, a cell-autonomous role for KLF10 in CD4+ T cells and its role in regulating inflammation and metabolism in chronic disease states such as obesity-induced insulin resistance remain unknown. Here, we generated CD4+-T-cell-specific KLF10 KO (TKO) mice to explore its role in high-fat-diet (HFD)-induced obesity and insulin resistance. Our findings reveal that KLF10 deficiency in CD4+ T cells aggravates obesity and induces insulin resistance through distinct mechanisms involving impaired Treg chemotaxis into tissues and altered metabolic responses, which are effects that can be fully rescued by adoptive transfer of wild-type (WT) CD4+ Tregs.
RESULTS
CD4+ T Cells Exhibit Decreased KLF10 Expression in Obese Mice and Human Subjects
CD4+ T cells play an important role in the early inflammatory stages of obesity (Liston and Gray, 2014). Teffs contribute to macrophage accumulation in metabolically critical organs, whereas Tregs regulate inflammation by suppressive effects (Chatzigeorgiou et al., 2012). We (Cao et al., 2009; Khedkar et al., 2015) and others (Venuprasad et al., 2008; Xiong et al., 2012) demonstrated that the transcription factor KLF10 regulates both Teffs and Tregs; however, its cell-autonomous role in CD4+ T cells and its expression under obese conditions has not been elucidated. As a first step, we examined KLF10 expression in peripheral CD4+CD25− T cells (Teffs) and CD4+CD25+ Tregs (Tregs) from C57BL/6 mice fed either a chow or 12-week HFD. In response to HFD, KLF10 expression significantly decreased in Teffs and Tregs from both spleen and peripheral blood (Figures 1A and 1B). A similar reduction in KLF10 expression was observed in splenic Teffs and Tregs from db/db mice (Figures S1A and S1B). Furthermore, KLF10 expression was also significantly reduced in peripheral Teffs and Tregs of human subjects with BMI of >35 compared to normal BMI of <24 (Figure 1C).
Figure 1. CD4+ T Cells Exhibit Decreased KLF10 Expression in Obese Mice and Human Subjects.

(A) KLF10 relative expression in splenic CD4+CD25− T cells (Teffs) and CD4+CD25+ T regulatory cells (Tregs) after 12 weeks of chow diet or HFD conditions (n = 6 per group).
(B) KLF10 relative expression in peripheral blood CD4+CD25− T cells (Teffs) and CD4+CD25+ T regulatory cells (Tregs) after 12 weeks of chow diet or HFD conditions (n = 6 per group).
(C) KLF10 relative expression in CD4+ Teffs and Tregs from peripheral blood of human subjects with BMI of <24 or BMI of >35.
(D) KLF10 relative expression in subcutaneous adipose tissue (SAT) and visceral adipose tissue (VAT) after 12 weeks of chow diet or HFD conditions (n = 6 per group).
(E) KLF10 relative expression in CD4+ Teffs and Tregs of SAT and VAT after 12 weeks of chow diet or HFD conditions (n = 6 per group). Statistical differences are indicated as *p<0.05, **p<0.01, and ***p<0.001. Results are reported as mean ± SEM.
In response to obesity, adipose tissue depots such as subcutaneous adipose tissues (SATs) and visceral adipose tissues (VATs) develop adipocyte expansion, chronic inflammation, and metabolic dysfunction. KLF10 expression was reduced by 56% in SAT and 28% in VAT derived from HFD mice compared to chow diet mice (Figure 1D). Moreover, KLF10 expression was significantly reduced in Teffs and Tregs isolated from SAT and VAT of HFD mice (Figure 1E), thereby raising the possibility that KLF10 may regulate CD4+-T-cell-mediated functional effects in obesity.
CD4+ T Cell KLF10-Deficient Mice Develop Obesity, Insulin Resistance, Adipose Inflammation, and Fatty Liver with Reduced Treg Accumulation in Tissues
We generated CD4+ TKO mice to further investigate KLF10’s role in obesity and metabolism (Figures S1C-S1F). CD4-Cre mice were used as controls (WT mice); there were no differences in the acquisition of in vitro differentiated CD4+CD25+Foxp3+Tregs (iTregs) from WT CD4-Cre and KLF10-flox/flox mice (Figure S1G). Compared to WT mice after 12 weeks of HFD, TKO mice gained 61% more weight with higher total mass (Figures 2A and 2B, left) and showed a significantly higher percentage of body composition of fat mass and lower percentage of lean mass (Figure 2B, right). These TKO HFD-fed mice also developed glucose intolerance and insulin resistance (Figures 2C and 2D) and promoted gluconeogenesis in the liver (Figure S1H). In contrast, young chow-fed TKO and WT mice showed no difference in weight, glucose tolerance, or insulin resistance (Figures S1I-S1K), whereas older chow-fed TKO mice showed more glucose intolerance, insulin resistance (by insulin tolerance test [ITT]), and gluconeogenesis in the liver, despite no differences in body weight (Figures S1L-S1O). Although TKO mice had significantly increased plasma low-density lipoprotein cholesterol (LDL-c), there were no significant differences for total cholesterol, free fatty acid (FFA), or triglycerides (Table 1).
Figure 2. CD4+ T Cell KLF10-Deficient (TKO) Mice Develop Insulin Resistance, Fatty Liver, and Adipose Inflammation with Reduced Tissue Treg Accumulation.

(A) Body weights of WT and TKO mice over 12 weeks of HFD (n = 10 per group).
(B) Body composition of WT and TKO mice after HFD for 12 weeks (n = 6 per group).
(C and D) Glucose tolerance test (GTT) (C) and insulin tolerance test (ITT) (D) were performed on WT and TKO mice after 12 weeks of HFD (n = 10 per group). AUC, area under the curve.
(E) Representative liver sections were stained with oil red O (ORO) (top panels) or hematoxylin and eosin (H&E) (middle panels) or immunostained against Mac2 for macrophages (bottom panels) (n = 10 per group; 5 random fields for each mouse; scale bars, 100 μm)
(F and G) Representative sections of VAT and SAT immunostained against Mac2 (n = 10 per group; 5 random fields for each mouse; scale bars, 100 μm).
(H–J) Quantification by flow cytometry of CD25 and Foxp3 expression in CD4+ T cells in liver (H), VAT (I), and SAT (J) of WT and TKO mice. Bar graphs show percentages of CD4+CD25+Foxp3+ Treg cells and CD4+CD25+Foxp3− T cells (n = 4 mice per group).
(K–M) WT and TKO mice were placed on 4 weeks of HFD and assessed in metabolic cages. Energy expenditure (K) and energy expenditure regression plots correlated with total body weights are shown (L and M). Statistical differences are indicated as *p<0.05, **p<0.01, and ***p<0.001. NS, non-significant. Results are reported as mean ± SEM.
Related to Figures S1 and S2.
Table 1.
Circulating Lipid Profiles of HFD Mice
| Serum Lipid | WT | TKO | p Value |
|---|---|---|---|
| Cholesterol (mg/ml) | 133.1 ± 10.94 | 156.1 ±11.33 | 0.0806 |
| Triglyceride (mg/ml) | 104.6 ± 10.95 | 102.0 ± 14.47 | 0.8868 |
| HDL-c (mg/ml) | 31.86 ± 3.223 | 36.32 ± 3.839 | 0.1929 |
| LDL-c (mg/ml) | 70.25 ± 6.387 | 99.47 ± 7.004 | <0.01 |
| FFA (nmol/μl) | 275.8 ± 19.14 | 301.3 ± 15.42 | 0.1566 |
Lipid profiles for WT and TKO mice after 12 weeks high-fat diet.
Because diet-induced obesity promotes lipid metabolic dysfunction, inflammation, and immune cell accumulation in metabolically critical tissues, we explored lipid deposition, adiposity, and leukocyte profiling in liver, VATs, and SATs. Livers of TKO mice demonstrated substantially increased lipid droplets (up to 9.7-fold) by H&E and oil red O (ORO) staining accompanied by an influx of Mac2-positive macrophages (Figure 2E), indicating the presence of fatty livers in TKO mice compared to WT. Evaluation of livers for features of non-alcoholic steatohepatitis revealed no differences in fibrosis, as quantified by Sirius red (Figure S2F); however, one HFD TKO mouse developed accelerated fibrosis (Figure S2F). In addition, TKO mice developed hepatocyte ballooning and microvesicular steatosis consistent with an accelerated progression of fatty liver in the TKO mice (Figure S2G). In response to excessive caloric intake, lipid overload in adipose tissue depots develop low-grade inflammation and adipocyte expansion in size (Olefsky and Glass, 2010; Osborn and Olefsky, 2012; Weisberg et al., 2003). TKO mice exhibited higher macrophage accumulation, including “crown-like structures” by Mac2 staining compared to WT mice in VATs and SATs (Figures 2F and 2G). Furthermore, adiposity of TKO mice markedly switched from small (<2,000 μm2) to large (>4,000 μm2) adipocyte size in VATs and SATs (Figures S2A and S2B). Deficiency of Tregs in adipose tissues has been linked to the development of obesity-induced insulin resistance (Eller et al., 2011; Feuerer et al., 2009; Han et al., 2014; Winer et al., 2009). Examination for Foxp3+Tregs from CD4+ T cells in liver, VATs, and SATs demonstrated dramatically reduced accumulation of Foxp3+Tregs in liver (WT: 20.88% versus TKO: 7.23%), VATs (WT: 57.55% versus TKO: 27.40%), and SATs (WT: 22.53% versus TKO: 12.58%) (Figures 2H-2J; Figure S2H) that also corresponded with marked reductions in the ratio of Tregs to CD4+CD25− T cells in these tissues (Figures S2I-S2K). In contrast, reduced accumulation of Foxp3+Tregs was only observed in VATs, and not in SATs or liver, of older chow-diet-fed TKO mice (Figure S1P). The ability of CD4+CD25− T cells to differentiate into iTregs was also reduced more in HFD TKO mice than in chow-diet-fed TKO mice (Figure S1Q). Given the role of CD4+ Tregs in dampening tissue inflammation in obesity-induced insulin resistance, the reduction in Tregs in tissues of HFD-fed TKO mice raised the possibility of alteration in the balance of pro- and anti-inflammatory macrophage subsets. Indeed, TKO mice had significantly higher Ly6C+-high pro-inflammatory macrophages than WT mice in liver (WT: 5.03% versus TKO: 17.24%), VATs (WT: 3.70% versus TKO: 7.97%), and SATs (WT: 3.75% versus TKO: 4.73%) (Figures S2C-S2E). Taken together, these data indicate that KLF10 deficiency in CD4+ T cells markedly exacerbates obesity-induced fatty liver, adiposity, and insulin resistance, which are effects associated with the reduced presence of Tregs in liver, VATs, and SATs and increased accumulation of pro-inflammatory macrophages in these tissues.
TKO Mice Develop Reduced Energy Expenditure Independent of Total Body Mass or Food Intake
To gain insights into the major drivers in the development of obesity and insulin resistance in these mice, we used a comprehensive laboratory animal monitoring system (CLAMS) to analyze WT and TKO mice placed on chow or HFD for up to 4 weeks. Compared to WT mice, TKO mice on 4 weeks of HFD had significantly reduced energy expenditure (Figure 2K; Figures S3A-S3E), which was maintained for total body mass as shown in regression plots (Figures 2L and 2M). These findings occurred despite no changes in hourly food consumption (Figure S3C), locomotor activity (Figure S3D), or ambulatory activity (Figure S3E). In addition, TKO mice after just 4 weeks of HFD developed glucose intolerance and insulin resistance (Figures S3F and S3G). Interestingly, WT and TKO 8- to 10-week-old mice fed a chow diet showed an increase in respiratory exchange ratio (Figure S3K), suggesting that they are already developing a metabolic defect despite no change in body weight and other metabolic parameters (Figures S3H-S3J and S3L-S3O). Indeed, an independent group of older chow-diet-fed TKO mice develop insulin resistance without a change in weight compared to controls (Figures S1I-S1K). Collectively, these data indicate that food intake and central obesity are not the main drivers of insulin resistance in the TKO HFD mice. Rather, these data suggest that impaired Treg chemotaxis or elaboration of factors derived from TKO Tregs may contribute to paracrine effects on insulin resistance in peripheral tissues.
TKO Tregs Display Marked Defects in Mobilization In Vitro and In Vivo
Tregs possess powerful immunosuppressive functions and contribute to homeostatic control of inflammation in both liver and adipose tissues (Pucino et al., 2014). To gain insights into the reduced accumulation of Tregs observed in liver, VATs, and SATs of HFD-fed TKO mice (Figures 2H-2J), TKO and WT CD4+ T cells from HFD mice underwent a range of T cell functional assays. Consistent with our prior report using CD4+ T cells from systemic KLF10−/− mice on chow diet (Cao et al., 2009), TKO CD4+ T cells from HFD-fed mice exhibit significantly reduced iTregs over the course of 6 days in response to CD3 antibodies and TGF-β (Figure 3A). In addition, in response to T cell receptor (TCR) activation, TKO CD4+CD25− T cells expressed higher levels of several pro-inflammatory markers than WT CD4+CD25− T cells for Th1 markers, such as IFN-γ, MIP1α, T-bet, and TNF-α, suggesting that these cells are predisposed to a hyperactivated state (Figures 3B and 3C). Moreover, we explored the ability of TKO and WT Tregs to migrate in modified Boyden transwell assays. TKO Tregs migrated 73% less than WT Tregs in response to the chemokine CCL19, but not to CCL20 (Figures 3D and 3E). Due to the selectivity of chemokine responses, TKO and WT Tregs were examined for expression of the corresponding chemokine receptors. Consistent with the migration assays, TKO Tregs demonstrated reduced expression for the CCL19-ligand receptor CCR7 compared to WT Tregs, whereas no differences were observed for the CCL20-ligand receptor CCR6 (Figures 3F and 3G). In order to observe Treg mobilization to metabolically critical tissues such as liver, SATs, and VATs, we adoptively transferred PKH26-labeled Tregs from WT or TKO HFD-fed mice into HFD-WT mice and harvested tissues 48 h later for Treg accumulation. TKO Tregs exhibited a significant defect in mobilization to liver (WT: 5.39% versus TKO: 0.93%), VATs (WT: 7.56% versus TKO: 3.81%), and SATs (WT: 3.33% versus TKO: 2.61%) (Figure 3H). To explore potential paracrine mechanisms by which Tregs may contribute to insulin resistance, we performed co-culture experiments with iTregs, 3T3-L1-dervied mature adipocytes, and mouse primary hepatocytes. Compared to supernatants from WT iTregs, supernatants from HFD TKO iTregs significantly reduced adipocyte glucose uptake by 44% (Figures 3I and 3J) and significantly increased glucose production by 74% in primary hepatocytes (Figures 3K and 3L). Evaluation of the supernatants by ELISA revealed that compared to HFD WT iTregs, HFD TKO iTregs had markedly lower concentration of TGF-β3, (Figure S4B), a critical growth factor implicated in adiposity, glucose intolerance, and weight gain (Petrus et al., 2018). A similar reduction in circulating TGF-β3 expression was present in the plasma of TKO mice compared to WT mice on HFD (Figure S4A). Furthermore, exogenous administration of recombinant TGF-β3 completely rescued the impaired glucose uptake in differentiated 3T3-L1 cells and the elevated glucose production in mouse primary hepatocytes when co-cultured with supernatants from HFD TKO Tregs (Figures S4C and S4D). In addition, there were reduced numbers of TGF-β3+ Tregs in VATs and spleens in TKO HFD mice compared to those of WT HFD mice (Figures S4E-S4G). A prior report indicated that TGF-β3+/− mice contained reduced adipocyte progenitors in adipose depots with the development of adipocyte hypertrophy and insulin resistance (Petrus et al., 2018). Consistent with these observations, we found a reduced percentage of CD45−/CD31−/CD34+ adipocyte progenitors in VATs in TKO HFD mice compared to that of WT HFD mice (Figure S4H). Finally, to assess if TKO Tregs exhibited reduced suppressor function that could also contribute to the elevated leukocyte inflammation observed in these metabolically critical tissues, we performed Treg suppression assays in which splenic Tregs were co-cultured with splenic Teffs. Interestingly, the suppressive function of HFD TKO Tregs was not reduced and exhibited modestly higher suppressor function (Figure S4J), indicating that the higher inflammation observed in liver, SATs, and VATs was not due to altered suppressive capacity of TKO Tregs (Figure 2). Taken together, these data indicate that the marked dysfunction in mobilization of TKO Tregs coupled with reduced expression of TGF-β3 underlie the accelerated HFD-induced tissue inflammation in the TKO mice.
Figure 3. TKO Tregs Display Marked Defects in Mobilization In Vitro and In Vivo.

(A) CD4+CD25− T cells from spleens of WT and TKO mice after 12 weeks of HFD were treated with anti-CD3 antibodies and TGF-β1 for differentiation into in vitro differentiated Tregs (iTregs). Percentage of WT and TKO CD4+CD25+Foxp3+ Tregs were measured by flow cytometry at the indicated time points (n = 6 per group). (B and C) CD4+CD25− T cells from spleens of WT and TKO mice after 12 weeks of HFD were activated by anti-CD3 antibodies for 24 h and subjected to qRT-PCR analysis (B) or ELISA from supernatants (C) for the indicated cytokines, chemokines, and growth factors (n = 5–9 per group).
(D and E) Transwell migration study of CD4+CD25+ Tregs isolated from WT and TKO mice after 12 weeks of HFD. Cells were assessed for migration in the presence or absence of CCL19 (D) or CCL20 (E) (n = 3 per group).
(F and G) Flow cytometry for CCR7 (F) or CCR6 (G) expression in WT and TKO Tregs (n = 6 per group).
(H) Schematic of PKH26-labeled HFD WT and TKO Tregs adoptively transferred to HFD C57BL/6 mice. Flow cytometry shows percentage of PKH26-expressed cells in liver, VAT, and SAT of recipient mice (n = 6 per group).
(I and J) Schematic of glucose uptake study of differentiated 3T3-L1 cells co-cultured with HFD WT and TKO iTreg supernatant (supe) (I). (J) Fluorescence intensity of 2-Deoxy-D-glucose (2-DG) uptake by differentiated 3T3-L1 cells co-cultured with supernatants of WT and TKO CD4+ Tregs in the presence or absence of insulin stimulation (n = 4 per group).
(K and L) Schematic of glucose production study of mouse primary hepatocytes co-cultured with HFD WT and TKO iTreg supernatants (K). (L) Glucose production by mouse primary hepatocytes co-cultured with supernatants of HFD WT and TKO CD4+ Tregs (n = 6 per group).
Statistical differences are indicated as *p<0.05, **p<0.01, and ***p<0.001. Results are reported as mean ± SEM.
Related to Figures S3 and S4.
Adoptive Transfer of WT Tregs Fully Rescues Obesity, Insulin Resistance, and Fatty Liver in TKO Mice
Because TKO Tregs exhibited mobilization defects to metabolically important tissues, we hypothesized that WT CD4+ Tregs may be sufficient to rescue the obesity, insulin resistance, and fatty liver observed in the HFD-fed TKO mice. Remarkably, by transferring WT Tregs to TKO mice over 12 weeks, HFD induced normalization of weight gain in TKO mice; in contrast, TKO Tregs adoptively transferred to TKO HFD-fed mice over the same period continued to gain weight (Figures 4A and 4B) with increased composition of fat mass (Figure 4C). Delivery of WT Tregs also improved the circulating lipid profile (cholesterol and LDL) (Figures S5A-S5E). There was higher Foxp3 expression detected in liver, VATs, and SATs in mice that received adoptively transferred WT Tregs than TKO Tregs (Figures S5F-S5H). However, adoptively transferred WT and TKO CD4+CD25− T effector cells into HFD WT or TKO mice had no effect on insulin resistance (Figures S5I and S5J). Moreover, the insulin intolerance of TKO mice that received WT Tregs was completely rescued (Figures 4D and 4E). Although there were no differences in overall GTT by area under curve analyses, there was a trend toward significance for glucose intolerance in the TKO group at the 15-min time point—the TKO mice had a ~25% worse trend for glucose tolerance compared to WT mice (p = 0.09) (Figure 4D). Differences between Figure 4D and Figure 2C may reflect exposure to weekly PBS injections, which potentially provide a different stress environment. In addition, adoptive transfer of WT Tregs also inhibited histopathological changes in TKO HFD-fed mice, including the development of fatty liver (Figure 4F), the accumulation of macrophages and “crown-like” structures in VATs and SATs (Figures 4G and 4H, top), and the switch in adiposity from small to large adipocytes (Figures 4G and 4H, bottom). Finally, WT Treg adoptive transfer to TKO mice also improved circulating levels of insulin and C-peptide (Figure 4I). Collectively, these findings indicate that the obesity, insulin resistance, fatty liver, and adipose tissue inflammation found in the TKO HFD-fed mice could be effectively rescued by WT Tregs, thereby highlighting that dysfunction of TKO Treg mobilization likely underlies these metabolic phenotypes.
Figure 4. Adoptive Transfer of WT Tregs Fully Rescues Obesity, Insulin Resistance, and Fatty Liver in TKO Mice.

(A) Schematic of adoptively transferred splenic WT and TKO CD4+ Tregs (500,000 cells/mouse per week) into WT and TKO recipient mice during 12 weeks of HFD (n = 6 per group).
(B) Body weights of the four recipient mouse groups over 12 weeks: (1) WT mice + phosphate-buffered saline (PBS), (2) TKO mice + PBS, (3) TKO mice + WT Tregs, and (4) TKO mice + TKO Tregs (n = 6 per group).
(C) Body composition of the four recipient mouse groups over 12 weeks: (1) WT mice + PBS, (2) TKO mice + PBS, (3) TKO mice + WT Tregs, and (4) TKO mice + TKO Tregs (n = 6 per group).
(D and E) GTT (D) and ITT (E) were performed on the indicated recipient HFD mice after 12 weeks (n = 6 per group).
(F) Representative liver sections were stained with ORO (n = 6 per group; 5 random fields per mouse; scale bars, 100 μm).
(G and H) Representative sections of VAT and SAT were immunostained against Mac2 for macrophages (n = 6 per group; 5 random fields per mouse; scale bars, 100 μm). Bar graphs on the right (top) represent percentage of Mac2 staining as percentage of whole field; bar graphs on the right (bottom) represent counts of crown-like structures. Beneath the images, pie charts and bar graphs represent the percentages of small, medium, and large adipocytes in each group.
(I) Plasma concentrations of metabolism-related hormones insulin, C-peptide, resistin, and leptin in the indicated groups after 12 weeks HFD (n = 6 per group). Statistical differences are indicated as *p<0.05, **p<0.01, and ***p<0.001. Results are reported as mean ± SEM.
Related to Figure S4.
Signaling Pathway Analysis of KLF10 Deficiency in CD4+ T Cells
To explore the signaling pathways and biological processes affected by KLF10 deficiency in CD4+ T cells, genome-wide RNA sequencing (RNA-seq) was performed on splenic CD4+ Teffs and Tregs from WT and TKO mice after 12 weeks of HFD. Approximately 560 genes were significantly dysregulated (fold change, 1.5; p < 0.05; RPKM, >1) in TKO Tregs compared to WT Tregs by ingenuity pathway analyses (IPAs). Top Gene Ontology (GO) pathways for molecular and cellular functions included cell death and survival, free radical scavenging, and lipid metabolism (Figure 5A). Similar IPA of 569 genes differentially regulated in Teffs from HFD-fed WT and TKO mice identified similar pathways, including cellular growth and proliferation, cell death and survival, and free radical scavenging (Figure 5G). Interrogation of specific signaling pathways enriched from the dysregulated Treg and Teff gene sets revealed that oxidative phosphorylation, glycolysis, and PI3K-Akt-mTOR signaling pathways were among the top signaling pathways altered in HFD TKO Tregs (Figures 5B-5F) and Teffs (Figures 5H-5L) by either IPA or gene set enrichment analysis (GSEA). It also revealed several common disease states associated with both Tregs and Teffs, including metabolic and inflammatory disease (Figures S6A-S6F). Interestingly, further analyses showed that 18 of the 23 genes belonging to metabolic disease were also associated with diabetes and hepatic steatosis, such as ccr5, stk32c, Tgfbi, gpx1, and Apoe (Figures S6G-S6I). Moreover, compared to WT Tregs, enrichment plots from GSEA demonstrated reduced gene abundance in oxidative phosphorylation and PI3K-Akt-mTOR pathways in TKO Tregs (Figure 5E) and decreased oxidative phosphorylation and PI3K-Akt-mTOR pathways in TKO Teffs compared to WT Teffs (Figure 5K). Consistent with these findings, TKO Tregs and Teffs displayed significant reductions in the expression of p-AKT, p-ERK1/2, and p-mTOR (Figures 5F and 5L). Collectively, these data indicate that TKO Tregs and Teffs demonstrate altered gene enrichment for key metabolic signaling pathways and processes typically involved in mitochondrial respiration and glycolysis.
Figure 5. Signaling Pathway Analysis of KLF10 Deficiency in CD4+ T Cells.

CD4+CD25+ Tregs and CD4+CD25− Teffs isolated from spleens of WT and TKO mice after 12 weeks of HFD mice were subjected to the following analyses.
(A) Gene Ontology (GO) analyses of molecular and cellular functions of WT and TKO Tregs based on fold change (FC) of >1.5, p < 0.05, and RPKM of >1 genes (560 genes) by ingenuity pathway analysis (IPA) (n = 2–3 mice per group).
(B) Signaling pathway analysis of WT and TKO Tregs based on full set of genes (48,440 genes) by gene set enrichment analysis (GSEA).
(C) Heatmap of representative genes involved in oxidative phosphorylation, PI3K-Akt-mTOR signaling, TGF-beta signaling, and glycolysis in WT and TKO Tregs.
(D) Representative signaling pathway network. Pink represents genes up-regulated in TKO compared to WT Tregs. Gray represents genes affected but without significant FCs. Green represents down-regulated genes in TKO Tregs.
(E) Enrichment plots of WT versus TKO Tregs in oxidative phosphorylation (top) and PI3K-Akt-mTOR (bottom) signaling pathways.
(F) Western blot analyses for p-Akt-ser473, total-AKT (T-AKT), p-ERK, total-ERK (T-ERK), p-mTOR, and total mTOR (T-mTOR) protein expression of Tregs from WT and TKO mice after 12 weeks of HFD (lysates pooled from n = 4 mice per group).
(G) GO analyses of molecular and cellular functions of WT and TKO Teffs based on FC of >1.5, p < 0.05, and RPKM of >1 genes (560 genes) by IPA (n = 2 mice per group).
(H) Signaling pathway analysis of WT and TKO Teffs based on full set of genes (48,440 genes) by GSEA.
(I) Heatmap of representative genes involved in oxidative phosphorylation, PI3K-Akt-mTOR signaling, TGF-beta signaling, and glycolysis in WT and TKO Teffs.
(J) Representative signaling pathway network. Pink represents genes up-regulated in TKO compared to WT Teffs. Gray represents genes affected but without significant FCs. Green represents genes down-regulated in TKO Teffs.
(K) Enrichment plots of WT vs TKO Teffs in oxidative phosphorylation (top) and PI3K-Akt-mTOR (bottom) signaling pathways.
(L) Western blot analyses for p-Akt-ser473, T-AKT, p-ERK, T-ERK, p-mTOR, and T-mTOR protein expression of Teffs from WT and TKO mice after 12 weeks of HFD (lysates pooled from n = 4 mice per group).
Related to Figure S5.
TKO Tregs Exhibit Severe Dysfunction in Oxidative Phosphorylation and Glycolysis
CD4+ T cell subsets use different means for energy production and utilization. Tregs typically rely upon mitochondrial respiration, whereas Teffs depend more on glycolysis. We first examined mitochondrial oxygen consumption rates (OCRs) from iTregs and Teffs from WT and TKO mice after 12 weeks HFD. Compared to WT control (ctrl), both TKO CD4+ T cell subsets had reduced OCRs (Figures 6A and 6B). TKO iTregs had reduced OCR at baseline (by 51%) and exhibited significant reduction in ATP production (by 51%) and proton leak (by 51%) compared to WT iTregs (Figure 6A). In contrast, basal OCR in TKO Teffs was slightly reduced (by 25%), whereas respiratory capacity was markedly reduced 82% (Figure 6B). To examine effects of TKO CD4+ T cell subsets on glycolysis, extracellular acidification rates (ECARs) were quantified from iTregs and Teffs from WT and TKO mice after 12 weeks of HFD. Although TKO iTregs showed a significant reduction in glycolytic capacity and glycolytic reserve compared to WT iTregs (Figure 6C), there were non-significant trends observed in Teffs (Figure 6D). To further clarify the marked reduction in OCR in HFD TKO CD4+ T cells, we assessed the relative expression of mitochondrial oxidative phosphorylation (OXPHOS) complexes I to V, which collectively use reducing equivalents from oxidized fuels to generate the proton gradient across the inner mitochondrial membrane and ATP production (DiMauro and Schon, 2003). HFD TKO iTregs displayed marked decreases in complexes I, II, III, IV, and V compared to HFD WT iTregs (Figure 6E). The reduction in OXPHOS in HFD TKO Tregs was generally more pronounced than the more modest reduction in OXPHOS in HFD Teffs (Figure 6F). However, both HFD TKO subsets exhibited reductions in mitochondrial mass (Figures 6G and 6H). Collectively, these data indicate that HFD TKO CD4+ Tregs exhibit defects in mitochondrial oxidative respiration with more modest decreases in glycolytic function.
Figure 6. TKO Tregs Exhibit Severe Defects in Oxidative Phosphorylation and Glycolysis.

(A and B) Oxygen consumption rates (OCRs) of iTregs (A) or CD4+CD25− Teffs (B) from spleens of WT or TKO mice after 12 weeks of HFD as measured by Seahorse (n = 4 per group).
(C and D) Extracellular acidification rates (ECARs) of iTregs (C) or CD4+CD25− Teffs (D) from WT or TKO mice after 12 weeks of HFD as measured by Seahorse (n = 4 per group).
(E and F) Oxidative phosphorylation (OXPHOS) complexes I–V were detected by western blot analyses and quantified using Image J of iTregs (E) or CD4+CD25− Teffs (F) from WT or TKO mice after 12 weeks of HFD (lysates from n = 4 mice were pooled for each group).
(G and H). Histograms represent MitoTracker staining of iTregs (G) or CD4+CD25− Teffs (H) from WT or TKO mice after 12 weeks of HFD. Bar graphs represent MitoTracker percentages in WT and TKO groups compared to unstained control group (n = 6 per group). Statistical differences are indicated as *p<0.05, **p<0.01, and *** p<0.001. Results are reported as mean ± SEM.
DISCUSSION
Obesity-associated insulin resistance is driven in part by low-grade inflammation in adipose tissue and liver through the accumulation of diverse innate and adaptive immune cell subsets. CD4+ T cell regulation of immune-adipose tissue crosstalk is a critical paradigm leading to the progression of obesity and obesity-associated disease states (Becker et al., 2017; Panduro et al., 2016). Circulating CD4+ T cell frequency is positively associated with increased BMI and obesity in human subjects (Pecht et al., 2014; Womack et al., 2007). Accumulation of adipose CD4+ Teffs promote adipose tissue inflammation and insulin resistance in mice (Strissel et al., 2010; Winer et al., 2009) and is associated with insulin resistance and systemic inflammation in human subjects (Fabbrini et al., 2013). Factors that control the recruitment and composition of CD4+ T cell subsets in tissues may inform new targets in the development of insulin resistance. Here, we found that KLF10 expression is reduced in circulating CD4+ T cells from HFD (Figure 1B), db/db mice (Figures S1A and S1B), and in Tregs in human subjects with increased BMI (Figure 1C), raising the possibility that KLF10 contributes to CD4-mediated regulation of obesity and insulin resistance. In support, we identified a protective role for CD4-T-cell-derived KLF10 in the maintenance of obesity, insulin resistance, and fatty liver. Adoptive transfer studies revealed that TKO Tregs accumulated significantly less in adipose tissues and livers of HFD mice than adoptively transferred WT Tregs (Figure 3), an effect likely due to the marked defects in mitochondrial respiration and glycolytic function in HFD TKO CD4+ Tregs. WT Tregs, but not TKO Tregs, fully rescued the obesity, insulin resistance, VAT and SAT adiposity, inflammation, and fatty liver observed in HFD TKO mice (Figure 4). Collectively, these findings highlight a critical role for KLF10 in orchestrating CD4+ Treg mobilization into tissues, an effect that a predisposition to obesity, insulin resistance, and fatty liver disease.
In theory, the deletion of KLF10 in CD4+ T cells could have either increased fat weights and, as a consequence, drove insulin resistance; or KLF10 deficiency in CD4+ T cells could directly affect insulin resistance. Our findings support the latter, as we found that despite no differences in body weights (Figure S1O), chow-fed older TKO mice developed significant impairment in glucose tolerance (by glucose tolerance test [GTT]; Figure S1L), insulin sensitivity (by ITT; Figure S1M), and hepatic glucose production (by pyruvate tolerance test [PTT], Figure S1N) compared to WT mice. These data demonstrate that TKO deficiency in CD4+ T cells is sufficient to produce insulin resistance and impaired glucose homeostasis in the absence of obesity. In addition, we assessed whether CD4-derived KLF10 contributes to obesity per se by placing WT and TKO mice in metabolic cages (CLAMS) after 4 weeks of HFD before body weights had diverged. As shown in Figures 2K-2M and S3A-S3E, TKO mice placed on HFD had significantly reduced energy expenditure despite no significant change in food intake or locomotion or ambulatory activity, and the significant decrease in energy expenditure was maintained as shown in regression plots for total body mass. In addition, TKO mice developed significant exacerbation in glucose tolerance (by GTT) and insulin tolerance (by ITT) at this early time point (Figures S3F and S3G). Interestingly, evaluation of younger chow-fed TKO and WT mice in metabolic cages demonstrated an early increase in their respiratory exchange ratio (Figure S3K), suggesting that they are already developing a metabolic defect despite no change in body weights.
Accumulating studies demonstrate that alterations in adipose-tissue-resident CD4+ T subpopulations disrupt the ratio of pro-inflammatory M1 and anti-inflammatory M2 macrophages, a critical balance that controls adiposity, fatty liver, and metabolism (Huh et al., 2014). In particular, deficiency or impairment of CD4+ Tregs exacerbates HFD-induced obesity and insulin resistance in mice. For example, the maintenance of Tregs in VATs of HFD-fed obese mice resulted in a significant decrease in body weight gain, VAT mass, and adipocyte size (Cipolletta et al., 2012; Tian et al., 2011). However, the regulators of Treg-associated immune homeostasis in adipose tissue depots are poorly understood. Our findings demonstrate that KLF10 expression in CD4+ T cells is important for the maintenance of adipose tissue CD4+ Tregs and adipose tissue inflammation in HFD-fed mice (Figures 2F, 2G, 2I, and 2J). Consistent with these observations, expansion of adipose Tregs attenuated adipose tissue inflammation and improved insulin sensitivity in HFD-fed obese mice and ob/ob mice (Ilan et al., 2010; Kolodin et al., 2015; Pettersson et al., 2012), whereas depletion of VAT Tregs by anti-CD25 monoclonal antibody aggravated insulin resistance and increased VAT inflammation in db/db mice (Eller et al., 2011). Moreover, HFD TKO Tregs had impaired chemotaxis to CCL19, which has been implicated in the progression of obesity in mice (Sano et al., 2015; Sharma et al., 2015) and human subjects (Kochumon et al., 2018). In addition, supernatants from HFD TKO Tregs interfered with 3T3-L1 adipocyte glucose uptake and exacerbated hepatocyte glucose production (Figures 3I-3L), suggesting a potential paracrine effect contributing to insulin resistance. Indeed, ELISA-based studies revealed a marked deficiency of TGF-β3 in the supernatants of HFD TKO iTregs, and exogenous TGF-β3 fully rescued these defects mediated by HFD TKO iTreg supernatants (Figures S4B and S4C). Moreover, circulating levels of TGF-β3 expression, but not TGF-β1 or TGF-β2, in HFD TKO mice were significantly reduced compared to WT HFD mice. These findings are consistent with a recent report that TGF-β3-deficient mice exhibit increased adiposity, glucose intolerance, and weight gain (Petrus et al., 2018). Although this report suggested that TGF-β3 deficiency was associated with a reduction in adipocyte precursor proliferation, the authors concluded that this did not exclude that other factors may contribute to cellularity of adipose tissue depots. Specifically, they note that although TGF-β3 is enriched in adipocyte progenitors (CD45−CD31−CD34+ cells), it is also expressed in immune cells, which they speculated could have also contributed to effects on adipose cellularity in the TGF-β3+/− mice (Petrus et al., 2018). Consistent with this premise, we found that the percentage of CD4+Foxp3+TGF-β3+ Tregs in VATs and spleens was markedly lower in HFD-fed TKO mice than in WT mice (Figures S4E and S4G). Moreover, we found that TKO mice on HFD have reduced CD45−CD31−CD34+ adipocyte progenitors in VATs compared to WT HFD mice (Figure S4H). Collectively, the impaired Treg mobilization and accumulation in adipose tissue and liver coupled with the TGF-β3 paracrine defects from TKO Tregs contribute to the HFD-induced obesity and insulin resistance in the TKO mice. Future studies will be of interest to assess the role of TGF-β3 in our TKO mice, for example by crossing to the TGF-β3+/− mice to assess for dependency or delivery of recombinant TGF-β3 to assess for rescue of the insulin resistance and obesity phenotype. In this context, whether TGF-β3 facilitates insulin-stimulated glucose uptake in fat depots will also be of future interest.
The contribution of CD4+ T cell subsets in the development of fatty liver and non-alcoholic steatohepatitis (NASH) is poorly defined. Emerging studies indicate that higher Teff to Treg ratios cause a predisposition to intrahepatic inflammation, fatty liver, and progression to NASH in both mice and human subjects (Bertola et al., 2010; Inzaugarat et al., 2011; Kremer et al., 2010; Pacifico et al., 2006; Rau et al., 2016; Sutti et al., 2015; Vonghia et al., 2015). Our studies demonstrated that HFD-fed TKO mice exhibited a significant reduction in Treg accumulation associated with increased intrahepatic Ly6C+-hi M1 macrophage inflammation and lipid deposition (Figures 2 and S2). In addition, adoptive transfer of WT Tregs, but not TKO Tregs, fully rescued the macrophage accumulation and fatty livers (Figure 4). The reduction in HFD TKO Treg accumulation was most severe in the liver compared to SAsT and VATs, which corresponded to a more pronounced increase in expansion of Teffs (Figures 2H-2J). These findings highlight that reduced Tregs in the liver facilitates pro-inflammatory responses, leading to macrophage accumulation, lipid deposition, and insulin resistance.
Alterations in components of the AKT-PI3K-mTOR signaling pathway are sufficient to reprogram mitochondrial metabolism, leading to impaired Treg differentiation, suppression, or mobilization depending on the cellular context (Cunningham et al., 2007; Zeng et al., 2013). For example, mTOR deficiency in Tregs drove spontaneous effector T cell activation and inflammation in tissues (Chapman et al., 2018). Furthermore, deficiency of Raptor or Tfam impaired Treg accumulation in tissues (Xu et al., 2017). Interestingly, loss of mTOR or Raptor and Rictor in Tregs led to extensions in lifespan in mice, an effect that may be associated with reduced tissue inflammation (Zeng et al., 2013). We found that Tregs from HFD-fed TKO mice exhibited severely impaired OXPHOS and glycolysis, an effect associated with their impaired migratory properties and mobilization into tissues and increased inflammation in liver, VATs, and SATs (Figures 2 and 3). Expression of p-AKT was markedly reduced in TKO HFD CD4+ Tregs (Figure 5F). These findings are consistent with a study that found activation of PI3K-AKT signaling is required for Treg migration (Kishore et al., 2017). Moreover, disruption of PI3K-AKT signaling led to reduced Treg glycolysis (Kishore et al., 2017), an effect also observed in HFD TKO Tregs (Figure 6C). Furthermore, multiple predicted databases (mSigDB, TRED, EEDB, Amadeus, bZIPDP, and OregAnno) in combination with IPA verified several key targets of KLF10 that are involved in the AKT-PI3K-mTOR signaling (Hsu et al., 2011; Johnsen et al., 2002; Lin et al., 2015; Sakaguchi et al., 2005; Yang et al., 2017; Table S1). Finally, although activation of PI3K-AKT signaling was required for enhancement of glycolysis and Treg migration, there were no differences in Treg suppressive capacity (Kishore et al., 2017). Consistent with these observations, although HFD TKO Tregs had reduced AKT signaling and glycolytic activity, there was no impairment in TKO Treg suppressive capacity (Figure S4J). In addition, HFD TKO Tregs exhibited significantly reduced energy production with lower mitochondrial ATP production compared to WT TKO Tregs (Figure 6), which may contribute to Treg immobility (Desdín-Micó et al., 2018; Ledderose et al., 2018). Collectively, these data indicate that TKO Tregs exhibit marked intrinsic defects in AKT signaling associated with reduced glycolysis, mitochondrial respiration, and subsequent Treg accumulation in tissues, effects enabling a more permissive expansion of pro-inflammatory macrophage accumulation, adiposity, and development of insulin resistance.
Limitations in this study include the possibility that the mechanisms by which the older TKO mice on a normal chow diet develop insulin resistance (without a change in body weight) may be different than TKO mice on a HFD that develop insulin resistance and obesity. In addition, although TKO HFD mice have increased inflammation of the liver, SATs, and VATs, whether this directly contributes to the reduced energy expenditure in these mice will require further study. Finally, we find that TKO mice on HFD have reduced numbers of adipocyte progenitors. It is possible that TKO CD4+ Tregs may impact either the total number of these adipocyte progenitors or increase their adipocyte differentiation, thereby reducing the pool of adipocyte progenitors. In support of the latter, our studies indicate that there is reduced TGF-β3 release from TKO CD4+ Tregs, and TGF-β3 heterozygous mice on HFD harbor reduced numbers of adipocyte progenitors and a higher number of cells undergoing differentiation in vitro (Petrus et al., 2018). Future studies will be of interest to assess these two possibilities.
In summary, our study revealed that CD4+-T-cell-specific KLF10-deficient mice on HFD develop obesity, insulin resistance, and fatty liver due to defects of CD4+ Treg mobilization to adipose tissue depots and liver, effects that were fully rescued by WT CD4+ Tregs and not TKO Tregs. Tregs lacking KLF10 exhibit marked intrinsic defects in mitochondrial respiration, OXPHOS, glycolysis, PI3K-Akt-mTOR signaling, and consequently impaired chemotactic properties. In addition, paracrine defects in TGF-β3 expression in TKO regs interfered with adipocyte glucose uptake in vitro, and TGF-β3+ Tregs were reduced in VATs in vivo. Collectively, these findings establish KLF10 as a metabolic checkpoint in Tregs that couples metabolic regulation to immune homeostasis, obesity, and insulin resistance.
STAR★METHODS
RESOURCE AVAILABILITY
Lead contact
Further information and requests for resources and reagents should be directed to and will be fulfilled by the Lead Contact, Mark W. Feinberg, mfeinberg@bwh.harvard.edu
Materials availability
This study generated CD4+-KLF10 KO mice; these are available upon reasonable request.
Data and code availability
The mouse gene expression data are deposited in the National Center for Biotechnology Gene Expression Omnibus (https://www.ncbi.nlm.nih.gov/geo/), accession number GSE139977.
EXPERIMENTAL MODEL AND SUBJECT DETAILS
Mice
The floxed-KLF10 mice (C57BL/6 background) were generated by inserting a loxP site flanking the first two exons as previously described (Weng et al., 2017). CD4-specific KLF10 knockout mice were generated by crossing KLF10flox/flox mice and CD4-Cre transgenic mice (re-named wild-type (WT) mice) obtained from Taconic Biosciences (Stock #4196). We used WT CD4-Cre mice and KLF10flox/flox mice as controls. Mice were fed either a standard chow or high-fat diet (60% kcal from fat (D12492i, Research Diets Inc.); 6-18 weeks of age, or as indicated) ad libitum. All mice were males and maintained on a 12-hour light/dark cycle in a pathogen-free animal facility. Littermates of the same sex were randomly assigned to experimental groups. Body weight was monitored weekly. Overnight fasted mice were used for tissue samples collection. WAT was obtained from subcutaneous periinguinal (sWAT) or visceral epidydimal/perigonadal (VAT) regions. Experimental procedures were approved by the Laboratory Animal Care at Harvard Medical School and Brigham and Women’s Hospital.
Human subjects and T cell Isolation
Peripheral blood samples (20 mL) were obtained from 12 healthy male and female adult human subjects (age > 18) with BMI of <24 kg/m2 (BioChemed Services, Winchester, VA, USA) and from subjects with BMI > 35 kg/m2 (age > 18) who had planned bariatric surgery in accordance with the Institutional Review Board-approved protocols at Brigham and Women’s Hospital, Boston, MA, USA. In brief, peripheral blood mononuclear cells (PBMCs) were isolated by Ficoll density gradient centrifugation (GE Healthcare, USA) as previously described (Wara et al., 2011a). CD4+ T cells were isolated from PBMCs with a negative CD4+ T cell isolation kit (Miltenyi Biotec). CD4+CD25− cells were obtained by negative selection (flow through), and CD4+CD25+ cells were positively selected (eluted column-retained cells).
Cell Culture
Primary splenic CD4+CD25− and CD4+CD25+ T cells were isolated from WT and TKO mice by using a magnetic-based CD4+CD25+ regulatory T cell Isolation kit (Miltenyi Biotech). CD4+CD25− cells were stimulated in the presence of 1 μg/ml anti-CD3 (plate-bound CD3Ab, clone 2C11) in 24-well plates for 24hrs or in the presence of both anti-CD3 and and TGF-β1 (2 ng/mL) over the indicated time period. Cells were grown in RPMI 1640 medium (ATCC) supplemented with 10% fetal bovine serum, 0.02mM β–mercaptoethanol as previously described (Cao et al., 2009).
METHOD DETAILS
Flow Cytometry
Tissue samples were excised and cut in small pieces with a scalpel. Cut tissues were digested with collagenase type II and dispase (1mg/ml each in DMEM/F12) and incubated for 1 h at 37°C with shaking. Suspensions were thoroughly vortexed and subsequently centrifuged (500 g for 5 min). Cells were centrifuged and resuspended in PBS containing 1% BSA. All samples were washed, resuspended in PBS plus2% FBS, and stained for 20 min on ice with directly conjugated (either PE or FITC) monoclonal antibodies specific for CD4, CD25, Foxp3, F4/80, CD11b, Ly6C, CCR7, CCR6, TGF-β3, CD31, CD34, and CD45 as described by the manufacturer’s protocol (eBioscience). Specific to Foxp3 Ab, cells were permeabilized according to the manufacturer’s protocol (Miltenyi Biotech), To assess mitochondrial mass of iTregs, freshly isolated splenic Tregs, and CD4+CD25− Teffs were stained with MitoTracker green according to the manufacturer’s instructions (Fisher Scientific; M-7514). FACS analysis was performed on an LSR-II (Beckton-Deckinson, San Diego, CA) and analyzed with FlowJo software.
T cell Isolation from mouse peripheral blood mononuclear cells
Peripheral blood samples (~1mL) were obtained from C57BL/6 and db/db mice. In brief, peripheral blood mononuclear cells (PBMCs) were isolated by LSM-Lymphocyte separation Medium (MPbio, USA). CD4+ T cells were isolated from PBMCs with a negative CD4+ T cell isolation kit (Miltenyi Biotec). CD4+CD25− cells were obtained by negative selection (flow through), and CD4+CD25+ cells were positively selected (eluted column-retained cells).
RNA isolation and qRT-PCR
Tissues were excised and homogenized using TissueLyser II (QIAGEN) according to the manufacturer’s instructions. Cell suspensions were thoroughly vortexed, and a small fraction was directly dissolved in TRIzol reagent (Invitrogen) or RNeasy kit (QIAGEN). Subsequent RT-qPCR was performed using High-Capacity cDNA generated with a reverse transcriptase core kit (Applied Biosystems). For Syber Green based assays GoTaq qPCR Master Mix (Promega) was used. The expression of mRNA was examined by quantitative PCR analysis using with AriaMx Real-time PCRsystem (Agilent Technologies, USA). Expression of mRNAs levels was normalized by β actin. Primer sequences are described in (Table S2). Genotyping was performed by PCR using Taq DNA polymerase (Promega) according to manufacturer’s instructions. Genotyping primers used were: primer1: 5′ ACCAGCCAGCTATCAACTCG-3′; primer2: 5′-TTACATTGGTCCAGCCACC-3′; primer3: 5′- CTAGGCCACAGAATTGAAAGATCT-3′;.and primer4: 5′ GTAGGTGGAAATTCTAGCATCATCC-3′.
Glucose and Insulin Tolerance Tests
For glucose tolerance tests (GTTs), mice were fasted for 12 h, and then injected intraperitoneally with d-glucose (Sigma, 1.0 g per kg of body weight). Insulin tolerance tests (ITTs) were performed on mice after 6 h fasting. Recombinant human regular insulin (0.75 U per kg of body weight, Humulin R, Eli Lilly) was given to mice by intraperitoneal injection. Blood glucose levels were measured before injection and at 15, 30, 60, 90 and 120 min after the administration of glucose or insulin using Contour next EZ blood glucose monitoring system (Bayer).
Pyruvate tolerance tests
For Pyruvate tolerance tests (PTTs), mice were fasted ~16 hr and intraperitonealy injected with 2 g/kg BW sodium pyruvate (Sigma) in saline as described (Foretz et al., 2010; Sumara et al., 2012) Blood glucose levels were measured before injection and at 15, 30, 60, 90 and 120 min after the administration of pyruvate using Contour next EZ blood glucose monitoring system (Bayer).
Blood chemistry
Lipid profiles were measured as previously described (Sun et al., 2014). Briefly triglyceride levels were determined using Infinity™ Triglycerides Liquid Stable Reagent (Thermo Scientific). Total cholesterol was measured using the Infinity™ Cholesterol Reagent (Thermo Scientific) and HDL cholesterol was measured by colorimetric assay (BioAssay Systems, EnzyChromTM HDL). LDL cholesterol levels were calculated using the following formula: LDL = Total Cholesterol – HDL Cholesterol – Triglycerides divided by five. Standards for cholesterol, triglyceride, and HDL were purchased from Pointe Scientific, Inc. Plasma free fatty acid was measured using Free Fatty Acid quantification Kit (Abcam).
Histological and immunostaining analysis
For immunohistology, tissues were fixed with neutral buffered 10% formalin solution, embedded in paraffin, cut into sections, and then deparaffinized. Sections were incubated with anti-Mac-2 (CL8942AP, Cedarlane Labs) for 30 min at room temperature, and counterstained with hematoxylin. Adipocyte size was measured on 5 independent H&E-stained sections per animal. Oil Red O (ORO) staining was performed on OCT-embedded sections. Images were captured by a digital system, and the staining area was measured using computer-assisted image quantification (Image-Pro Plus software, Media Cybernetics).
Antibodies for western blot analysis
Primary antibodies used were anti-phospho-Akt (Ser473; #4060, Cell Signaling), anti-pan-Akt (#2920, Cell Signaling), anti-phospho-P44/42 MAP(ERK1/2) (#9101, Cell Signaling), anti- P44/42 MAPK (ERK1/2) (L34F12) (#4696, Cell Signaling), anti-phospho-mTOR (SER2448 (D9C2), #5536, Cell Signaling), anti-mTOR (# 2972, Cell Signaling), anti-oxidative phosphorylation (OXPHOS) complexes I to V (#ab110413, Abcam), anti-KLF10 (#ab73537, Abcam), and β-actin (#4970, Cell Signaling).
ELISA
The supernatants from CD3 activated cultured CD4+CD25−T Cells were collected and subjected to ELISA using Mouse Cytokine Discovery Assay (Eve Technologies). Plasma from WT and TKO mice after 12 weeks of HFD were obtained for insulin, C-peptide, resistin, and leptin concentrations (Eve Technologies).
Body composition, food intake, and metabolic monitoring
Body composition was examined with Echo MRI (Echo Medical Systems, Houston, Texas) using the 3-in-1 Echo MRI Composition Analyzer. Food intake was measured approximately every 10 min in metabolic chambers maintained at 22°C under a 12 hr light/dark cycle with constant access to food and water and maintained on high-fat diet. Metabolic measurements were performed using a Comprehensive Lab Animal Monitoring System (Columbus Instruments, Columbus, OH) (Tschöp et al., 2011). After 48 h of acclimation, rates of O2 consumption (VO2) and of CO2 production (VCO2) were recorded for 24 h at 22°C. Respiratory exchange ratio (RER) was calculated as the ratio of VCO2 to VO2. Energy expenditure (EE) was calculated from values of VO2 and VCO2 as EE = (3.82 3.82VO2 + 1.22VCO2) and was adjusted by ANCOVA for lean body mass as determined by NMR spectroscopy (EchoMRI). Physical activity was measured as beam breaks.
Adoptive Treg cell transfer and mobilization studies
To assess chemotaxis in vivo, adoptive transfer of CD4+CD25+ Treg cells was conducted as previously described (Sun et al., 2014). Briefly, splenic Treg cells were obtained from donor WT or TKO HFD-fed mice (mouse Treg isolation kit, Miltenyi Biotech) and labeled ex vivo with fluorescent PKH26 dye (Sun et al., 2014). Fluorescently labeled PKH26 CD4+CD25+ WT and TKO Tregs (1x10⁶) were suspended in 0.2 mL PBS and injected intravenously into C57BL/6 recipient mice. Two days after the injection, the PKH26-cells were quantified from VAT, SAT and liver by flow cytometry on an LSR-II (Beckton-Deckinson, San Diego, CA) and analyzed with Flowjo software. In separate studies, TKO and WT Tregs were isolated from WT and TKO HFD-fed mice (Treg isolation kit, Miltenyi Biotech) and adoptively transferred (1 × 10⁶ cells/mouse) intravenously once per week into the indicated recipient mouse groups: 1) WT mice + PBS; 2) TKO mice + PBS; 3) TKO mice + WT Tregs; and 4) TKO mice + TKO Tregs. Recipient mice were kept on a high-fat diet containing 60% kcal fat (Research Diets, D12492i) for 12 weeks at which time ITT and GTT were performed prior to tissue harvest.
Migration assays
Migration assay was performed using the ChemoTx transwell system (Neuro Probe, Inc, Cabin John, MD, USA) according to the manufacturer’s protocol. Briefly, 2x10⁴ TKO and WT Tregs from HFD-fed mice and suspended in serum-free media were placed in the upper compartment, while the lower compartment was filled with medium containing chemokines CCL19 or CCL20. After 6 h of incubation at 37°C, the total number of cells in the lower compartment were collected and cell migration was detected by counting the number of cells by FACS, which was performed on an LSR-II (Beckton-Deckinson, San Diego, CA). Each sample was assayed in triplicate.
Mitochondrial bioenergetics
Mitochondrial oxygen consumption rates (OCR) and extracellular acidification rates (ECAR) were determined using an XFe-96 Extracellular Flux Analyzer (Seahorse Biosciences). Cells (iTregs (in vitro differentiated and sorted as CD4+CD25+ Tregs), freshly isolated splenic Tregs, or CD4+CD25− Teffs) were plated at 2 x10⁵ per well in 96-well Seahorse plates coated with CellTak (BD pharmingen). Mitochondrial OCR was measured and plotted at basal conditions followed by sequential addition of 2 μg/mL oligomycin (ATP synthase inhibitor), 1 μmol/L FCCP (a mitochondrial uncoupler), and 0.5 μmol/L rotenone (complex I inhibitor) plus 0.5 μmol/L antimycin A (complex III inhibitor). Glycolytic capacity of T cells was determined by Seahorse XF Glycolysis Stress Test Kit (Agilent Technologies) according to the manufacturer’s instructions. For the measurement of ECAR, XF RPMI Seahorse medium supplemented sequentially with 10 mM glucose and 2 mM L-glutamine, oligomycin (2 μ M), and 2-DG (30 mM) (Sigma-Aldrich) to measure glycolysis, glycolytic capacity, and glycolytic reserve, respectively.
Glucose uptake assays
3T3-L1 fibroblasts were differentiated into 3T3-L1 adipocytes according to the manufacturer’s instructions (AAT Bioquest). In brief, induction of differentiation of 3T3-L1 pre-adipocytes into mature adipocytes was performed after 2-day incubation with DMEM supplemented with 10% FBS, 0.83μM insulin, 0.25μM dexamethasone, and 0.25mM isobutylmethylxanthine. The cells were subsequently maintained for 2 days with DMEM supplemented with 10% FBS and 0.83 μM insulin alone. The medium was changed to DMEM supplemented with 10% FBS for another 3-5 days. Differentiated cells (at least 95% of which showed an adipocyte phenotype by accumulation of lipid droplets) were used on day 8 to 12 after induction of differentiation. 3T3-L1 adipocytes were placed in growth medium at 5x10⁴ cells/well/100μL/96-well black wall/clear bottom cell culture Poly-D lysine plate. Cells were co-cultured with WT or TKO Treg cell supernatants for 8–10 h. Subsequently, cells were treated with or without insulin (1 μM) for 20 min to activate glucose transport and quantified using Screen QuestaFluorimetric Glucose Uptake Assay Kit (AAT Bioquest) (Lu et al., 2018).
In vitro glucose production assays
Production of glucose was assessed in mouse primary hepatocytes. Briefly, primary hepatocyte cells were cultured in 12-well collagen-coated plates (200,000 cells per well) for 12 h (Calabuig-Navarro et al., 2015; Matsumoto et al., 2007). After washing twice with pre-warmed PBS buffer, hepatocytes were incubated in 2 mL glucose-free glutamine-containing Dulbecco’s Modified Eagle’s DMEM without phenol red, supplemented with 1 mM pyruvate. After 12-hr incubation in the presence of 8-cpt-cAMP (cAMP analog, 500 μM) and dexamethasone (100 μM), cells were co-cultured with WT or TKO Treg cell supernatants for 12 h. Conditioned medium were harvested to determine glucose levels, using the colorimetric glucose assay as described by the manufacturer (Wako, Japan) Briefly, mutarotase-glucose oxidase was added to each well, and incubated at room temperature for 20 min before measuring absorbance at 505 nm. Glucose concentration was calculated from a standard curve generated with the manufacturer’s glucose standards.
RNA-seq analysis and GO
RNA-seq analysis was performed after ribodepletion and standard library construction using Illumina HiSeq2500 V4 2x100 PE (Genewiz, South Plainfield, NJ). Briefly, processing of FastQC was performed by Genewiz as following: Sequence reads were trimmed to remove possible adaptor sequences and nucleotides with poor quality (error rate < 0.05) at the end. After trimming, sequence reads shorter than 50 nucleotides were discarded. Remaining sequence reads were aligned to the reference genome for mouse (GRCm38.p5). Mean quality score of all samples was < 37 within a range of 30,000,000-40,000,000 reads per sample. All samples had at least >70% of mapped fragments over total.Total gene hit counts were measured and RPKM values were calculated. After mapping and total gene hit count calculations using CLC Genomics server (v9.0), the total gene hit counts table was used for downstream differential expression analysis using DESeq2. Genes with an adjusted p value < 0.05 and absolute log2FoldChange > 1 were called as differentially expressed genes for each comparison, after removing low abundant transcripts by gene hit counts base < 10. Hierarchical heatmap cluster analysis was generated with heatmap2 function in R package gplots. Dissimilarity value was calculated using distance matrix 1-correlation. For Volcano plots log2 fold change was plotted adjusted p value -log10. For gene set enrichment analysis (GSEA) and prediction of upstream regulators IPA software (QIAGEN) was used (Core Analysis tool).
In Vitro Suppression Assay
TKO or control Treg cells were sorted as CD4+CD25+ Treg cells and cultured with CD4+FoxP3- responder cells (isolated from spleens of FoxP3-GFP CD45.1+ mice and labeled with cell trace violet (ThermoFisher Scientific)) and CD19+ B cells (isolated by CD19+ positive selection (Miltenyi Biotec) along with anti-CD3 (2C11; 2ug/ml) for 4 days. Cultures were harvested and responder cells were analyzed by flow cytometry by gating on CD4+IA-CD45.1+ cells. Division index and proliferation index were assessed using FlowJo software.
QUANTIFICATION AND STATISTICAL ANALYSIS
Statistical analyses were determined by using unpaired two-tailed Student’s t test or ANOVA with Bonferroni correction for multiple comparisons. Normal distribution was assumed for all experimental groups. A value of p < 0.05 was considered statistically significant. Data are represented as mean ± SEM and the number per group is indicated in the figure legends.
Supplementary Material
KEY RESOURCES TABLE
| REAGENT or RESOURCE | SOURCE | IDENTIFIER |
|---|---|---|
| Antibodies | ||
| anti-phospho-Akt, Ser473 | Cell Signaling | #4060 |
| anti-pan-Akt | Cell Signaling | #2920 |
| anti-phospho- P44/42 MAP(ERK1/2) | Cell Signaling | #9101 |
| anti- P44/42 MAPK (ERK1/2) (L34F12) | Cell Signaling | #4696 |
| anti-phospho-mTOR (SER2448 (D9C2)) | Cell Signaling | #5536 |
| anti-mTOR | Cell Signaling | #2972 |
| β-actin | Cell Signaling | #4970 |
| anti-oxidative phosphorylation (OXPHOS) complexes I to V | Abcam | #ab110413 |
| anti-KLF10 | Abcam | #ab73537 |
| CD4, CD25, Foxp3, | eBioscience, USA | #17-0042-82 |
| # 25-0251-82 | ||
| #11-5773-82 | ||
| F4/80, CD11b, Ly6C, CD8a, CCR7, CCR6, CD31, CD45, and CD34 | Biolegend, USA | #123116 |
| #101210 | ||
| #108406 | ||
| #155008 | ||
| #120108 | ||
| #129804 | ||
| #102407 | ||
| #103121 | ||
| #128611 | ||
| anti-Mac-2 | Cedarlane, USA | # CL8942AP |
| CD3e (145-2C11) | Life Technologies | #16-0031-85 |
| MitoTracker green | Fisher Scientific | # M-7514 |
| CCL19, CCL20, anti-mouse CD197 (CCR7) and | Biolegend, USA | # 587804 |
| anti-mouse CD196 (CCR6) | # 582304 | |
| # 120108 | ||
| # 129804 | ||
| Fluorescent PKH26 dye | Sigma-Aldrich | #MINI26-1KT |
| Rabbit anti-Human TGF-beta-3 | Assaypro,USA | #32545-05141T |
| Biological Samples | ||
| Human peripheral blood samples | BioChemed Services, Winchester, VA, USA | https://www.biochemed.com/ |
| Human peripheral blood samples | Brigham and Women’s Hospital, Boston, MA | N/A |
| Chemicals, Peptides, and Recombinant Proteins | ||
| TRIzol reagent | Invitrogen | #15596018 |
| LSM-Lymphocyte separation Medium | MPbio, USA | # 0850494-CF |
| sodium pyruvate | Sigma | # S8636 |
| RNeasy kit | QIAGEN | # 74104 |
| Reverse transcriptase core kit | Applied Biosystems | #4368814 |
| GoTaq qPCR Master Mix | Promega | # A6001 |
| negative CD4+ T cell isolation kit | Miltenyi Biotec | #130-104-454 |
| negative CD8+ T cell isolation kit | Miltenyi Biotec | #130-104-075 |
| Infinity™ Triglycerides Liquid Stable Reagent | Thermo Scientific | TR22421 |
| Infinity™ Cholesterol Reagent | Thermo Scientific | TR13421 |
| Blood glucose strips | Contour next EZ, Bayer | # 7252 |
| CD19+ kit | Miltenyi Biotec | # 130-121-301 |
| Insulin, Humulin R | Eli Lilly | #U-100 |
| colorimetric glucose assay | Wako, Japan | #997-03001 |
| D-Glucose and Sodium Pyruvate | Sigma-Aldrich | # G7021 |
| #P4562 | ||
| Recombinant TGF-β1 | PeproTech | #100-21 |
| Dexamethasone | Fisher Scientific | # 501035208 |
| IBMX (3-isobutyl-1-methylxanthine) | Sigma-Aldrich | # I5879 |
| Poly-D lysine | Fisher Scientific | # A3890401 |
| HDL colorimetric assay (HDL) | BioAssay Systems | #E2HL-100 |
| Free Fatty Acid Kit | Abcam | # ab65341 |
| CD4+ CD25+ Regulatory T Cell Isolation Kit, mouse | Miltenyi Biotec | #130-091-041 |
| CD4+ CD25+ Regulatory T Cell Isolation Kit, Human | Miltenyi Biotec | 130-091-301 |
| ChemoTx transwell system | (Neuro Probe, USA) | # 101-5 |
| Seahorse XF Glycolysis Stress Test Kit | Agilent Technologies | # 103020-100 |
| Seahorse XF mito Stress Test Kit XF DMEM Medium | Agilent Technologies | # 103015-100 |
| #100840-000 | ||
| Mouse Cytokine Discovery Assay | Eve Technologies | https://www.evetechnologies.com |
| Glucose Uptake Assay Kit | AAT Bioquest | #36500 |
| Cell-Tak | Corning | #354240 |
| 8-cpt-cAMP | Santa Cruz Biotech | #sc-201569 |
| GLUCOSE AUTOKIT | Wako, japan | #997-03001 |
| cell trace violet | Thermo Fisher | # C34557 |
| High fat Diet | Research Diets | #D12492i |
| Free fatty Acid | Abcam | #ab65341 |
| Ficoll-Paque | GE Healthcare | #17-5442-02 |
| L-glutamine, Oligomycin, and 2-DG | Sigma | #G3126 |
| #75351 | ||
| #D6134 | ||
| ELISA, Mouse Cytokine Discovery Assay | EVE Technology,Canada | MD44 |
| Deposited Data | ||
| Gene Expression Omnibus | This Paper | accession number GSE139977 |
| Experimental Models: Cell Lines | ||
| 3T3-L1 | ATCC | CL-173 |
| mouse primary hepatocytes | Massachusetts General Hospital | Cell Resource Core |
| Experimental Models: Organisms/Strains | ||
| KLF10flox/flox mice | This Paper | N/A |
| CD4-Cre transgenic mice | Taconic Biosciences | #4196 |
| CD4-specific KLF10 knockout mice | This Paper | N/A |
| C57BL/6 mice | Charles River | #027 |
| db/db mice | Jackson Lab | #000642 |
| Instruments, Software and Algorithms | ||
| FlowJo software | https://www.flowjo.com/ | N/A |
| Image-Pro Plus software, | Media Cybernetics | N/A |
| Illumina HiSeq 2500 system | Genewiz, NJ | N/A |
| Prism GraphPad | https://www.graphpad.com/ | N/A |
| Adobe illustrator | https://www.adobe.com | N/A |
| IPA software and gene set enrichment analysis (GSEA) | QIAGEN Inc | N/A |
| GENE ONTOLOGY ANALYSIS (GO) | N/A | http://geneontology.org |
| LSR-II Flow cytometry | Beckton-Deckinson | Beckton-Deckinson |
| AriaMx Real-time PCRsystem | Agilent Technologies | https://www.agilent.com |
| Tissue Lyser II | QIAGEN | http://www.qiagen.com/cn/ |
| XFe-96 Extracellular Flux Analyzer | Seahorse Biosciences | https://www.agilent.com/ |
| Metabolic Monitoring System | Columbus Instruments,USA | N/A |
| Primers for 18, see Table S2 | This paper | N/A |
Highlights.
KLF10 expression is downregulated in mouse CD4+ T cells and human subjects with obesity
KLF10 deletion in mouse CD4+ T cells leads to multiple defects in CD4+ Treg function
Decreased TGF-β3 release from these Tregs alters glucose uptake and production
WT Treg delivery rescues obesity, insulin resistance, and fatty liver in these mice
ACKNOWLEDGMENTS
We acknowledge Amir Mina (Brigham and Women’s Hospital) and Ali Hashemi Gheinani (Boston Children’s Hospital) for technical support. This work was supported by NIH grants (HL115141, HL134849, HL148207, HL148355, and HL153356 to M.W.F.), the Arthur K. Watson Charitable Trust (to M.W.F.), the Dr. Ralph and Marian Falk Medical Research Trust, Bank of America, N.A. Trustee (to M.W.F.), American Heart Association grants 18SFRN33900144 and 20SFRN35200163 (to M.W.F.), and the Mayo Clinic Center for Biomedical Discovery (to J.R.H.).
Footnotes
DECLARATION OF INTERESTS
The authors declare no competing interests.
SUPPLEMENTAL INFORMATION
Supplemental Information can be found online at https://doi.org/10.1016/j.celrep.2020.108550.
REFERENCES
- Becker M, Levings MK, and Daniel C (2017). Adipose-tissue regulatory T cells: Critical players in adipose-immune crosstalk. Eur. J. Immunol 47, 1867–1874. [DOI] [PubMed] [Google Scholar]
- Beier UH, Angelin A, Akimova T, Wang L, Liu Y, Xiao H, Koike MA, Hancock SA, Bhatti TR, Han R, et al. (2015). Essential role of mitochondrial energy metabolism in Foxp3+ T-regulatory cell function and allograft survival. FASEB J. 29, 2315–2326. [DOI] [PMC free article] [PubMed] [Google Scholar]
- Bertola A, Bonnafous S, Anty R, Patouraux S, Saint-Paul MC, Iannelli A, Gugenheim J, Barr J, Mato JM, Le Marchand-Brustel Y, et al. (2010). Hepatic expression patterns of inflammatory and immune response genes associated with obesity and NASH in morbidly obese patients. PLoS One 5, e13577. [DOI] [PMC free article] [PubMed] [Google Scholar]
- Bluestone JA, Mackay CR, O’Shea JJ, and Stockinger B (2009). The functional plasticity of T cell subsets. Nat. Rev. Immunol 9, 811–816. [DOI] [PMC free article] [PubMed] [Google Scholar]
- Brestoff JR, and Artis D (2015). Immune regulation of metabolic homeostasis in health and disease. Cell 161, 146–160. [DOI] [PMC free article] [PubMed] [Google Scholar]
- Calabuig-Navarro V, Yamauchi J, Lee S, Zhang T, Liu YZ, Sadlek K, Coudriet GM, Piganelli JD, Jiang CL, Miller R, et al. (2015). Forkhead Box O6 (FoxO6) Depletion Attenuates Hepatic Gluconeogenesis and Protects against Fat-induced Glucose Disorder in Mice. J. Biol. Chem 290, 15581–15594. [DOI] [PMC free article] [PubMed] [Google Scholar]
- Cao Z, Wara AK, Icli B, Sun X, Packard RR, Esen F, Stapleton CJ, Subramaniam M, Kretschmer K, Apostolou I, et al. (2009). Kruppel-like factor KLF10 targets transforming growth factor-beta1 to regulate CD4(+) CD25(−) T cells and T regulatory cells. J. Biol. Chem 284, 24914–24924. [DOI] [PMC free article] [PubMed] [Google Scholar]
- Cao Z, Sun X, Icli B, Wara AK, and Feinberg MW (2010). Role of Kruppel-like factors in leukocyte development, function, and disease. Blood 116, 4404–4414. [DOI] [PMC free article] [PubMed] [Google Scholar]
- Chapman NM, Zeng H, Nguyen TM, Wang Y, Vogel P, Dhungana Y, Liu X, Neale G, Locasale JW, and Chi H (2018). mTOR coordinates transcriptional programs and mitochondrial metabolism of activated Treg subsets to protect tissue homeostasis. Nat. Commun 9, 2095. [DOI] [PMC free article] [PubMed] [Google Scholar]
- Chatzigeorgiou A, Karalis KP, Bornstein SR, and Chavakis T (2012). Lymphocytes in obesity-related adipose tissue inflammation. Diabetologia 55, 2583–2592. [DOI] [PubMed] [Google Scholar]
- Cipolletta D (2014). Adipose tissue-resident regulatory T cells: phenotypic specialization, functions and therapeutic potential. Immunology 142, 517–525. [DOI] [PMC free article] [PubMed] [Google Scholar]
- Cipolletta D, Feuerer M, Li A, Kamei N, Lee J, Shoelson SE, Benoist C, and Mathis D (2012). PPAR-γ is a major driver of the accumulation and phenotype of adipose tissue Treg cells. Nature 486, 549–553. [DOI] [PMC free article] [PubMed] [Google Scholar]
- NCD Risk Factor Collaboration (NCD-RisC). (2017). Worldwide trends in body-mass index, underweight, overweight, and obesity from 1975 to 2016: a pooled analysis of 2416 population-based measurement studies in 128·9 million children, adolescents, and adults. Lancet 390, 2627–2642. [DOI] [PMC free article] [PubMed] [Google Scholar]
- Cunningham JT, Rodgers JT, Arlow DH, Vazquez F, Mootha VK, and Puigserver P (2007). mTOR controls mitochondrial oxidative function through a YY1-PGC-1alpha transcriptional complex. Nature 450, 736–740. [DOI] [PubMed] [Google Scholar]
- Desdín-Micó G, Soto-Heredero G, and Mittelbrunn M (2018). Mitochondrial activity in T cells. Mitochondrion 41, 51–57. [DOI] [PubMed] [Google Scholar]
- DiMauro S, and Schon EA (2003). Mitochondrial respiratory-chain diseases. N. Engl. J. Med 348, 2656–2668. [DOI] [PubMed] [Google Scholar]
- Eller K, Kirsch A, Wolf AM, Sopper S, Tagwerker A, Stanzl U, Wolf D, Patsch W, Rosenkranz AR, and Eller P (2011). Potential role of regulatory T cells in reversing obesity-linked insulin resistance and diabetic nephropathy. Diabetes 60, 2954–2962. [DOI] [PMC free article] [PubMed] [Google Scholar]
- Fabbrini E, Cella M, McCartney SA, Fuchs A, Abumrad NA, Pietka TA, Chen Z, Finck BN, Han DH, Magkos F, et al. (2013). Association between specific adipose tissue CD4+ T-cell populations and insulin resistance in obese individuals. Gastroenterology 145, 366–374.e361-363. [DOI] [PMC free article] [PubMed] [Google Scholar]
- Fan MY, and Turka LA (2018). Immunometabolism and PI(3)K Signaling As a Link between IL-2, Foxp3 Expression, and Suppressor Function in Regulatory T Cells. Front. Immunol 9, 69. [DOI] [PMC free article] [PubMed] [Google Scholar]
- Feuerer M, Herrero L, Cipolletta D, Naaz A, Wong J, Nayer A, Lee J, Goldfine AB, Benoist C, Shoelson S, and Mathis D (2009). Lean, but not obese, fat is enriched for a unique population of regulatory T cells that affect metabolic parameters. Nat. Med 15, 930–939. [DOI] [PMC free article] [PubMed] [Google Scholar]
- Foretz M, Hébrard S, Leclerc J, Zarrinpashneh E, Soty M, Mithieux G, Sakamoto K, Andreelli F, and Viollet B (2010). Metformin inhibits hepatic gluconeogenesis in mice independently of the LKB1/AMPK pathway via a decrease in hepatic energy state. J. Clin. Invest 120, 2355–2369. [DOI] [PMC free article] [PubMed] [Google Scholar]
- Gerriets VA, Kishton RJ, Nichols AG, Macintyre AN, Inoue M, Ilkayeva O, Winter PS, Liu X, Priyadharshini B, Slawinska ME, et al. (2015). Metabolic programming and PDHK1 control CD4+ T cell subsets and inflammation. J. Clin. Invest 125, 194–207. [DOI] [PMC free article] [PubMed] [Google Scholar]
- Gerriets VA, Kishton RJ, Johnson MO, Cohen S, Siska PJ, Nichols AG, Warmoes MO, de Cubas AA, MacIver NJ, Locasale JW, et al. (2016). Foxp3 and Toll-like receptor signaling balance Treg cell anabolic metabolism for suppression. Nat. Immunol 17, 1459–1466. [DOI] [PMC free article] [PubMed] [Google Scholar]
- Han JM, Patterson SJ, Speck M, Ehses JA, and Levings MK (2014). Insulin inhibits IL-10-mediated regulatory T cell function: implications for obesity. J. Immunol 192, 623–629. [DOI] [PubMed] [Google Scholar]
- Hotamisligil GS (2006). Inflammation and metabolic disorders. Nature 444, 860–867. [DOI] [PubMed] [Google Scholar]
- Hotamisligil GS (2017). Inflammation, metaflammation and immunometabolic disorders. Nature 542, 177–185. [DOI] [PubMed] [Google Scholar]
- Hsu CF, Sui CL, Wu WC, Wang JJ, Yang DH, Chen YC, Yu WC, and Chang HS (2011). Klf10 induces cell apoptosis through modulation of BI-1 expression and Ca2+ homeostasis in estrogen-responding adenocarcinoma cells. Int. J. Biochem. Cell Biol 43, 666–673. [DOI] [PubMed] [Google Scholar]
- Huh JY, Park YJ, Ham M, and Kim JB (2014). Crosstalk between adipocytes and immune cells in adipose tissue inflammation and metabolic dysregulation in obesity. Mol. Cells 37, 365–371. [DOI] [PMC free article] [PubMed] [Google Scholar]
- Ilan Y, Maron R, Tukpah AM, Maioli TU, Murugaiyan G, Yang K, Wu HY, and Weiner HL (2010). Induction of regulatory T cells decreases adipose inflammation and alleviates insulin resistance in ob/ob mice. Proc. Natl. Acad. Sci. USA 107, 9765–9770. [DOI] [PMC free article] [PubMed] [Google Scholar]
- Inzaugarat ME, Ferreyra Solari NE, Billordo LA, Abecasis R, Gadano AC, and Cherñavsky AC (2011). Altered phenotype and functionality of circulating immune cells characterize adult patients with nonalcoholic steatohepatitis. J. Clin. Immunol 31, 1120–1130. [DOI] [PubMed] [Google Scholar]
- Johnsen SA, Subramaniam M, Janknecht R, and Spelsberg TC (2002). TGFbeta inducible early gene enhances TGFbeta/Smad-dependent transcriptional responses. Oncogene 21, 5783–5790. [DOI] [PubMed] [Google Scholar]
- Khedkar SA, Sun X, Rigby AC, and Feinberg MW (2015). Discovery of small molecule inhibitors to Krüppel-like factor 10 (KLF10): implications for modulation of T regulatory cell differentiation. J. Med. Chem 58, 1466–1478. [DOI] [PMC free article] [PubMed] [Google Scholar]
- Kishore M, Cheung KCP, Fu H, Bonacina F, Wang G, Coe D, Ward EJ, Colamatteo A, Jangani M, Baragetti A, et al. (2017). Regulatory T Cell Migration Is Dependent on Glucokinase-Mediated Glycolysis. Immunity 47, 875–889.e810. [DOI] [PMC free article] [PubMed] [Google Scholar]
- Kochumon S, Al-Rashed F, Abu-Farha M, Devarajan S, Tuomilehto J, and Ahmad R (2018). Adipose tissue expression of CCL19 chemokine is positively associated with insulin resistance. Diabetes Metab. Res. Rev 35, 3087. [DOI] [PMC free article] [PubMed] [Google Scholar]
- Kolodin D, van Panhuys N, Li C, Magnuson AM, Cipolletta D, Miller CM, Wagers A, Germain RN, Benoist C, and Mathis D (2015). Antigen- and cytokine-driven accumulation of regulatory T cells in visceral adipose tissue of lean mice. Cell Metab. 21, 543–557. [DOI] [PMC free article] [PubMed] [Google Scholar]
- Kremer M, Thomas E, Milton RJ, Perry AW, van Rooijen N, Wheeler MD, Zacks S, Fried M, Rippe RA, and Hines IN (2010). Kupffer cell and interleukin-12-dependent loss of natural killer T cells in hepatosteatosis. Hepatology 51, 130–141. [DOI] [PMC free article] [PubMed] [Google Scholar]
- Ledderose C, Liu K, Kondo Y, Slubowski CJ, Dertnig T, Denicoló S, Arbab M, Hubner J, Konrad K, Fakhari M, et al. (2018). Purinergic P2X4 receptors and mitochondrial ATP production regulate T cell migration. J. Clin. Invest 128, 3583–3594. [DOI] [PMC free article] [PubMed] [Google Scholar]
- Lee YS, Wollam J, and Olefsky JM (2018). An Integrated View of Immunometabolism. Cell 172, 22–40. [DOI] [PMC free article] [PubMed] [Google Scholar]
- Lin CH, Lin SY, Chang HW, Ko LJ, Tseng YS, Chang VH, and Yu WC (2015). CDK2 phosphorylation regulates the protein stability of KLF10 by interfering with binding of the E3 ligase SIAH1. Biochim. Biophys. Acta 1853, 1174–1181. [DOI] [PubMed] [Google Scholar]
- Liston A, and Gray DH (2014). Homeostatic control of regulatory T cell diversity. Nat. Rev. Immunol 14, 154–165. [DOI] [PubMed] [Google Scholar]
- Lu J, Montgomery BK, Chatain GP, Bugarini A, Zhang Q, Wang X, Edwards NA, Ray-Chaudhury A, Merrill MJ, Lonser RR, and Chittiboina P (2018). Corticotropin releasing hormone can selectively stimulate glucose uptake in corticotropinoma via glucose transporter 1. Mol. Cell. Endocrinol 470, 105–114. [DOI] [PMC free article] [PubMed] [Google Scholar]
- Matsumoto M, Pocai A, Rossetti L, Depinho RA, and Accili D (2007). Impaired regulation of hepatic glucose production in mice lacking the forkhead transcription factor Foxo1 in liver. Cell Metab. 6, 208–216. [DOI] [PubMed] [Google Scholar]
- Newton R, Priyadharshini B, and Turka LA (2016). Immunometabolism of regulatory T cells. Nat. Immunol 17, 618–625. [DOI] [PMC free article] [PubMed] [Google Scholar]
- Olefsky JM, and Glass CK (2010). Macrophages, inflammation, and insulin resistance. Annu. Rev. Physiol 72, 219–246. [DOI] [PubMed] [Google Scholar]
- Osborn O, and Olefsky JM (2012). The cellular and signaling networks linking the immune system and metabolism in disease. Nat. Med 18, 363–374. [DOI] [PubMed] [Google Scholar]
- Pacifico L, Di Renzo L, Anania C, Osborn JF, Ippoliti F, Schiavo E, and Chiesa C (2006). Increased T-helper interferon-gamma-secreting cells in obese children. Eur. J. Endocrinol 154, 691–697. [DOI] [PubMed] [Google Scholar]
- Panduro M, Benoist C, and Mathis D (2016). Tissue Tregs. Annu. Rev. Immunol 34, 609–633. [DOI] [PMC free article] [PubMed] [Google Scholar]
- Pecht T, Gutman-Tirosh A, Bashan N, and Rudich A (2014). Peripheral blood leucocyte subclasses as potential biomarkers of adipose tissue inflammation and obesity subphenotypes in humans. Obes. Rev 15, 322–337. [DOI] [PubMed] [Google Scholar]
- Petrus P, Mejhert N, Corrales P, Lecoutre S, Li Q, Maldonado E, Kulyte A, Lopez Y, Campbell M, Acosta JR, et al. (2018). Transforming Growth Factor-beta3 Regulates Adipocyte Number in Subcutaneous White Adipose Tissue. Cell Rep. 25, 551–560.e555. [DOI] [PubMed] [Google Scholar]
- Pettersson US, Waldén TB, Carlsson PO, Jansson L, and Phillipson M (2012). Female mice are protected against high-fat diet induced metabolic syndrome and increase the regulatory T cell population in adipose tissue. PLoS One 7, e46057. [DOI] [PMC free article] [PubMed] [Google Scholar]
- Pucino V, De Rosa V, Procaccini C, and Matarese G (2014). Regulatory T Cells, Leptin and Angiogenesis In Angiogenesis, Lymphangiogenesis and Clinical Implications, Marone G and Granata F, eds. (Karger; ), pp. 155–169. [DOI] [PubMed] [Google Scholar]
- Rau M, Schilling AK, Meertens J, Hering I, Weiss J, Jurowich C, Kudlich T, Hermanns HM, Bantel H, Beyersdorf N, and Geier A (2016). Progression from Nonalcoholic Fatty Liver to Nonalcoholic Steatohepatitis Is Marked by a Higher Frequency of Th17 Cells in the Liver and an Increased Th17/Resting Regulatory T Cell Ratio in Peripheral Blood and in the Liver. J. Immunol 196, 97–105. [DOI] [PubMed] [Google Scholar]
- Reaven GM (1988). Banting lecture 1988. Role of insulin resistance in human disease. Diabetes 37, 1595–1607. [DOI] [PubMed] [Google Scholar]
- Sakaguchi M, Sonegawa H, Nukui T, Sakaguchi Y, Miyazaki M, Namba M, and Huh NH (2005). Bifurcated converging pathways for high Ca2+- and TGFbeta-induced inhibition of growth of normal human keratinocytes. Proc. Natl. Acad. Sci. USA 102, 13921–13926. [DOI] [PMC free article] [PubMed] [Google Scholar]
- Sano T, Iwashita M, Nagayasu S, Yamashita A, Shinjo T, Hashikata A, Asano T, Kushiyama A, Ishimaru N, Takahama Y, and Nishimura F (2015). Protection from diet-induced obesity and insulin resistance in mice lacking CCL19-CCR7 signaling Obesity (Silver Spring; ) 23, 1460–1471. [DOI] [PubMed] [Google Scholar]
- Sell H, Habich C, and Eckel J (2012). Adaptive immunity in obesity and insulin resistance. Nat. Rev. Endocrinol 8, 709–716. [DOI] [PubMed] [Google Scholar]
- Sharma N, Benechet AP, Lefrançois L, and Khanna KM (2015). CD8 T Cells Enter the Splenic T Cell Zones Independently of CCR7, but the Subsequent Expansion and Trafficking Patterns of Effector T Cells after Infection Are Dysregulated in the Absence of CCR7 Migratory Cues. J. Immunol 195, 5227–5236. [DOI] [PMC free article] [PubMed] [Google Scholar]
- Strissel KJ, DeFuria J, Shaul ME, Bennett G, Greenberg AS, and Obin MS (2010). T-cell recruitment and Th1 polarization in adipose tissue during diet-induced obesity in C57BL/6 mice Obesity (Silver Spring; ) 18, 1918–1925. [DOI] [PMC free article] [PubMed] [Google Scholar]
- Subramaniam M, Harris SA, Oursler MJ, Rasmussen K, Riggs BL, and Spelsberg TC (1995). Identification of a novel TGF-beta-regulated gene encoding a putative zinc finger protein in human osteoblasts. Nucleic Acids Res. 23, 4907–4912. [DOI] [PMC free article] [PubMed] [Google Scholar]
- Sumara G, Sumara O, Kim JK, and Karsenty G (2012). Gut-derived serotonin is a multifunctional determinant to fasting adaptation. Cell Metab. 16, 588–600. [DOI] [PMC free article] [PubMed] [Google Scholar]
- Sun X, He S, Wara AKM, Icli B, Shvartz E, Tesmenitsky Y, Belkin N, Li D, Blackwell TS, Sukhova GK, et al. (2014). Systemic delivery of microRNA-181b inhibits nuclear factor-κB activation, vascular inflammation, and atherosclerosis in apolipoprotein E-deficient mice. Circ. Res 114, 32–40. [DOI] [PMC free article] [PubMed] [Google Scholar]
- Sutti S, Jindal A, Bruzzì S, Locatelli I, Bozzola C, and Albano E (2015). Is there a role for adaptive immunity in nonalcoholic steatohepatitis? World J. Hepatol 7, 1725–1729. [DOI] [PMC free article] [PubMed] [Google Scholar]
- Tang Q, and Vincenti F (2017). Transplant trials with Tregs: perils and promises. J. Clin. Invest 127, 2505–2512. [DOI] [PMC free article] [PubMed] [Google Scholar]
- Tian J, Dang HN, Yong J, Chui WS, Dizon MP, Yaw CK, and Kaufman DL (2011). Oral treatment with γ-aminobutyric acid improves glucose tolerance and insulin sensitivity by inhibiting inflammation in high fat diet-fed mice. PLoS One 6, e25338. [DOI] [PMC free article] [PubMed] [Google Scholar]
- Tschöp MH, Speakman JR, Arch JR, Auwerx J, Brüning JC, Chan L, Eckel RH, Farese RV Jr., Galgani JE, Hambly C, et al. (2011). A guide to analysis of mouse energy metabolism. Nat. Methods 9, 57–63. [DOI] [PMC free article] [PubMed] [Google Scholar]
- Venuprasad K, Huang H, Harada Y, Elly C, Subramaniam M, Spelsberg T, Su J, and Liu YC (2008). The E3 ubiquitin ligase Itch regulates expression of transcription factor Foxp3 and airway inflammation by enhancing the function of transcription factor TIEG1. Nat. Immunol 9, 245–253. [DOI] [PMC free article] [PubMed] [Google Scholar]
- Vonghia L, Ruyssers N, Schrijvers D, Pelckmans P, Michielsen P, De Clerck L, Ramon A, Jirillo E, Ebo D, De Winter B, et al. (2015). CD4+ROR γ t++ and Tregs in a Mouse Model of Diet-Induced Nonalcoholic Steatohepatitis. Mediators Inflamm. 2015, 239623. [DOI] [PMC free article] [PubMed] [Google Scholar]
- Wagner NM, Brandhorst G, Czepluch F, Lankeit M, Eberle C, Herzberg S, Faustin V, Riggert J, Oellerich M, Hasenfuss G, et al. (2013). Circulating regulatory T cells are reduced in obesity and may identify subjects at increased metabolic and cardiovascular risk Obesity (Silver Spring; ) 21, 461–468. [DOI] [PubMed] [Google Scholar]
- Wara AK, Croce K, Foo S, Sun X, Icli B, Tesmenitsky Y, Esen F, Rosenzweig A, and Feinberg MW (2011a). Bone marrow-derived CMPs and GMPs represent highly functional proangiogenic cells: implications for ischemic cardiovascular disease. Blood 118, 6461–6464. [DOI] [PMC free article] [PubMed] [Google Scholar]
- Wara AK, Foo S, Croce K, Sun X, Icli B, Tesmenitsky Y, Esen F, Lee JS, Subramaniam M, Spelsberg TC, et al. (2011b). TGF-β1 signaling and Krüppel-like factor 10 regulate bone marrow-derived proangiogenic cell differentiation, function, and neovascularization. Blood 118, 6450–6460. [DOI] [PMC free article] [PubMed] [Google Scholar]
- Weisberg SP, McCann D, Desai M, Rosenbaum M, Leibel RL, and Ferrante AW Jr. (2003). Obesity is associated with macrophage accumulation in adipose tissue. J. Clin. Invest 112, 1796–1808. [DOI] [PMC free article] [PubMed] [Google Scholar]
- Wellen KE, and Hotamisligil GS (2005). Inflammation, stress, and diabetes. J. Clin. Invest 115, 1111–1119. [DOI] [PMC free article] [PubMed] [Google Scholar]
- Weng CC, Hawse JR, Subramaniam M, Chang VHS, Yu WCY, Hung WC, Chen LT, and Cheng KH (2017). KLF10 loss in the pancreas provokes activation of SDF-1 and induces distant metastases of pancreatic ductal adenocarcinoma in the KrasG12D p53flox/flox model. Oncogene 36, 5532–5543. [DOI] [PubMed] [Google Scholar]
- Wentworth JM, Naselli G, Brown WA, Doyle L, Phipson B, Smyth GK, Wabitsch M, O’Brien PE, and Harrison LC (2010). Pro-inflammatory CD11c+CD206+ adipose tissue macrophages are associated with insulin resistance in human obesity. Diabetes 59, 1648–1656. [DOI] [PMC free article] [PubMed] [Google Scholar]
- WHO (2018). Obesity and overweight. WHO, April 1, 2020. https://www.who.int/news-room/fact-sheets/detail/obesity-and-overweight. [Google Scholar]
- Winer S, Chan Y, Paltser G, Truong D, Tsui H, Bahrami J, Dorfman R, Wang Y, Zielenski J, Mastronardi F, et al. (2009). Normalization of obesity-associated insulin resistance through immunotherapy. Nat. Med 15, 921–929. [DOI] [PMC free article] [PubMed] [Google Scholar]
- Womack J, Tien PC, Feldman J, Shin JH, Fennie K, Anastos K, Cohen MH, Bacon MC, and Minkoff H (2007). Obesity and immune cell counts in women. Metabolism 56, 998–1004. [DOI] [PMC free article] [PubMed] [Google Scholar]
- Xiong Y, Khanna S, Grzenda AL, Sarmento OF, Svingen PA, Lomberk GA, Urrutia RA, and Faubion WA Jr. (2012). Polycomb antagonizes p300/CREB-binding protein-associated factor to silence FOXP3 in a Kruppel-like factor-dependent manner. J. Biol. Chem 287, 34372–34385. [DOI] [PMC free article] [PubMed] [Google Scholar]
- Xu L, Huang Q, Wang H, Hao Y, Bai Q, Hu J, Li Y, Wang P, Chen X, He R, et al. (2017). The Kinase mTORC1 Promotes the Generation and Suppressive Function of Follicular Regulatory T Cells. Immunity 47, 538–551.e535. [DOI] [PubMed] [Google Scholar]
- Yamauchi T, and Kadowaki T (2013). Adiponectin receptor as a key player in healthy longevity and obesity-related diseases. Cell Metab. 17, 185–196. [DOI] [PubMed] [Google Scholar]
- Yang N, Chen J, Zhang H, Wang X, Yao H, Peng Y, and Zhang W (2017). LncRNA OIP5-AS1 loss-induced microRNA-410 accumulation regulates cell proliferation and apoptosis by targeting KLF10 via activating PTEN/PI3K/AKT pathway in multiple myeloma. Cell Death Dis. 8, e2975. [DOI] [PMC free article] [PubMed] [Google Scholar]
- Zeng H, Yang K, Cloer C, Neale G, Vogel P, and Chi H (2013). mTORC1 couples immune signals and metabolic programming to establish T(reg)-cell function. Nature 499, 485–490. [DOI] [PMC free article] [PubMed] [Google Scholar]
- Zhang C, Li L, Feng K, Fan D, Xue W, and Lu J (2017). ‘Repair’ Treg Cells in Tissue Injury. Cell. Physiol. Biochem 43, 2155–2169. [DOI] [PubMed] [Google Scholar]
Associated Data
This section collects any data citations, data availability statements, or supplementary materials included in this article.
Supplementary Materials
Data Availability Statement
The mouse gene expression data are deposited in the National Center for Biotechnology Gene Expression Omnibus (https://www.ncbi.nlm.nih.gov/geo/), accession number GSE139977.