

Abstract
Assignment of CYP2D6 phenotype from genotype data can be challenging and despite efforts to standardize translation, there is currently no universally accepted method. To facilitate standardization, there remains a need to precisely quantify the in vivo function of different CYP2D6 genotypes. Vortioxetine is metabolized to its major metabolite, Lu AA34443, primarily via CYP2D6. The aim of this study was to quantify the in vivo CYP2D6 activity of different CYP2D6 alleles and genotypes through population pharmacokinetic (PopPK) modeling of vortioxetine and Lu AA34443. Plasma concentration data of vortioxetine and Lu AA34443 from 1,140 subjects originating from 29 clinical pharmacology studies were pooled for the analysis. A joint PopPK model described the pharmacokinetics of vortioxetine and Lu AA34443 simultaneously and provided estimates of the CYP2D6‐mediated metabolism for each subject. Subjects normally classified as CYP2D6 intermediate metabolizers (IMs) showed different levels of CYP2D6 activity with carriers of one fully functional allele and one null function allele having 77% higher CYP2D6 activity compared with carriers of two decreased function alleles (P < 0.0001). The decreased function alleles were associated with different levels of reduction of CYP2D6 activity. Fixing the activity of fully functional alleles to 1.0, the relative activities of CYP2D6*9, CYP2D6*10, CYP2D6*17, and CYP2D6*41 were 0.22, 0.37, 0.17, and 0.21, respectively. The activity of CYP2D6*10 was shown to be significantly greater than that of CYP2D6*17 (P = 0.01) and CYP2D6*41 (P = 0.02). These results warrant further discussion of current CYP2D6 genotype‐phenotype classification systems particularly regarding decreased function alleles and the IM phenotype.
Study Highlights.
WHAT IS THE CURRENT KNOWLEDGE ON THE TOPIC?
☑ There is a lack of consensus on how to translate CYP2D6 genotypes into phenotypes and consequently CYP2D6‐based treatment recommendations suffer from inconsistency.
WHAT QUESTION DID THIS STUDY ADDRESS?
☑ Based on vortioxetine data, this study aimed to quantify the in vivo CYP2D6 activity of different CYP2D6 genotypes and alleles providing basis for discussing the current methods for CYP2D6 genotype‐phenotype prediction.
WHAT DOES THIS STUDY ADD TO OUR KNOWLEDGE?
☑ Carriers of one fully functional allele and one null function allele had 77% higher CYP2D6 activity compared with carriers of two decreased function alleles despite both normally being assigned an activity score of 1. The CYP2D6*10 allele showed significantly higher CYP2D6 activity compared with CYP2D6*17 and CYP2D6*41.
HOW MIGHT THIS CHANGE CLINICAL PHARMACOLOGY OR TRANSLATIONAL SCIENCE?
☑ Based on the findings from this study, the current CYP2D6 genotype‐phenotype classification systems do not adequately reflect the in vivo CYP2D6 activity observed in practice. Further discussion on how to optimize translation of CYP2D6 genotypes to phenotypes is warranted, particularly with regard to decreased function alleles and the intermediate metabolizer phenotype.
Cytochrome P450 2D6 (CYP2D6) is involved in the metabolism of ~ 20% of all clinically used drugs. 1 The CYP2D6 gene is highly polymorphic and genetic variations may give rise to reduced, normal or increased activity of the CYP2D6 enzyme. Consequently, there are large interindividual differences in enzymatic activity, which, in turn, may cause differences in exposure and treatment response of drugs metabolized by CYP2D6. 2
Prediction of an individual’s CYP2D6 phenotype based on their CYP2D6 genotype can be a useful tool to guide pharmacotherapy involving CYP2D6 substrates, and numerous guidelines provide CYP2D6‐based treatment recommendations. 3 , 4 , 5 , 6 , 7 , 8 Several methods for translating CYP2D6 genotypes into phenotypes have been proposed but there is currently no standardized method used across laboratories.
Most commonly, CYP2D6 genotypes are classified into four phenotypes: poor metabolizers (PMs), intermediate metabolizers (IMs), normal metabolizers (NMs), and ultrarapid metabolizers (UMs). However, there is a lack of consensus on how to translate CYP2D6 genotypes into these four categories, and assignment of certain genotypes depend on the laboratory interpreting the test results. 9 A further limitation of this classification system is the substantial variability in CYP2D6 activity observed within the four categories and particularly the IMs have been shown to consist of several distinct subgroups. 10
As an alternative classification system, the CYP2D6 activity score has been introduced. 11 This system assigns a value to each CYP2D6 allele and uses their sum as a measure of the CYP2D6 activity associated with a given genotype. The activity score better captures the continuum of CYP2D6 activity observed in practice, but experts are divided on how to assign phenotypes, and thus dosage recommendations, based on the activity score. 9
Recently, an international group of CYP2D6 experts were engaged in an effort to standardize the method for translating CYP2D6 genotypes into phenotypes. 12 The group reached consensus on how to assign CYP2D6 genotypes and activity scores to the four traditional phenotype groups and recommended to downgrade the activity level of CYP2D6*10 to 0.25 to reflect a lower activity of this allele.
The evidence supporting functional assignment of CYP2D6 alleles is based on in vitro and clinical studies of different CYP2D6 substrates. However, only a limited number of CYP2D6 allele variants have been studied in large clinical datasets, and a comparison of their activity in vivo is lacking. Furthermore, the majority of clinical CYP2D6 genotype‐phenotype investigations are based on urinary metabolic ratios or sparse pharmacokinetic (PK) sampling, both of which may be subject to inaccuracy. Thus, there remains a need to precisely quantify and compare the in vivo CYP2D6 activity associated with different allele variants and genotypes.
Vortioxetine is a multimodal antidepressant approved for the treatment of major depressive disorder. Vortioxetine is metabolized by several CYP450 enzymes, including CYP2D6, CYP3A4/5, CYP2A6, CYP2C9, and CYP2C19, 13 see Figure 1 . Clinical drug‐drug interaction studies have shown minimal or no inhibitory or inducing effect of vortioxetine on various CYP isoforms. 14
Figure 1.
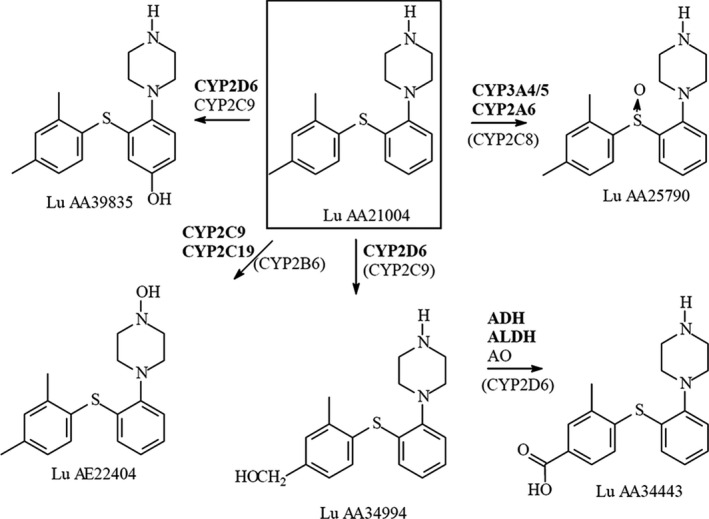
Biotransformation of vortioxetine.
The major metabolite of vortioxetine is a pharmacologically inactive benzoic acid, Lu AA34443. 15 In vitro studies have shown that the formation of Lu AA34443 from vortioxetine to a large extent (~ 80%) is mediated through CYP2D6, thereby making vortioxetine a good compound to study CYP2D6 phenotypes.
The clinical PK of vortioxetine and Lu AA34443 has been extensively studied and results are reported in the literature. 16 , 17 Vortioxetine exhibits dose‐proportional PK, has a long elimination half‐life of ~ 66 hours and a steady‐state volume of distribution of ~ 2,600 L. 17 After oral administration, a mean metabolic ratio of Lu AA34443:vortioxetine of 1.0 has been observed. 16 The median observed time to reach maximum plasma concentration (Tmax) for Lu AA34443 is shorter than the median Tmax of vortioxetine, indicating presence of presystemic metabolism. 16 Two population pharmacokinetic (PopPK) analyses of vortioxetine have previously been published, 17 , 18 but neither of these included data on Lu AA34443.
In the clinical pharmacology studies investigating the PK of vortioxetine and Lu AA34443, subjects were genotyped for CYP2D6. In contrast to most published PK‐based genotype‐phenotype assessments where sparse PK sampling has been applied, these studies collected dense PK samples of vortioxetine and Lu AA34443. This offers the opportunity to more precisely quantify the in vivo CYP2D6 activity measured by the extent of formation of Lu AA34443 from vortioxetine and evaluate the effect of CYP2D6 genotypes hereon. Thus, the aim of the present study was to characterize the in vivo metabolic activity of different CYP2D6 variant alleles and genotypes through PopPK modeling of vortioxetine and Lu AA34443.
METHODS
Study design
The data used in the PopPK analysis originated from 29 clinical pharmacology studies performed in the United States, Europe, China, and Japan (Table S1 ). All studies were approved by the appropriate local ethics committees and all subjects provided informed consent. The PopPK analysis dataset included a total of 1,140 healthy subjects. From the drug‐drug interaction studies, data involving co‐administration of other drugs were excluded. The subject characteristics are presented in Table 1 .
Table 1.
Characteristics of the 1,140 subjects included in the PopPK analysis
| Characteristic | N | Median | IQR | Range |
|---|---|---|---|---|
| Age, years | 1,140 | 29 | 23–40 | 7–78 |
| Weight, kg | 1,140 | 72 | 62–81 | 23–147 |
| Height, cm | 1,140 | 171 | 164–178 | 125–204 |
| BMI, kg/m2 | 1,140 | 24 | 22–27 | 14–49 |
| LBM, kg | 1,140 | 55 | 47–62 | 20–85 |
| Creatinine clearance, mL/min a | 1,137 | 118 | 100–136 | 6–412 |
| Albumin, g/L | 1,136 | 46 | 44–48 | 25–55 |
| ALAT, IU/L | 1,131 | 20 | 14–27 | 5–301 |
| ASAT, IU/L | 1,131 | 21 | 17–25 | 8–200 |
| Bilirubin, µmol/L | 1,119 | 11 | 9–14 | 2–52 |
| Characteristic | Frequency | Description |
|---|---|---|
| CYP2D6 phenotype b | 27/688/355/42/28 | UM/NM/IM/PM/missing |
| CYP2C19 phenotype | 685/360/60/35 | NM/IM/PM/missing |
| CYP2C9 phenotype | 916/21/0/203 | NM/IM/PM/missing |
| Sex | 760/380 | Males/females |
| Race | 768/131/238/3 | Caucasian/Asian/Black or African American/Other |
ALAT, alanine aminotransferase; ASAT, aspartate aminotransferase; BMI, body‐mass index; IM, intermediate metabolizer; IQR, interquartile range; LBM, lean body mass; NM, normal metabolizer; PM, poor metabolizer; PopPK, population pharmacokinetic; UM, ultrarapid metabolizer.
Creatinine clearance estimated by the Cockcroft‐Gault formula.
CYP2D6 genotype characteristics are provided in Table S2 .
Multiple plasma samples were collected in all studies following single oral doses of 2.5–75 mg and multiple oral doses of 2.5–60 mg/day. The plasma samples were analyzed for concentrations of vortioxetine and Lu AA34443 using a validated method (liquid‐chromatography tandem mass spectrometry) according to relevant US Food and Drug Administration (FDA) guidelines. 19 The details of the analytical method have previously been published. 20
Genotyping
CYP2D6 genotype data was available for 1,112 of the 1,140 subjects included in the PopPK analysis. CYP2D6 genotyping was performed by external contractors and the assays varied across the studies. The CYP2D6 genotyping panels are summarized in Table S1 . The majority of the subjects (N = 981) were genotyped using assays allowing detection of at least eight common variant alleles and gene duplication. CYP2D6*1 (wild‐type) was assigned to alleles when no variants were detected.
Population pharmacokinetic analysis
The plasma concentration data for vortioxetine and Lu AA34443 was pooled from all studies and analyzed simultaneously by nonlinear mixed effect modeling in NONMEM (ICON Development Solutions, version 7.4). The analysis was performed using the stochastic approximation expectation maximization method followed by importance sampling. Differential equations describing the disposition of vortioxetine and Lu AA34443 were specified using the ADVAN13 subroutine. The differential equations from the final model are given in the Supplementary Materials .
Based on a previously developed PopPK model of vortioxetine, 17 the initial structural model tested included two compartments for vortioxetine, whereas different structural models were tested to describe the disposition of Lu AA34443. The absorption and disposition processes were modeled as first‐order and inclusion of an absorption lag‐time parameter was tested.
The clearance from the vortioxetine central compartment was divided into a non‐CYP2D6 mediated clearance (CLother) and a CYP2D6 mediated clearance (CLCYP2D6), the latter reflecting the systemic formation of Lu AA34443. An early appearance of Lu AA34443 in plasma indicated presence of presystemic formation of the metabolite, which was assumed to be mediated by gastrointestinal CYP2D6. Different models were tested to account for the presystemic metabolite formation.
Interindividual variability (IIV) of PK parameters was evaluated using exponential terms on individual model parameters. Covariance between the structural model parameters was also tested. Different residual error models were tested, including additive, proportional, and combined error models.
Discrimination between models was based on several criteria, including minimization of the objective function value (OFV) and/or the Akaike Information Criterion, parameter precision, and visual inspection of goodness‐of‐fit plots.
Covariates were evaluated using the forward‐inclusion and backward‐elimination method. Missing covariate values were imputed with the median value for continuous covariates and the most frequent value for categorical covariates. During forward inclusion, a decrease of 6.64 in OFV for one degree of freedom (corresponding to a P value of 0.01) was considered statistically significant for nested models. Significant covariates were included in the models in a step‐wise manner until an OFV reduction of 6.64 could no longer be obtained. To justify the inclusion of the individual covariates in the model, a backward‐elimination procedure was applied using a stricter P value of 0.005 corresponding to a ΔOFV of 7.88 for one degree of freedom.
The final model was evaluated using visual predictive check plots generated based on 1,000 simulated datasets. A Markov Chain Monte Carlo Bayes estimation (similar to a bootstrap analysis) with 10,000 samples was used to estimate SEs and 95% confidence intervals of the final model parameter estimates.
To estimate the CYP2D6 activity for each subject based on the model, it was assumed that the formation of Lu AA34443 was mediated exclusively by CYP2D6. The total CYP2D6 activity was estimated as the product of the presystemic and systemic metabolite formation (i.e., Fmet × CLCYP2D6) using individual empirical Bayesian estimates from the final PopPK model.
Statistical analysis
Comparisons of estimated CYP2D6 activity between different CYP2D6 genotype groups were performed using Kruskal–Wallis tests for multiple group comparisons followed by pairwise comparisons by Wilcoxon rank sum test correcting for multiple testing (Bonferroni–Holm procedure).
A multiple linear regression analysis was performed to assess the contribution of each variant CYP2D6 allele on the estimated CYP2D6 activity. The CYP2D6 activity estimates were log‐transformed and each CYP2D6 genotype was coded as a sum of indicator variables reflecting the number of each variant allele in the given genotype. The indicator variables were used as predictors in the multiple linear regression model. Different regression models were tested and compared by analysis of variance. The coefficients of the individual alleles in the final model were compared using Wald tests.
Statistical analyses were performed using R version 3.5.1, an open source software environment supported by the R Foundation for Statistical Computing, run under RStudio.
Calculation of activity scores
A CYP2D6 activity score, reflecting the relative activity of each variant CYP2D6 allele to the fully functional alleles (CYP2D6*full), was calculated based on the back‐transformed estimates from the final multiple linear regression model. The estimate for the pooled null function alleles (CYP2D6*null) was assumed to reflect a non‐CYP2D6‐mediated formation of the metabolite and was, therefore, fixed to 0, whereas the estimate for CYP2D6*full was fixed to 1.
The following formula was used to calculate the activity score for allele “X”:
where the β’s denote the back‐transformed estimates from the multiple linear regression model. The confidence intervals for each activity score was estimated using a nonparametric bootstrap approach with 10,000 samples.
RESULTS
Population pharmacokinetic analysis
The PopPK analysis was based on data from 1,140 subjects participating in 29 clinical pharmacology studies of vortioxetine. The dataset consisted of 28,845 plasma concentrations of vortioxetine and 27,942 plasma concentrations of the metabolite, Lu AA34443. The details of the studies are given in Table S1 and the subject characteristics are summarized in Table 1 .
The structural model best describing the PKs of vortioxetine and Lu AA34443 is illustrated in Figure 2 . The model includes central and peripheral compartments for both vortioxetine and Lu AA34443. A hypothetical absorption compartment was included to account for the assumed presystemic formation of Lu AA34443. The presystemic formation of Lu AA34443 was estimated by the parameter Fmet and the systemic formation was estimated by CLCYP2D6. The non‐CYP2D6‐mediated clearance (CLother) was fixed to 12.5 L/h (based on previously internally reported estimates from early model development) to ensure identifiability of the remaining model parameters for Lu AA34443.
Figure 2.
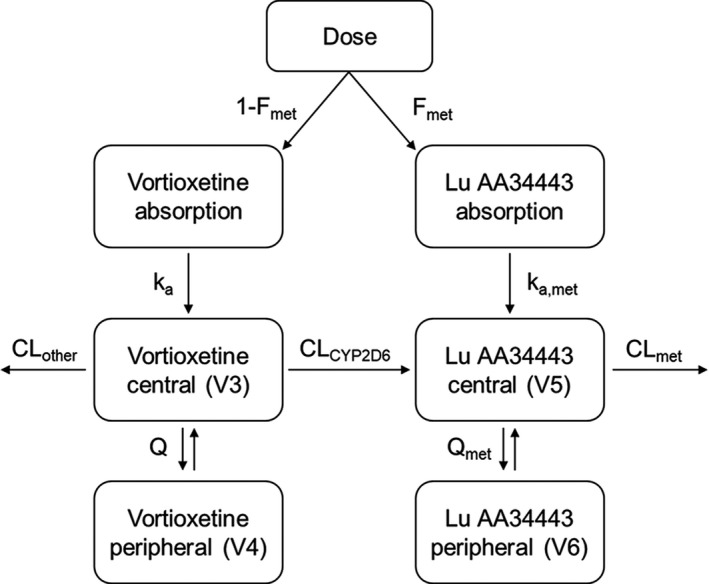
Structural pharmacokinetic model for vortioxetine and its metabolite Lu AA34443. To account for presystemic formation of Lu AA34443, the model includes a hypothetical absorption compartment. The pharmacokinetics of vortioxetine and Lu AA34443 are described by central (V3 and V5), and peripheral (V4 and V6) compartments with intercompartmental clearances (Q and Qmet). The total clearance (CL) of vortioxetine is divided into a non‐CYP2D6‐mediated (CLother) and a CYP2D6‐mediated (CLCYP2D6) clearance, the latter reflecting the formation of Lu AA34443.
The IIV was estimated for all structural model parameters and covariance was estimated among Fmet, V3, and CLCYP2D6 and between V5 and CLmet. The residual error was modeled using a proportional error model.
In the first step of the covariate model building, the influence of CYP2C19 phenotype on the non‐CYP2D6‐mediated metabolism (CLother) was the most significant relationship with an OFV drop of 1,965 (P < 0.0001). In the subsequent steps, the influence of age on CLother (ΔOFV = −144), creatinine clearance on CLmet (ΔOFV = −108), lean body mass on CLother (ΔOFV = −117), height on V3 (ΔOFV = −66), weight on V4 (ΔOFV = −41), and weight on V5 (ΔOFV = −63) were all identified as significant relationships and were added to the full model. During the backward deletion procedure, all the covariate relationships were found to be significant (all P < 0.005) and were, therefore, retained in the final model.
Diagnostic plots (Figure S1 ) indicated an adequate fit of the data for the final model. The visual predictive check plots (Figure S2 ) indicated a good predictive performance of the model based on agreement between the observed and simulated median, 2.5th and 97.5th percentiles.
The final model parameters are summarized in Table 2 . The population estimates for the presystemic (Fmet) and systemic (CLCYP2D6) CYP2D6‐mediated metabolism were 0.19 (IIV 0.56%CV, shrinkage 6.5%) and 13 L/h (IIV 0.43%CV, shrinkage 9.1%), respectively. Both estimates were within the 95% confidence intervals estimated by the Markov Chain Monte Carlo Bayesian analysis.
Table 2.
Parameter estimates from the final PopPK model
| Model parameter | Estimate (%RSE) | IIV (%RSE) | 95% CI |
|---|---|---|---|
| PK parameters | |||
| Absorption rate constant, ka | 0.160 (1.6) | 50.8 (6.1) | 0.153–0.166 |
| Absorption rate constant, metabolite, ka,met | 0.281 (2.8) | 40.4 (6.3) | 0.267–0.282 |
| Presystemic metabolite formation, Fmet | 0.190 (1.9) | 55.9 (5.2) | 0.190–0.202 |
| Volume of distribution, vortioxetine central compartment, V3 | 1,510 (2.4) | 30.1 (6.9) | 1,491–1,494 |
| CYP2D6 mediated clearance (CLCYP2D6) | 13.1 (0.8) | 43.2 (6.0) | 12.6–13.3 |
| Inter‐compartmental clearance, vortioxetine, Q | 21.1 (2.9) | 75.5 (11) | 18.8–23.3 |
| Volume of distribution, vortioxetine peripheral compartment, V4 | 571 (5.8) | 60.7 (8.7) | 544–603 |
| Intercompartmental clearance, vortioxetine, Qmet | 7.69 (2.8) | 14.3 (85) | 8.06–8.72 |
| Volume of distribution, Lu AA34443 central compartment, V5 | 155 (3.4) | 26.1 (15) | 155–158 |
| Lu AA34443 clearance, CLmet | 22.5 (1.8) | 27.4 (7.5) | 22.3–22.7 |
| Volume of distribution, Lu AA34443 peripheral compartment, V6 | 211 (0.8) | 19.1 (28) | 218–231 |
| Lag‐time (ALAG) | 0.966 (66.8) | 50.5 (5.7) | 0.934–0.999 |
| Non‐CYP2D6 mediated clearance (CLother) | |||
| CYP2C19 poor metabolizers | 7.70 (7.1) | 58.6 (4.9) | 7.74–8.33 |
| CYP2C19 intermediate metabolizers | 8.58 (5.1) | 58.6 (4.9) | 8.14–8.98 |
| CYP2C19 normal metabolizers | 12.5 fixed | 58.6 (4.9) | 12.5 fixed |
| Age on CLother | 0.157 (7.2) | – | 0.167–0.179 |
| Creatinine clearance on CLother | 0.0668 (6.5) | – | 0.0620–0.0690 |
| LBM on CLother | 1.36 (9.6) | – | 1.24–1.71 |
| Height on V3 | 1.48 (11.1) | – | 1.62–1.68 |
| Weight on V4 | 0.918 (21.0) | – | 0.564–1.18 |
| Weight on V5 | 0.455 (13.1) | – | 0.370–0.528 |
| Correlation coefficients (ρ) a | |||
| ρ (Fmet,V3) | −0.36 (0.1) | – | – |
| ρ (Fmet,CLCYP2D6) | 0.80 (2.0) | – | – |
| ρ (CLCYP2D6,V3) | 0.22 (0.2) | – | – |
| ρ (CLmet,V5) | 0.99 (1.9) | – | – |
| Residual error (proportional) b | 22.1 (0.1) | – | 21.9–22.2 |
%RSE, relative standard error expressed as percentage of the parameter estimate; ALAG, absorption lag‐time parameter; CI, confidence interval; IIV, interindividual variability; LBM, lean body mass; PK, pharmacokinetic; PopPK, population pharmacokinetic.
IIV: interindividual variability expressed as the coefficient of variation calculated as .
95% CI: confidence interval from a Markov Chain Monte Carlo Bayesian analysis (10,000 samples).
Calculated as .
Expressed as the coefficient of variation calculated as .
CYP2D6 activity estimates
Of the 1,140 subjects included in the PopPK analysis, CYP2D6 genotype data were available for 1,112 subjects and these were included in this subanalysis. A total of 60 different CYP2D6 genotypes were observed (see Table S2 ).
The total CYP2D6 activity was estimated for each subject as the product between the presystemic (Fmet) and systemic (CLCYP2D6) CYP2D6‐mediated metabolism from the final PopPK model. Figure 3 shows the estimated CYP2D6 activity for subjects according to their CYP2D6 genotype. The median (interquartile range) CYP2D6 activity was 0.48 (0.27–0.82) for CYP2D6 PMs, 1.56 (0.94–2.54) for IMs, 3.68 (2.34–5.35) for NMs, and 7.00 (5.79–9.07) for UMs.
Figure 3.
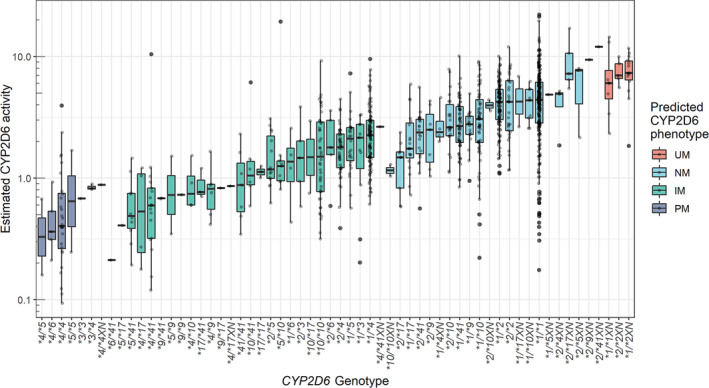
Box‐ and scatterplots of estimated CYP2D6 activity (Fmet × CLCYP2D6) for subjects with various CYP2D6 genotypes. Boxes represent interquartile ranges, lines within boxes indicate median values. IM, intermediate metabolizers; NM, normal metabolizer; PM, poor metabolizer; UM, ultrarapid metabolizer.
Comparison of CYP2D6 genotypes
For the comparisons, CYP2D6 genotypes were grouped according to the functionality of the individual alleles (i.e., full function (CYP2D6*1 and CYP2D6*2, denoted “FF”), decreased function (CYP2D6*9,CYP2D6*10,CYP2D6*17, and CYP2D6*41, denoted “DF”), and null function (CYP2D6*3,CYP2D6*4,CYP2D6*5, andCYP2D6*6, denoted “NF”; see Figure 4 ). Because only few subjects carried the allele combinations NF/DFXN (N = 3) and DF/DFXN (N = 2), these were excluded from the comparisons.
Figure 4.
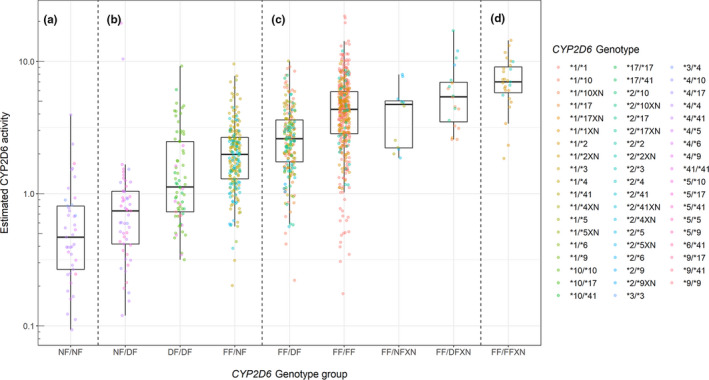
Estimated CYP2D6 activity (Fmet × CLCYP2D6) for subjects with various CYP2D6 genotypes classified as (a) poor metabolizers, (b) intermediate metabolizers, (c) normal metabolizers, and (d) ultrarapid metabolizers.
A comparison of the nine genotype groups showed a significant difference between most of the groups (Bonferroni–Holm corrected P < 0.05, Wilcoxon rank sum). The genotype group comparisons that were not statistically different were NF/NF (N = 41) vs.NF/DF (N = 53; P = 0.053),FF/FF (N = 437) vs.FF/NFXN (N = 12; P = 0.66), FF/FF (N = 437) vs.FF/DFXN (N = 20; P = 0.079),FF/DFXN (N = 20) vs. FF/NFXN (N = 12; P = 0.10), andFF/FFXN (N = 27) vs.FF/DFXN (N = 20; P = 0.075).
The genotype groups classified as CYP2D6 IMs were all significantly different (P < 0.0001) with FF/NF having the highest activity (median 1.98), followed by DF/DF (median 1.12) and NF/DF having the lowest activity (median 0.74).
Multiple linear regression
A multiple linear regression analysis was performed to estimate the impact of the individual CYP2D6 alleles on the CYP2D6 activity. It was found that pooling the null function alleles (CYP2D6*3,CYP2D6*4,CYP2D6*5, andCYP2D6*6) did not deteriorate model fit (P = 0.33) and subsequent pooling of the fully functional alleles (CYP2D6*1 andCYP2D6*2) also did not deteriorate model fit (P = 0.32).
The results of the final multiple linear regression model are given in Table 3 . The CYP2D6 alleles explained 42% of the variability in the estimated CYP2D6 activity (adjusted R 2 = 0.42). In comparison, a linear regression model using the traditional CYP2D6 phenotype classification groups (i.e., PM, IM, NM, and UM) as predictors only explained 34% of the variability (adjusted R 2 = 0.34) and resulted in a significantly worse model fit (P < 0.0001).
Table 3.
Estimated CYP2D6 activity for individual CYP2D6 alleles based on multiple linear regression analysis
| Allele | n a | CYP2D6 activity estimate b | CYP2D6 activity score | 95% CI c |
|---|---|---|---|---|
| CYP2D6*full | 1,407 | 2.20 | 1 | – |
| CYP2D6*null | 374 | 0.87 | 0 | – |
| CYP2D6*9 | 39 | 1.17 | 0.22 | 0.07–0.35 |
| CYP2D6*10 | 210 | 1.36 | 0.37 | 0.27–0.46 |
| CYP2D6*17 | 53 | 1.10 | 0.17 | 0.03–0.30 |
| CYP2D6*41 | 141 | 1.15 | 0.21 | 0.10–0.31 |
The CYP2D6 activity estimated for the CYP2D6*10 allele was significantly greater than that of the CYP2D6*17 and CYP2D6*41 alleles.
CI, confidence interval.
Number of alleles (sum of indicator variables from multiple linear regression).
The CYP2D6 activity estimates were log‐transformed in the multiple linear regression analysis. The table presents the exponentially back‐transformed regression coefficients.
The 95% confidence intervals were calculated using nonparametric bootstrap with 10,000 samples.
In the calculation of the activity scores, the estimated CYP2D6 activity for each allele was scaled to the estimated activity of the pooled fully functional alleles (CYP2D6*full) and the pooled null function alleles (CYP2D6*null; see Methods section).
A comparison of the four decreased function alleles showed that the CYP2D6*10 allele was associated with a significantly higher CYP2D6 activity compared with CYP2D6*17 (Wald test, P = 0.02) and CYP2D6*41 (Wald test, P = 0.01). The activity estimated for the CYP2D6*9 allele was numerically smaller than that of the CYP2D6*10 allele, but the difference was not statistically significant (Wald test, P = 0.17). A sensitivity analysis excluding heterozygous genotypes with duplications provided similar results (see Table S3 ).
DISCUSSION
The objective of this study was to quantify the in vivo metabolic activity of different CYP2D6 alleles and genotypes using PK data for vortioxetine and its metabolite Lu AA34443. The study was based on a large clinical data set comprising subjects of different ethnicities carrying a diverse selection of CYP2D6 genotypes. The number of carriers of the individual alleles was large compared with previous studies published, as can be seen in the CYP2D6 evidence review summary from the Clinical Pharmacogenetics Implementation Consortium (CPIC). 21
As the data originated from clinical pharmacology studies performed in a controlled setting, potential confounding factors, such as lack of compliance and concomitant drug use, were considered minimal. Furthermore, dense PK samples were collected from each subject allowing a more precise quantification of the CYP2D6 activity compared with approaches only utilizing sparse PK sampling (e.g., therapeutic drug monitoring).
The results showed a 63–83% reduction of CYP2D6 activity by the decreased function alleles (CYP2D6*9,CYP2D6*10,CYP2D6*17, and CYP2D6*41) relative to the fully functional alleles (CYP2D6*1 and CYP2D6*2). Furthermore, the decreased function alleles showed different degrees of reduction in CYP2D6 activity with CYP2D6*10 having a significantly higher activity compared with CYP2D6*17 and CYP2D6*41.
Phenotype assignment of particularly the CYP2D6*10 allele has been extensively debated. In 2013, a literature review evaluating the metabolic capacity of CYP2D6*10 did not find sufficient evidence to support downgrading the activity score of CYP2D6*10 to 0.25. 9 However, a few years later, the CPIC provided separate prescribing recommendations for carriers of CYP2D6*10 in their guideline for tamoxifen therapy based on an evidence review. 6 Most recently, a group of international experts supported by the CPIC and Dutch Pharmacogenomics Working Group (DPWG) recommended to downgrade the activity score for CYP2D6*10 to 0.25, triggering an update of a number of CYP2D6‐based treatment guidelines. 12
Based on the findings from the current study, activity scores for all decreased function alleles should optimally be < 0.5, and a lower activity score should be assigned to CYP2D6*17 and CYP2D6*41 reflecting a lower activity relative to CYP2D6*10.
This is supported by recent findings from Haslemo et al. 22 who found that carriers of CYP2D6*41 had a significantly lower CYP2D6‐mediated metabolism of venlafaxine compared with a pooled group of CYP2D6*9−10 carriers. Based on the metabolic ratio of O/N‐desmethylvenlafaxine, they estimated an activity score of 0.095 for CYP2D6*41 and 0.34 for CYP2D6*9–10.
In a previous report by Abduljalil et al., 23 a PopPK analysis of dextromethorphan was used to quantify the metabolic activity of CYP2D6*2 and CYP2D6*41 relative to CYP2D6*1. The authors found that CYP2D6*41 was associated with 60 times lower clearance values compared with CYP2D6*1 and concluded that an activity score of 0.017 should optimally be assigned to CYP2D6*41.
Collectively, these results challenge the recent decision to assign a lower activity score to CYP2D6*10 and provide basis for discussing downgrading the CYP2D6*41 allele instead.
However, extrapolating findings from one compound to another is not as straightforward as the activity of different CYP2D6 alleles has been shown to vary across substrates. 24 , 25 In vitro studies investigating the metabolic activity of CYP2D6*10 and CYP2D6*17 on different CYP2D6 substrates have demonstrated a substantial substrate‐specific and allele‐specific metabolic activity. 24 Furthermore, African American carriers of the CYP2D6*17 allele have been shown to have a normal or even increased metabolic capacity toward those of risperidone. 26
Another complexity of comparing results of functional activity across compounds is that no substrates are metabolized exclusively by CYP2D6. Alternative metabolic pathways vary between substrates and some of these pathways may also be subject to large interindividual differences (e.g., genetically polymorphic enzymes, such as CYP2C9 and CYP2C19).
In summary, assigning differentiated activity scores to decreased function alleles applicable across all substrates may not be an optimal approach and the substrate‐specific nature of CYP2D6 needs to be taken into consideration.
Another finding of the current study was that the genotypes normally classified as CYP2D6 IMs were associated with different levels of CYP2D6 activity depending on the functionality of the individual alleles. According to the activity score classification system, DF/DF and FF/NF carriers are both assigned an activity score of 1 implying equivalent CYP2D6 activity. Our results showed that FF/NF carriers had a 77% higher median CYP2D6 activity compared with DF/DF carriers (1.98 vs. 1.12, P < 0.0001) suggesting that decreased function alleles (CYP2D6*9,CYP2D6*10,CYP2D6*17, and CYP2D6*41) should be assigned an activity score below 0.5.
Similar findings have previously been published by Hertz et al. 10 who reported a 45% greater CYP2D6 activity of FF/NF carriers compared with DF/DF carriers as measured by the metabolic ratio of endoxifen:N‐desmethyl‐tamoxifen. These findings support the hypothesis that the CYP2D6 activity associated with FF alleles is more than double the activity attributable to DF alleles and that a further refinement of the IM phenotype could optimally be made.
Overall, the final PopPK model described the PKs of vortioxetine and Lu AA34443 well. To account for alternative metabolic pathways of vortioxetine, the PopPK model included parameters for both CYP2D6‐mediated clearance (CLCYP2D6) and non‐CYP2D6‐mediated clearance (CLother). To account for potential variation in the activity of the other contributing CYP450 enzymes, subjects’ predicted phenotypes for CYP2C9 and CYP2C19 were tested as covariates on CLother. A limitation of this strategy was that CYP2C9 phenotype data was unavailable for 203 of the subjects included in the analysis. A significant effect of CYP2C19 predicted phenotype on CLother was observed and incorporated into the final model, whereas no significant effect of CYP2C9 predicted phenotype was found.
When estimating the CYP2D6 activity, it was assumed that Lu AA34443 formation was exclusively mediated by CYP2D6, although in vitro studies of vortioxetine have shown that CYP2C9 contributes to the formation of Lu AA34443 to a minor extent. 13 During the covariate modeling, the effect of CYP2C9 inferred phenotype on the systemic metabolite formation (CLCYP2D6) was tested, but no significant effect was found. This might have been confounded by the fact that 203 of the subjects did not have CYP2C9 phenotype data available. Consequently, the effect of IIV in CYP2C9 activity may not be optimally captured in the final PopPK model.
The final PopPK model incorporated several sources of variability on the PK, including the effects of age, body size, and creatinine clearance. Despite inclusion of relevant covariates in the final model, variability in the CYP2D6 activity estimates was still observed within the individual CYP2D6 genotypes, which might be explained by several factors.
Different genotyping assays were used across the studies and some panels only covered a limited number of CYP2D6 variant alleles (see Table S1 ). The CYP2D6*1 (wild‐type) allele was assigned when no variants were detected, and it is therefore likely that this allele included other variants not covered by the genotyping panels. As seen in Figure 2 , the CYP2D6*1/*1 genotype had the largest variability in CYP2D6 activity, some of which may be due to misspecified variant alleles.
Another limitation of the genotyping assays was that in the event of duplications, no information was available on which allele was duplicated or the actual number of gene copies. The high CYP2D6 activity observed (e.g., CYP2D6*2/*9XN, *2/*41XN and *2/*17XN; see Figure 2 ) could imply that multiple gene copies were present in these genotypes.
In addition to genetic factors, a number of physiological, pathological, and environmental factors have been shown to contribute to the expression and activity of CYP2D6. 27 For example, evidence suggests that inflammatory processes may modulate the expression of the CYP2D6 gene 28 and the microbiome has also been hypothesized to contribute to drug metabolism. 29 These factors have not been accounted for in the model and thus could also explain some of the variability of CYP2D6 activity observed within the genotypes.
The final CYP2D6 activity estimates were closely correlated with subjects’ CYP2D6 genotypes, which supports the applicability of PopPK modeling to estimate in vivo activity of CYP2D6 even for compounds that are not exclusively metabolized by CYP2D6. In the future, PopPK models could be developed for other CYP2D6 substrates with the purpose of quantifying the in vivo CYP2D6 activity for different CYP2D6 genotypes across substrates.
In conclusion, a joint PopPK model of vortioxetine and Lu AA34443 provided reliable estimates of CYP2D6 mediated metabolism. The results showed a significantly higher CYP2D6 activity associated with the CYP2D6*10 allele compared with CYP2D6*17 and CYP2D6*41. Furthermore, the genotypes classified as the IM phenotype showed different levels of CYP2D6 activity depending on the functionality of the individual alleles. These findings provide basis for discussing the recent recommendation of assigning a lower activity score to CYP2D6*10 and suggest that the IM phenotype could benefit from additional refinement.
FUNDING
The research was funded by Innovation Fund Denmark and H. Lundbeck A/S.
CONFLICT OF INTEREST
T.F., J.A., and E.S. are employed by H. Lundbeck A/S. All other authors declared no competing interests for this work.
AUTHOR CONTRIBUTIONS
T.F., J.A., E.S., T.B.S., and K.B. wrote the manuscript. J.A. and E.S. designed the research. T.F. and J.A. performed the research. T.F., J.A., T.B.S., and K.B. analyzed the data.
Supporting information
Table S1
Table S2
Table S3
Supplementary Material
Fig S1
Fig S2
Acknowledgments
The authors would like to acknowledge Lars Lau Raket for statistical support and critical review of this paper. The study data underlying the analysis was provided by H. Lundbeck A/S and Takeda Pharmaceutical Company Ltd.
[The copyright line for this article was changed on 11 September 2020 after original online publication].
References
- 1. Saravanakumar, A. , Sadighi, A. , Ryu, R. & Akhlaghi, F. Physicochemical properties, biotransformation, and transport pathways of established and newly approved medications: a systematic review of the top 200 most prescribed drugs vs. the FDA‐approved drugs between 2005 and 2016. Clin. Pharmacokinet. 58, 1281–1294 (2019). [DOI] [PMC free article] [PubMed] [Google Scholar]
- 2. Zanger, U.M. & Schwab, M. Cytochrome P450 enzymes in drug metabolism: Regulation of gene expression, enzyme activities, and impact of genetic variation. Pharmacol. Ther. 138, 103–141 (2013). [DOI] [PubMed] [Google Scholar]
- 3. Brown, J.T. et al Clinical pharmacogenetics implementation consortium guideline for cytochrome P450 (CYP)2D6 genotype and atomoxetine therapy. Clin. Pharmacol. Ther. 106, 94–102 (2019). [DOI] [PMC free article] [PubMed] [Google Scholar]
- 4. Crews, K.R. et al Clinical pharmacogenetics implementation consortium guidelines for cytochrome P450 2D6 genotype and codeine therapy: 2014 update. Clin. Pharmacol. Ther. 95, 376–382 (2014). [DOI] [PMC free article] [PubMed] [Google Scholar]
- 5. Bell, G.C. et al Clinical Pharmacogenetics Implementation Consortium (CPIC) guideline for CYP2D6 genotype and use of ondansetron and tropisetron. Clin. Pharmacol. Ther. 102, 213–218 (2017). [DOI] [PMC free article] [PubMed] [Google Scholar]
- 6. Goetz, M.P. et al Clinical Pharmacogenetics Implementation Consortium (CPIC) guideline for CYP2D6 and tamoxifen therapy. Clin. Pharmacol. Ther. 103, 770–777 (2018). [DOI] [PMC free article] [PubMed] [Google Scholar]
- 7. Hicks, J.K. et al Clinical Pharmacogenetics Implementation Consortium (CPIC) guideline for CYP2D6 and CYP2C19 genotypes and dosing of selective serotonin reuptake inhibitors. Clin. Pharmacol. Ther. 98, 127–134 (2015). [DOI] [PMC free article] [PubMed] [Google Scholar]
- 8. Hicks, J.K. et al Clinical Pharmacogenetics Implementation Consortium guideline (CPIC) for CYP2D6 and CYP2C19 genotypes and dosing of tricyclic antidepressants: 2016 update. Clin. Pharmacol. Ther. 102, 37–44 (2017). [DOI] [PMC free article] [PubMed] [Google Scholar]
- 9. Hicks, J.K. , Swen, J.J. & Gaedigk, A. Challenges in CYP2D6 phenotype assignment from genotype data: a critical assessment and call for standardization. Curr. Drug Metab. 15, 218–232 (2014). [DOI] [PubMed] [Google Scholar]
- 10. Hertz, D.L. et al In vivo assessment of the metabolic activity of CYP2D6 diplotypes and alleles. Br. J. Clin. Pharmacol. 80, 1122–1130 (2015). [DOI] [PMC free article] [PubMed] [Google Scholar]
- 11. Gaedigk, A. et al The CYP2D6 activity score: translating genotype information into a qualitative measure of phenotype. Clin. Pharmacol. Ther. 83, 234–242 (2008). [DOI] [PubMed] [Google Scholar]
- 12. Caudle, K.E. et al Standardizing CYP2D6 genotype to phenotype translation: consensus recommendations from the Clinical Pharmacogenetics Implementation Consortium and Dutch Pharmacogenetics Working Group. Clin. Transl. Sci. 13, 116–124 (2019). [DOI] [PMC free article] [PubMed] [Google Scholar]
- 13. Hvenegaard, M.G. et al Identification of the cytochrome P450 and other enzymes involved in the in vitro oxidative metabolism of a novel antidepressant, Lu AA21004. Drug Metab. Dispos. 40, 1357–1365 (2012). [DOI] [PubMed] [Google Scholar]
- 14. Chen, G. , Højer, A.M. , Areberg, J. & Nomikos, G. Vortioxetine: clinical pharmacokinetics and drug interactions. Clin. Pharmacokinet. 57, 673–686 (2018). [DOI] [PMC free article] [PubMed] [Google Scholar]
- 15. Nilausen, D. , Højer, A.‐M. & Bendahl, L. Absorption, metabolism, and excretion of an oral dose of [14C]‐LU AA21004 50 mg in healthy men. J. Clin. Pharmacol. 49, 1113 (2009). [Google Scholar]
- 16. Areberg, J. , Søgaard, B. & Højer, A.‐M. The clinical pharmacokinetics of Lu AA21004 and its major metabolite in healthy young volunteers. Basic Clin. Pharmacol. Toxicol. 111, 198–205 (2012). [DOI] [PubMed] [Google Scholar]
- 17. Areberg, J. , Petersen, K.B. , Chen, G. & Naik, H. Population pharmacokinetic meta‐analysis of vortioxetine in healthy individuals. Basic Clin. Pharmacol. Toxicol. 115, 552–559 (2014). [DOI] [PMC free article] [PubMed] [Google Scholar]
- 18. Naik, H. et al A population pharmacokinetic‐pharmacodynamic meta‐analysis of vortioxetine in patients with major depressive disorder. Basic Clin. Pharm. Toxicol. 118, 344–355 (2016). [DOI] [PubMed] [Google Scholar]
- 19. US Food and Drug Administration . Guidance for Industry ‐ Bioanalytical Method Validation. https://www.fda.gov/regulatory‐information/search‐fda‐guidance‐documents/bioanalytical‐method‐validation‐guidance‐industry (2013).
- 20. Chen, G. et al Pharmacokinetic drug interactions involving vortioxetine (Lu AA21004), a multimodal antidepressant. Clin. Drug Invest. 33, 727–736 (2013). [DOI] [PMC free article] [PubMed] [Google Scholar]
- 21. Clinical Pharmacogenetics Implementation Consortium (CPIC) CYP2D6 Genotype to Phenotype Standardization Project (2019). <https://cpicpgx.org/resources/cyp2d6‐genotype‐to‐phenotype‐standardization‐project/>. Accessed March 31, 2020.
- 22. Haslemo, T. , Eliasson, E. , Jukic, M.M. , Ingelman‐Sundberg, M. & Molden, E. Significantly lower CYP2D6 metabolism measured as the O/N‐desmethylvenlafaxine metabolic ratio in carriers of CYP2D6*41 versus CYP2D6*9 or CYP2D6*10: a study on therapeutic drug monitoring data from 1003 genotyped Scandinavian patients. Br. J. Clin. Pharmacol. 85, 194–201 (2019). [DOI] [PMC free article] [PubMed] [Google Scholar]
- 23. Abduljalil, K. et al Assessment of activity levels for CYP2D6*1, CYP2D6*2, and CYP2D6*41 genes by population pharmacokinetics of dextromethorphan. Clin. Pharmacol. Ther. 88, 643–651 (2010). [DOI] [PubMed] [Google Scholar]
- 24. Shen, H. et al Comparative metabolic capabilities and inhibitory profiles of CYP2D6.1, CYP2D6.10, and CYP2D6.17. Drug Metab. Dispos. 35, 1292–1300 (2007). [DOI] [PubMed] [Google Scholar]
- 25. Kirchheiner, J. et al Pharmacogenetics of antidepressants and antipsychotics: the contribution of allelic variations to the phenotype of drug response. Mol. Psychiatry 9, 442–473 (2004). [DOI] [PubMed] [Google Scholar]
- 26. Cai, W.M. et al CYP2D6 genetic variation in healthy adults and psychiatric African‐American subjects: implications for clinical practice and genetic testing. Pharmacogenomics J. 6, 343–350 (2006). [DOI] [PubMed] [Google Scholar]
- 27. He, Z.‐X. , Chen, X.‐W. , Zhou, Z.‐W. & Zhou, S.‐F. Impact of physiological, pathological and environmental factors on the expression and activity of human cytochrome P450 2D6 and implications in precision medicine. Drug Metab. Rev. 47, 470–519 (2015). [DOI] [PubMed] [Google Scholar]
- 28. Shah, R.R. & Smith, R.L. Inflammation‐induced phenoconversion of polymorphic drug metabolizing enzymes: hypothesis with implications for personalized medicine. Drug Metab. Dispos. 43, 400–410 (2015). [DOI] [PubMed] [Google Scholar]
- 29. Koppel, N. , Rekdal, V.M. & Balskus, E.P. Chemical transformation of xenobiotics by the human gut microbiota. Science 80, 1246–1257 (2017). [DOI] [PMC free article] [PubMed] [Google Scholar]
Associated Data
This section collects any data citations, data availability statements, or supplementary materials included in this article.
Supplementary Materials
Table S1
Table S2
Table S3
Supplementary Material
Fig S1
Fig S2