Abstract
Chronic hepatitis B virus (CHB) infection is one of the primary risk factors associated with the development of hepatocellular carcinoma (HCC). Despite having been extensively studied, diagnosing early-stage HCC remains challenging, and diagnosed patients have a poor (3–5%) survival rate. Identifying new approaches to detect changes in the serum metabolic profiles of patients with CHB and liver cirrhosis (LC) may provide a valuable approach to better detect HCC at an early stage when it is still amenable to treatment, thereby improving patient prognosis and survival. In the present study, we, therefore, employed a liquid chromatography-mass spectrometry (LC-MS)-based approach to evaluate the serum metabolic profiles of 30 CHB patients, 29 LC patients, and 30 HCC patients. We then employed appropriate statistical methods to identify those metabolites that were best able to distinguish HCC cases from LC and CHB controls. A mass-based database was then used to putatively identify these metabolites. We then confirmed the identities of a subset of these metabolites through comparisons with the MS/MS fragmentation patterns and retention times of reference standards. The serum samples were then reanalyzed to quantify the levels of these selected metabolites and of other metabolites that have previously been identified as potential HCC biomarkers. Through this approach, we observed clear differences in the metabolite profiles of the CHB, LC, and HCC patient groups in both positive- and negative-ion modes. We found that the levels of taurodeoxy cholic acid (TCA) and 1,2-diacyl-3-β-d-galactosyl-sn-glycerol rose with the progression from CHB to LC to HCC, whereas levels of 5-hydroxy-6E,8Z,11Z,14Z,17Z-eicosapentaenoic acid, and glycyrrhizic acid were gradually reduced with liver disease progression in these groups. The ROC analysis showed that taurodeoxy cholic acid (TCA), 1,2-diacyl-3-β-d-galactosyl-sn-glycerol, 5-hydroxy-6E,8Z,11Z,14Z,17Z-eicosapentaenoic acid, and glycyrrhizic acid had a diagnosis performance with liver disease progression. These four metabolites have a significant correlation with alpha fetal protein (AFP) level and age. Our results highlight novel metabolic biomarkers that have the potential to be used for differentiating between CHB, LC, and HCC patients, thereby facilitating the identification and treatment of patients with early-stage HCC.
Introduction
Hepatocellular carcinoma (HCC) remains one of the most prevalent forms of cancer and the third leading cause of cancer-associated mortality with a 5-year survival rate of <7%.1,2 One of the primary risk factors for HCC development is chronic hepatitis B virus (CHB) infection, which can progress to liver cirrhosis (LC) and HCC.3,4 In high-risk populations such as LC patients, it is essential that HCC is detected at an early stage when the treatments still have the potential to cure disease or to significantly prolong patient survival.5 Currently, the majority of HCC patients are not diagnosed until the disease is in an advanced stage owing to a lack of symptoms associated with a precancerous state and early stages of oncogenesis.6 The most sensitive clinical biomarker of HCC at present is alpha fetal protein (AFP), which is still of limited utility given that it has a disappointing sensitivity of just 70%.7 It is thus essential that a novel approach to identifying HCC-specific biomarkers be identified to facilitate early-stage HCC detection, diagnosis, and treatment so as to improve patient prognosis.
Metabolomic studies offer a comprehensive approach to characterize the biochemical profiles of particular physiological or pathological states. Such metabolomic approaches thus have the potential to offer valuable insights into the molecular mechanisms governing HCC development and progression.8,9 Liquid chromatography-mass spectrometry (LC-MS) approaches are a standard means of conducting metabolomic analyses, as they offer a high-resolution and sensitive means of identifying metabolite profiles in complex sample types.10,11 Many studies to date have employed LC-MS-based metabolomic profiling approaches to characterize small-molecule metabolites in specific tissues, organs, and biofluids to identify biomarkers associated with specific disease states and to better understand the molecular basis of the disease-related phenotypes. Prior studies have specifically sought to identify metabolic biomarkers of HCC in patient serum, urine, plasma, and fecal samples,12−17 comparing the HCC patient samples to those from healthy controls or patients with benign liver tumors. However, whether these same biomarkers can discriminate between CHB, LC, and HCC patients remains to be determined, and identifying biomarkers that can reliably differentiate between these high-risk patient groups is vital.
In the present study, we used an LC/MS approach to differentiate the serum profiles of CHB, LC, and HCC patients. Based on the differential metabolites identified through this approach, we additionally identified metabolic pathways and correlation networks that may be of value for the clinical diagnosis of HCC.
Results and Discussion
Metabolite Identification
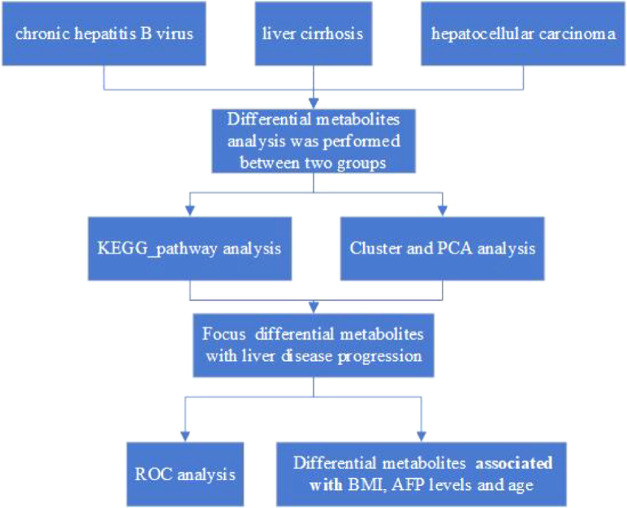
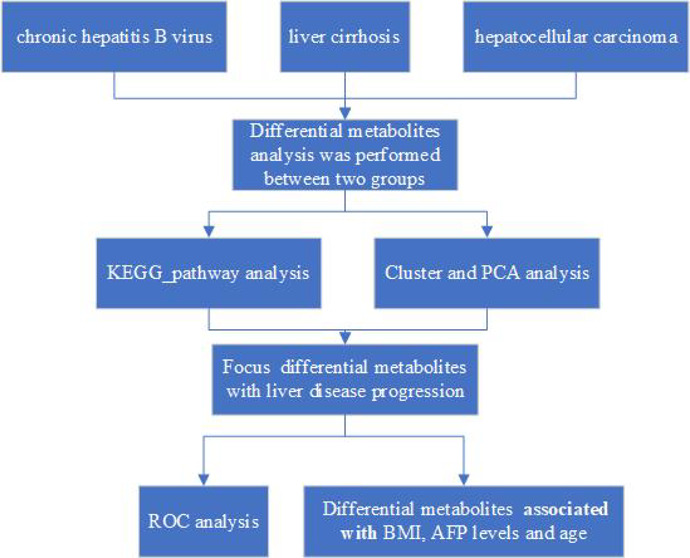
We began by employing an LC-MS/MS approach to identify metabolite biomarkers of CHB, LC, and HCC, with m/z and RT values for each feature being collected. Quality control (QC) for these metabolic features was performed based upon the overall MS signal intensity controlled by the total ion chromatogram (TIC), m/z peak width, and retention time values (Table S1). After MSConvert was used to convert raw will format data into an mzXML format [27], peak alignment and extraction was performed and peak area values were calculated. We ultimately determined that 21 236 and 15 665 metabolites were identified in positive- and negative-ion modes, respectively, of which 12 413 and 9645, respectively, were of high quality. Of these, we were in turn able to successfully annotate 7403 and 6083 metabolites obtained in positive- and negative-ion modes, respectively (Table 2). The technical selection route of the diagnostic biomarker along with disease progression from CHB, LC, to HCC in the patients displayed in Figure 1 and Tables 1 and 2.
Table 2. Statistics for Quantitative Metabolites.
| mode | all metabolites | high-quality metabolites | all annotated |
|---|---|---|---|
| POS | 21 236 | 12 413 | 7406 |
| NEG | 15 665 | 9645 | 6083 |
| total | 36 901 | 22 058 | 13 489 |
Figure 1.
Schedule of the research.
Table 1. Summary of Patient Demographics and Characteristics.
| CHB (N = 27) | LC (N = 29) | HCC (N = 25) | |
|---|---|---|---|
| clinical_NA | 3 | 1 | 4 |
| age (years), mean ± SD | 41.67 ± 10.99 | 51.62 ± 9.5 | 60.6 ± 8.97 |
| AFP (ng/mL), mean ± SD | 4.31 ± 4.2 | 15.76 ± 67.98 | 7990.88 ± 24565.75 |
| height (cm), mean ± SD | 170.74 ± 7.39 | 169.62 ± 7.41 | 170.48 ± 5.88 |
| weight (kg), mean ± SD | 67.06 ± 7.64 | 65.3 ± 9.26 | 68.36 ± 8.74 |
| BMI, mean ± SD | 23 ± 2.18 | 22.59 ± 1.99 | 23.49 ± 2.38 |
| gender, n (%) | |||
| female | 6 (22.22) | 8 (27.59) | 2 (8.00) |
| male | 21 (77.78) | 21 (72.41) | 23 (92.00) |
Cluster Analysis and PCA
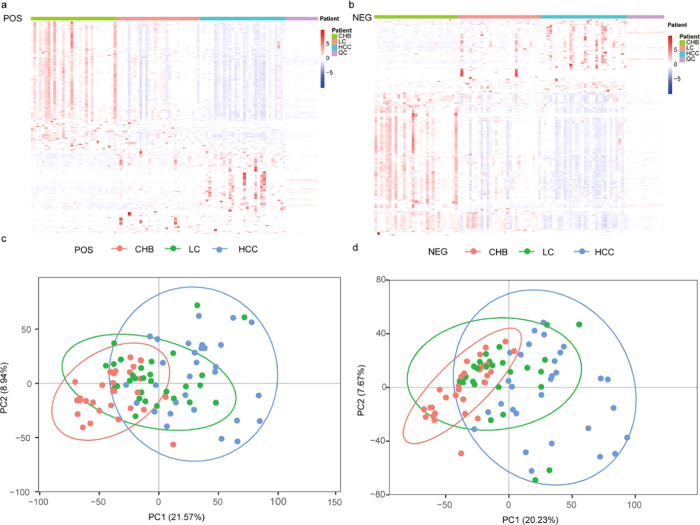
Global metabolic differences between CHB, LC, and HCC samples were next evaluated. We began by clustering these identified metabolites into a heatmap that was able to readily differentiate between these three patient groups (Figure 2a,b). A further principal component analysis (PCA) revealed a clear differentiation between these three patient groups in both positive-ion mode (Figure 2c) and negative-ion mode (Figure 2d), with the variability between the samples in these PCA plots being attributable to differences in metabolite levels.
Figure 2.
Heatmap of the metabolites identified among CHB, LC, and HCC patients in the (a) POS model and the (b) NEG model. The heatmap scale ranges from −5 to + 5 on a log 2 scale. The principal component analysis (PCA) score plots of the three truffle types in the (c) POS model and the (d) NEG model.
Differential Analysis
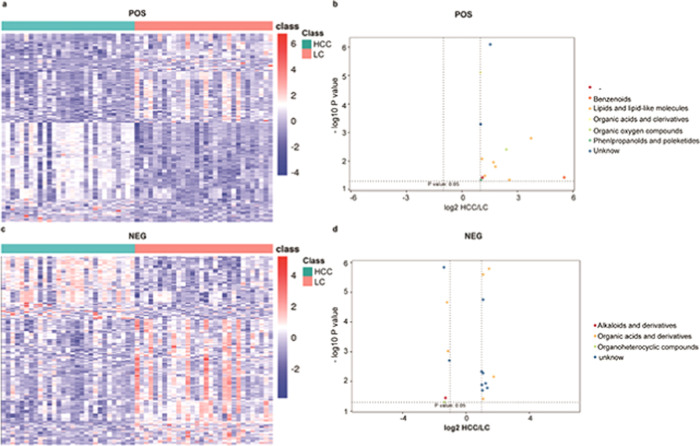
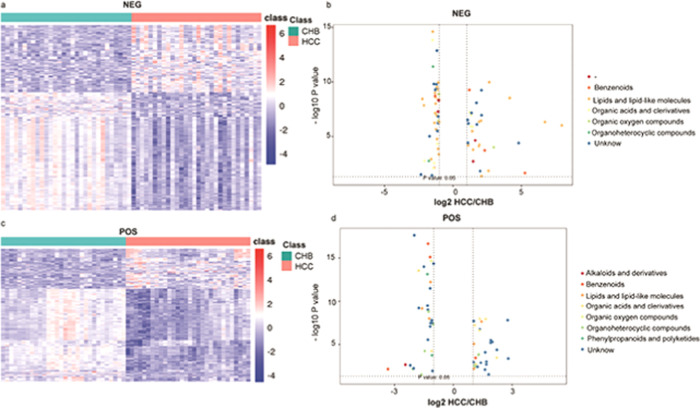
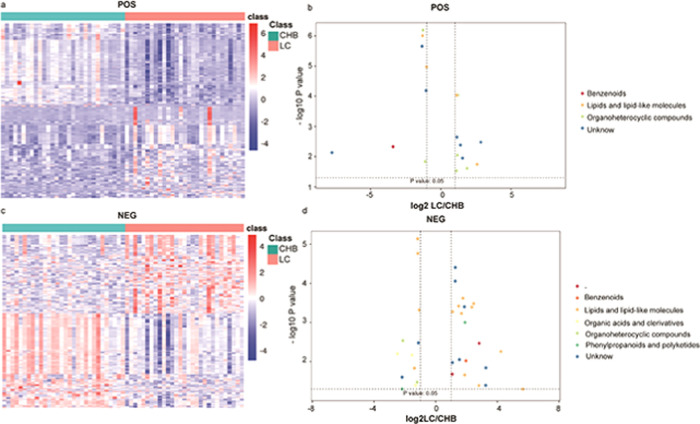
We next conducted a differential analysis of the identified high-quality metabolites to gain quantitative insights into their relative levels in our CHB, LC, and HCC patient samples. The metabolite levels were compared on the basis of both fold-change and p-vales, revealing that 279 and 307 metabolites were upregulated and downregulated, respectively, in HCC patient samples relative to LCC patient samples (Table 3 and Figure 3). In addition, we identified metabolites that were found to exhibit significant differences in abundance when comparing positive- and negative-ion mode data, including benzenoids, lipids and lipid-like molecules, organic acids and derivatives, organic oxygen compounds, phenylpropanoids and polyketides, and alkaloids and derivatives. In addition, we identified 858 and 1720 metabolites that were upregulated and downregulated, respectively, in HCC patient samples relative to CHB patient samples (Table 3 and Figure 4). These differentially abundant metabolites included benzenoids, lipids and lipid-like molecules, organic acids and derivatives, organic oxygen compounds, organoheterocyclic compound, phenylpropanoids and polyketides, and alkaloids and derivatives thereof as detected in both negative- and positive-ion modes. Lastly, we identified 347 and 329 metabolites that were upregulated and downregulated, respectively, in the LC patient samples relative to the CHB patient samples (Table 3 and Figure 5). These included benzenoids, lipids and lipid-like molecules, organic acids and derivatives, organoheterocyclic compounds, and phenylpropanoids and polyketides.
Table 3. Statistics for Differential Metabolites between Different Groups.
| mode | comparison | all | up | down |
|---|---|---|---|---|
| POS | HCC vs LC | 12 413 | 112 | 125 |
| POS | HCC vs CH | 12 413 | 397 | 916 |
| POS | LC vs CH | 12 413 | 199 | 182 |
| NEG | HCC vs LC | 9645 | 165 | 82 |
| NEG | HCC vs CH | 9645 | 461 | 804 |
| NEG | LC vs CH | 9645 | 148 | 176 |
Figure 3.
Heatmap of the different metabolites between HCC and LC patients in the (a) NEG model and the (c) POS model. The scatterplot shows the different metabolites of MS2 between HCC and LC patients in the (b) NEG model and the (d) POS model.
Figure 4.
Heatmap of the different metabolites between HCC and CHB patients in the (a) NEG model and the (c) POS model. The scatterplot shows the different metabolites of MS2 between HCC and CHB patients in the (b) NEG model and the (d) POS model.
Figure 5.
Heatmap of the different metabolites between LC and CHB patients in the (a) NEG model and the (c) POS model. The scatterplot shows the different metabolites of MS2 between LC and CHB patients in the (b) NEG model and the (d) POS model.
Kyoto Encyclopedia of Genes and Genomes (KEGG) Analysis
Liver disease progression and HCC development are complex processes associated with significant changes in secondary metabolite production. As such, we next employed a Kyoto Encyclopedia of Genes and Genomes (KEGG) functional enrichment approach to identify metabolic changes consistent with the differential metabolite profiles identified in our different patient serum samples. The majority of the secondary metabolites that were differentially abundant when comparing HCC and LC samples were associated with defined KEGG metabolic pathways including GABAergic synapses, pentose and glucuronate interconversion, FoxO signaling, amino sugar and nucleotide sugar metabolism, and alanine, aspartate, and glutamate metabolism (Figure S1). Metabolites that were differentially abundant between the HCC and CHB patient groups were found to be associated with bile secretion, pentose and glucuronate interconversion, C5-branched dibasic acid metabolism, d-glutamine and d-glutamate metabolism, histidine metabolism, 2-oxocarboxylic acid metabolism, and glyoxylate and dicarboxylate metabolism (Figure S2). In addition, metabolites that were differentially abundant between the LC and CHB groups were associated with steroid hormone biosynthesis, glycerophospholipid metabolism, unsaturated fatty acid biosynthesis, glycerolipid metabolism, ABC transporters, retrograde endocannabinoid signaling, and riboflavin metabolism (Figure S3).
Metabolites Associated with Progressive Liver Disease
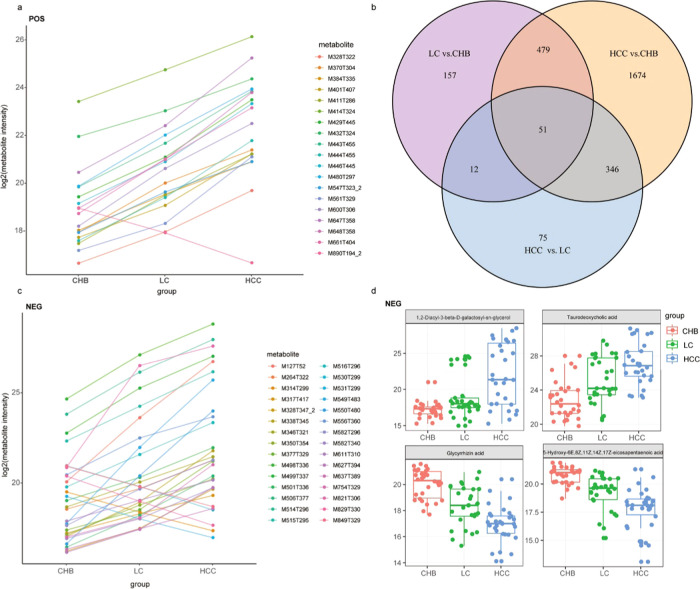
Lastly, we evaluated metabolite profiles to identify trends in metabolic changes associated with liver disease progression from CHB to LC to HCC. We found that certain metabolites gradually decreased with disease progression, whereas others gradually increased (Figure 6a,c). A Venn diagram analysis revealed that there were 1674 different metabolites when comparing HCC and CHB samples, 157 when comparing LC and CHB samples, and 75 when comparing LC and HCC samples (Figure 6b and Table S2). Overall, these findings suggest that there are relatively lower different metabolites that are associated with liver disease progression to HCC. Specifically, we found that taurodeoxy cholic acid (TCA) and 1,2-diacyl-3-β-d-galactosyl-sn-glycerol levels gradually increased with liver disease progression, whereas 5-hydroxy-6E,8Z,11Z,14Z,17Z-eicosapentaenoic acid and glycyrrhizic acid levels gradually decreased with disease progression (Figure 6d).
Figure 6.
Identify trends in metabolic changes associated with liver disease progression from CHB to LC to HCC in the POS model (a) and the NEG model (c). Venn diagram result between the three groups, HCC vs LC, HCC vs CHB, and LC vs CHB (b). Focus key metabolic change associated with liver disease progression from CHB to LC to HCC in NEG model (d).
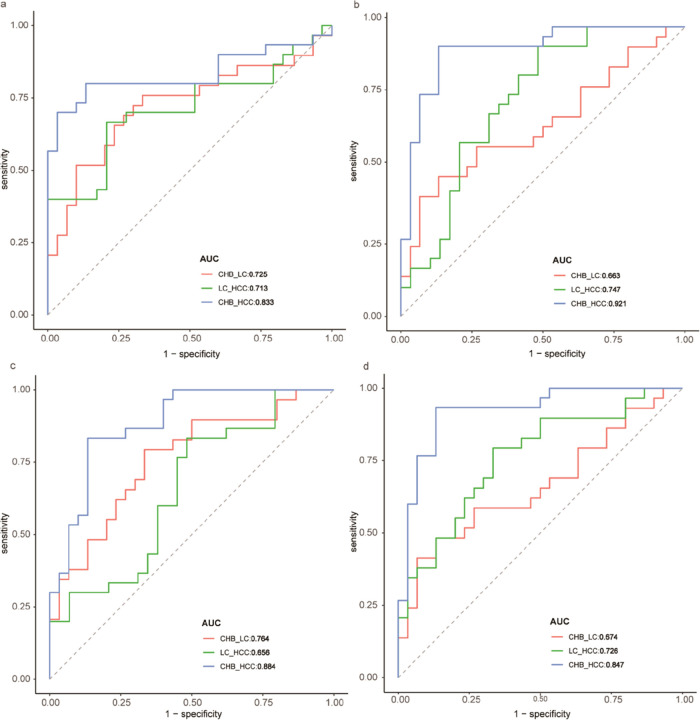
We performed a ROC analysis to test the prediction power of 1,2-diacyl-3-β-d-galactosyl-sn-glycerol,5-hydroxy-6E,8Z,11Z,14Z,17Z-eicosapentaenoic acid, taurodeoxy cholic acid (TCA), and glycyrrhizic acid, which thinked the larger area under the ROC curve as a better model for predict diagnosis performance with liver disease progression. The predictive ability of 1,2-diacyl-3-β-d-galactosyl-sn-glycerol was higher in HCC vs CHB than LC vs CHB and HCC vs LC (AUCHCC vs CHB = 0.833 vs AUCLC vs CHB = 0.725 vs AUCHCC vs LC = 0.713; Figure 7a). The predictive ability of 5-hydroxy-6E,8Z,11Z,14Z,17Z-eicosapentaenoic acid was higher in HCC vs CHB than LC vs CHB and HCC vs LC (AUCHCC vs CHB = 0.921 vs AUCLC vs CHB = 0.663 vs AUCHCC vs LC = 0.747; Figure 7b). The predictive ability of taurodeoxy cholic acid was higher in HCC vs CHB than LC vs CHB and HCC vs LC (AUCHCC vs CHB = 0.884 vs AUCLC vs CHB = 0.663 vs AUCHCC vs LC = 0.747; Figure 7c). The predictive ability of glycyrrhizic acid was higher in HCC vs CHB than LC vs CHB and HCC vs LC (AUCHCC vs CHB = 0.847 vs AUCLC vs CHB = 0.726 vs AUCHCC vs LC = 0.574; Figure 7d). The four metabolites could offer better diagnosis performance for the three-way comparisons (HCC vs LC, LC vs CHB, HCC vs CHB) using a regression model (Figure S6). These results showed that these metabolites had diagnosis performance with liver disease progression.
Figure 7.
ROC analysis to test the prediction power of 1,2-Diacyl-3-β-d-galactosyl-sn-glycerol (a), 5-hydroxy-6E,8Z,11Z,14Z,17Z-eicosapentaenoic acid (b), taurodeoxy cholic acid (c), and glycyrrhizic acid (d), which thought the larger area under the ROC curve as a better model for predict diagnosis performance with liver disease progression.
Correlation Analysis between the Levels of These Different Metabolites and the BMI, AFP Levels, Age
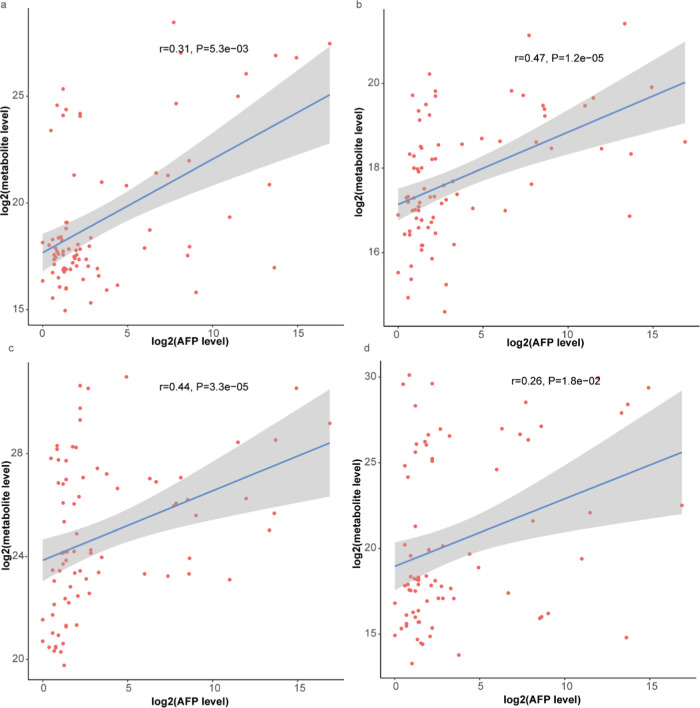
Subsequently, we have done a correlation analysis between the levels of these different metabolites and the body mass index (BMI), alpha-fetoprotein (AFP) levels, and age. The results showed that 1,2-diacyl-3-β-d-galactosyl-sn-glycerol,5-hydroxy-6E,8Z,11Z,14Z,17Z-eicosapentaenoic acid, taurodeoxy cholic acid (TCA), and glycyrrhizic acid have significant positive correlations with the AFP levels (P < 0.05). 5-Hydroxy-6E,8Z,11Z,14Z,17Z-eicosapentaenoic acid (Figure 8b) and taurodeoxy cholic acid (Figure 8c) had more correlations than 1,2-diacyl-3-β-d-galactosyl-sn-glycerol (Figure 8a) and glycyrrhizic acid (Figure 8d). These four metabolites have no significant correlation with BMI (Figure S4) and have a significant correlation with age (Figure S5).
Figure 8.
Correlation analysis between the levels of these different metabolites and the AFP levels: 1,2-diacyl-3-β-d-galactosyl-sn-glycerol (a); 5-hydroxy-6E,8Z,11Z,14Z,17Z-eicosapentaenoic acid (b); taurodeoxy cholic acid (c); and glycyrrhizic acid (d).
In the present study, a deep understanding of the metabolites involved in the development of HCC is needed to identify new biomarkers to diagnose HCC in the early stages and develop more effective therapeutic strategies.18−20
So, we employed an LC-MS/MS approach to identify metabolite profiles that were characteristic of CHB, LC, and HCC patient serum samples. A Venn diagram analysis revealed relatively lesser different metabolites in CHH vs LC patients compared to CHB vs CHB patients and CHH vs LC patients. TCA, glycyrrhizin acid (GA), 1,2-diacyl-3-β-d-galactosyl-sn-glycerol, and 5-hydroxy-6E,8Z,11Z,14Z,17Z-eicosapentaenoic acid were found to be the metabolites that were most closely associated with liver disease progression from CHB to LC to HCC. The ROC results showed that these metabolites had diagnosis performance with liver disease progression.
Bile acid biosynthesis dysfunction has been found to be linked to the onset and progression of liver cancer.21 Indeed, bile acids play can promote NF-κB signaling and subsequent inflammation that can drive HCC progression.22−24 Prior studies have demonstrated that patients with hepatitis and LC exhibit altered bile acid levels,13,25,26 and there is evidence that TCA levels are elevated in the serum of CHB patients relative to healthy control individuals.25 The use of bile acids as biomarkers of hepatic injury has thus been proposed as a means of monitoring patients for metabolic changes associated with LC development and progression.26 In this study, we found that the TCA levels continued to increase as the disease progressed from CHB to LC to HCC, indicating that TCA may be a viable biomarker that can be used to monitor and diagnose patients at high risk of HCC.
GA is a pentacyclic triterpenoid and an active aglycone derived from glycyrrhizin (GL). Hepatocytes express high levels of GA receptors on their cell membranes,27 and GA receptor expression has been shown to increase by 1.5- to 5-fold in tumor tissues relative to control tissues.28 GA is known to exert antiapoptotic and anti-inflammatory activities owing to its ability to suppress caspase-3 activation and tumor necrosis factor (TNF) signaling, potentially explaining the hepatoprotective properties of this compound.29 A number of recent studies have explored the use of GA-modified liposomes to improve hepatic drug delivery for the treatment of HCC,30−32 and randomized clinical trials have provided evidence that GL can protect against hepatic damage in CHB and LC patients, promoting the restoration of liver function.33 To date, however, few studies have examined how GA levels are associated with liver disease progression. Our results suggest that GA levels declined with the progression from CHB to LC to HCC, suggesting that the GA levels may be a valuable biomarker that can help to diagnose HCC onset in LC patients.
Eicosapentaenoic acid (EPA) is a bioactive omega-3 polyunsaturated fatty acid that is found in high levels in fish oil and exhibits diverse anti-inflammatory and antilipogenic properties.34 EPA has been found to inhibit obesity-related HCC development, functioning via inhibiting the activation of the STAT3 transcription factor and subsequent production of the pro-oncogenic inflammatory transcription factor IL-6.35 In a separate study, Lu et al. determined that EPA levels were significantly lower in CHB, LC, and HCC patients.36 Our results are consistent with these findings, suggesting that 5-hydroxy-6E,8Z,11Z,14Z,17Z-eicosapentaenoic acid can be used as a stable biomarker of LC and HCC in CHB patients. We also found that 1,2-diacyl-3-β-d-galactosyl-sn-glycerol levels declined progressively with the advancement of liver disease in these patients. This metabolite is associated with glycerolipid metabolism, but its relevance in the context of CHB, LC, and HCC remains to be characterized.
Wang et al. and Cho et al. have searched for biomarkers to differentiate early-stage hepatocellular carcinoma from cirrhosis or healthy control.37,38 Few studies have screened diagnostic biomarker with disease progression from CHB, LC, to HCC in the patients.
We characterized changes in serum metabolite profiles with liver disease progression from CHB to LC to HCC via an LC-MS/MS-based approach. Therefore, our study was innovative in the selection of patients. We identified those metabolites that best differentiated HCC patients from LC patients based upon these analyses, annotating them via comparing identified monoisotopic ion masses to mass-based reference databases. We ultimately identified TCA and 1,2-diacyl-3-β-d-galactosyl-sn-glycerol levels as having increased gradually with liver disease progression from CHB to LC to HCC, whereas levels of GA and 5-hydroxy-6E,8Z,11Z,14Z,17Z-eicosapentaenoic acid decreased with disease progression. These metabolites are thus promising biomarkers that have the potential to be used to detect early-stage HCC and monitor disease progression in high-risk patients.
Methods
Study Participant Characteristics
Baseline patient characteristics for individuals enrolled in this study are compiled in Table 1. In total, we included samples from 30 CHB patients (mean age: 42; 76.7% male), 29 LC patients (mean age: 52; 68.7% male), and 30 HCC patients (mean age: 58; 86.7% male).
Sample Preparation
The serum samples from these patients were thawed on ice, and a 50% methanol solution was then used for metabolite extraction. Briefly, a 20 μL volume of each sample was then mixed with 120 μL of cold 50% methanol for 1 min, incubated for 10 min at room temperature for 10 min, and then allowed to rest overnight at −20 °C. The samples were then spun for 20 min at 4000g, and supernatants were isolated and stored at −80 °C in 96-well plates for LC-MS analyses. In addition, 10 μL from each extract was pooled to prepare a quality control (QC) solution.
LC-MS/MS Analysis
A DIONEX Ultimate 3000 HPLC system (Thermo Fisher Scientific) was used for LC-MS/MS metabolomic analyses. Briefly, 10 μL per sample was injected into a Synergi 4 μm Hydro-RP 80Å, 250 mm × 3.0 mm column (Phenomenex, Le Pecq, France). Mobile phases for this analysis included 0.1% formic acid in water (A) and 0.1% formic acid in acetonitrile (B). Gradient settings were as follows: 0–5 min, 0% B; 5–21 min, 0–95% B; 21–21.5 min, 95% B; 21.5–22 min, 95–0% B; and 22–25 min, 0% B. The flow rate was maintained at 0.9 mL/min. A Q Exactive Plus Orbitrap mass spectrometer (Thermo Scientific) with a heated electrospray ionization source (HESI II) was utilized in negative- and positive-ion modes for MS analyses. High-resolution accurate-mass full-scan MS and top 5 MS2 spectra were collected in a data-dependent acquisition mode at a respective resolving power of 70 000 and 35 000 at m/z 400. In addition, the QC samples were injected at the start of each run and as every 10th sample to ensure the stability of these MS analyses.
Metabolomic Profiling
MSConvert (v2.1, ProteoWizard) was used to convert raw data into the mzXML format,39 after which MZmine (v2.29) was used to separately analyze the data acquired in negative- and positive-ion modes.40 A noise threshold of 105 was used when constructing isolated chromatograms for each mass, after which validated peaks were selected using a local minimum search algorithm. A random sample consensus (RANSAC) algorithm was then used to align peaks with a 10 ppm m/z tolerance and a 1 min retention time tolerance. The missing values were replaced with those corresponding to those within the same m/z and RT ranges when possible, and only peaks lacking missing values after gap-filling were retained for subsequent analyses. The human metabolome database (HMDB, v3.0)41 was then used for peak identification, with a 15 ppm mass tolerance. We then individually verified the identities of selected metabolites with a VIP >3 based upon MS and MS2 spectra, with only identified metabolites being retained for downstream analyses. We then combined results from positive- and negative-ion modes and retained metabolites with higher intensity mean values.
Data Analysis
XCMS software was used for peak picking, peak grouping, retention time correction, second peak grouping, and isotope and adduct annotation. R XCMS, CAMERA, and metaX tools were used to process mzXML-formatted data files. Ions were identified based upon RT and m/z data, with peak intensities being recorded and used to generate a three-dimensional matrix that incorporated sample names, provided ion intensity information, and arbitrarily assigned peak indices (retention time–m/z pairs). These metabolites were then annotated using the KEGG and HMDB databases via exact matching of the sample m/z data to those in these databases. When mass differences between the observed and predicted values were <10 ppm, the metabolites were annotated and subjected to further validation based upon the isotopic distribution measurements. Metabolite identification was then validated using an in-house fragment spectrum metabolite library, and metaX was then used to further preprocess peak intensity data. Features that were present in <50% of the QC samples of <80% of the biological samples were not retained for analysis, while a k-nearest-neighbor algorithm was used to impute missing values for the remaining peaks to improve the overall data quality. Outliers and batch effects were next assessed via a PCA approach, while the QC data was fitted to QC-based robust LOESS signal correction based upon the order of injection in an effort to minimize any drift in the signal intensity values over time. Relative standard deviations for metabolites were also calculated for all QC samples, and any that had >30% standard deviation was removed. Differences in metabolite levels between two sample groups were compared using Student’s t tests, with P-values being adjusted using the Benjamini–Hochberg method to control for multiple testing. In addition, metaX was used for supervised PLS-DA to identify metabolites capable of discriminating between groups, with VIP values being determined. A VIP of ≥1.0 was used for important feature selection.
Acknowledgments
The study was supported by a grant from the National Science and Technology Major Project of the Ministry of Science and Technology of China (No. 2018ZX10302205-002). The authors state that there are no conflicts of interest to disclose.
Supporting Information Available
The Supporting Information is available free of charge at https://pubs.acs.org/doi/10.1021/acsomega.0c04259.
Identified metabolites classified into the top 20 KEGG pathways with HCC vs LC patients in the NEG model (Figure S1); identified metabolites classified into the top 20 KEGG pathways with HCC vs CHB patients in the POS model (a) and the NEG model (b) (Figure S2); identified metabolites classified into the top 20 KEGG pathways with LC vs CHB patients in the POS model (a) and the NEG model (b) (Figure 3S); correlation analysis between the levels of these different metabolites and the BMI levels (Figure S4); correlation analysis between the levels of these different metabolites and the age (Figure S5); and the four metabolites could offer better AUC for the three-way comparisons (HCC vs LC, LC vs CHB, HCC vs CHB) using a regression model (Figure S6) (PDF)
Ion intensity information and retention time of the metabolites (Table S1) (XLSX)
Different metabolites between three groups, HCC vs LC, HCC vs CHB, and LC (Table S2) (XLSX)
Author Contributions
∥ H.Y.P., Q.Q.W., and T.C.H. contributed equally to this work.
The authors declare no competing financial interest.
Supplementary Material
References
- Kassahun W. T.; Fangmann J.; Harms J.; Hauss J.; Bartels M. Liver resection and transplantation in the management of hepatocellular carcinoma: a review. Exp. Clin. Transplant. 2006, 4, 549–558. [PubMed] [Google Scholar]
- El-Serag H. B.; Rudolph K. L. Hepatocellular carcinoma: epidemiology and molecular carcinogenesis. Gastroenterology 2007, 132, 2557–2576. 10.1053/j.gastro.2007.04.061. [DOI] [PubMed] [Google Scholar]
- El-Serag H. B.; Mason A. C. Rising incidence of hepatocellular carcinoma in the United States. N. Engl. J. Med. 1999, 340, 745–750. 10.1056/NEJM199903113401001. [DOI] [PubMed] [Google Scholar]
- Anthony P. P. Hepatocellular carcinoma: an overview. Histopathology 2001, 39, 109–118. 10.1046/j.1365-2559.2001.01188.x. [DOI] [PubMed] [Google Scholar]
- Onodera H.; Ukai K.; Minami Y. Hepatocellular carcinoma cases with five-year survival and prognostic factors affecting the survival time. Tohoku J. Exp. Med. 1995, 176, 203–211. 10.1620/tjem.176.203. [DOI] [PubMed] [Google Scholar]
- Thein H. H.; Khoo E.; Campitelli M. A.; Zaheen A.; Yi Q.; De P.; Earle C. C. Trends in relative survival in patients with a diagnosis of hepatocellular carcinoma in Ontario: a population-based retrospective cohort study. CMAJ Open 2015, 3, E208–16. 10.9778/cmajo.20140118. [DOI] [PMC free article] [PubMed] [Google Scholar]
- Bittermann T.; Hoteit M. A.; Abt P. L.; Forde K. A.; Goldberg D. Waiting time and explant pathology in transplant recipients with hepatocellular carcinoma: a novel study using national data. Am. J. Transplant. 2014, 14, 1657–1663. 10.1111/ajt.12774. [DOI] [PubMed] [Google Scholar]
- Nicholson J. K.; Lindon J. C.; Holmes E. ’Metabonomics’: understanding the metabolic responses of living systems to pathophysiological stimuli via multivariate statistical analysis of biological NMR spectroscopic data. Xenobiotica 1999, 29, 1181–1189. 10.1080/004982599238047. [DOI] [PubMed] [Google Scholar]
- Fiehn O. Metabolomics--the link between genotypes and phenotypes. Plant Mol. Biol. 2002, 48, 155–171. 10.1023/A:1013713905833. [DOI] [PubMed] [Google Scholar]
- Xiao J. F.; Zhou B.; Ressom H. W. Metabolite identification and quantitation in LC-MS/MS-based metabolomics. TrAC, Trends Anal. Chem. 2012, 32, 1–14. 10.1016/j.trac.2011.08.009. [DOI] [PMC free article] [PubMed] [Google Scholar]
- Gika H.; Theodoridis G. Sample preparation prior to the LC-MS-based metabolomics/metabonomics of blood-derived samples. Bioanalysis 2011, 3, 1647–1661. 10.4155/bio.11.122. [DOI] [PubMed] [Google Scholar]
- Shariff M. I.; Ladep N. G.; Cox I. J.; Williams H. R.; Okeke E.; Malu A.; Thillainayagam A. V.; Crossey M. M.; Khan S. A.; Thomas H. C.; Taylor-Robinson S. D. Characterization of urinary biomarkers of hepatocellular carcinoma using magnetic resonance spectroscopy in a Nigerian population. J. Proteome Res. 2010, 9, 1096–1103. 10.1021/pr901058t. [DOI] [PubMed] [Google Scholar]
- Chen T.; Xie G.; Wang X.; Fan J.; Qiu Y.; Zheng X.; Qi X.; Cao Y.; Su M.; Wang X.; Xu L. X.; Yen Y.; Liu P.; Jia W. Serum and urine metabolite profiling reveals potential biomarkers of human hepatocellular carcinoma. Mol. Cell. Proteomics 2011, 10, M110.004945 10.1074/mcp.M110.004945. [DOI] [PMC free article] [PubMed] [Google Scholar]
- Correction: Trends in relative survival in patients with a diagnosis of hepatocellular carcinoma in Ontario: a population-based retrospective cohort study. CMAJ Open 2015, 3, E359. 10.9778/cmajo.20150109. [DOI] [PMC free article] [PubMed] [Google Scholar]
- Cao H.; Huang H.; Xu W.; Chen D.; Yu J.; Li J.; Li L. Fecal metabolome profiling of liver cirrhosis and hepatocellular carcinoma patients by ultra performance liquid chromatography-mass spectrometry. Anal. Chim. Acta 2011, 691, 68–75. 10.1016/j.aca.2011.02.038. [DOI] [PubMed] [Google Scholar]
- Patterson A. D.; Maurhofer O.; Beyoglu D.; Lanz C.; Krausz K. W.; Pabst T.; Gonzalez F. J.; Dufour J. F.; Idle J. R. Aberrant lipid metabolism in hepatocellular carcinoma revealed by plasma metabolomics and lipid profiling. Cancer Res. 2011, 71, 6590–6600. 10.1158/0008-5472.CAN-11-0885. [DOI] [PMC free article] [PubMed] [Google Scholar]
- Gao H.; Lu Q.; Liu X.; Cong H.; Zhao L.; Wang H.; Lin D. Application of 1H NMR-based metabonomics in the study of metabolic profiling of human hepatocellular carcinoma and liver cirrhosis. Cancer Sci. 2009, 100, 782–785. 10.1111/j.1349-7006.2009.01086.x. [DOI] [PMC free article] [PubMed] [Google Scholar]
- Zhu K.; Zhan H.; Peng Y.; Yang L.; Gao Q.; Jia H.; Dai Z.; Tang Z.; Fan J.; Zhou J. Plasma hsa_circ_0027089 is a diagnostic biomarker for hepatitis B virus-related hepatocellular carcinoma. Carcinogenesis 2020, 41, 296–302. 10.1093/carcin/bgz154. [DOI] [PMC free article] [PubMed] [Google Scholar]
- Rao B. C.; Lou J. M.; Wang W. J.; Li A.; Cui G. Y.; Yu Z. J.; Ren Z. G. Human microbiome is a diagnostic biomarker in hepatocellular carcinoma. Hepatobiliary Pancreatic Dis. Int. 2020, 19, 109–115. 10.1016/j.hbpd.2020.01.003. [DOI] [PubMed] [Google Scholar]
- Cho H. J.; Eun J. W.; Baek G. O.; Seo C. W.; Ahn H. R.; Kim S. S.; Cho S. W.; Cheong J. Y. Serum Exosomal MicroRNA, miR-10b-5p, as a Potential Diagnostic Biomarker for Early-Stage Hepatocellular Carcinoma. J. Clin. Med. 2020, 9, 281. 10.3390/jcm9010281. [DOI] [PMC free article] [PubMed] [Google Scholar]
- Manuel-Vázquez A.; Latorre-Fragua R.; Ramiro-Perez C.; Lopez-Marcano A.; la Plaza-Llamas R.; Ramia J. M. Laparoscopic gastrojejunostomy for gastric outlet obstruction in patients with unresectable hepatopancreatobiliary cancers: A personal series and systematic review of the literature. World J. Gastroenterol. 2018, 24, 1978–1988. 10.3748/wjg.v24.i18.1978. [DOI] [PMC free article] [PubMed] [Google Scholar]
- Sun L.; Beggs K.; Borude P.; Edwards G.; Bhushan B.; Walesky C.; Roy N.; Manley M. W. Jr.; Gunewardena S.; O’Neil M.; Li H.; Apte U. Bile acids promote diethylnitrosamine-induced hepatocellular carcinoma via increased inflammatory signaling. Am. J. Physiol.: Gastrointest. Liver Physiol. 2016, 311, G91–G104. 10.1152/ajpgi.00027.2015. [DOI] [PMC free article] [PubMed] [Google Scholar]
- Walesky C.; Edwards G.; Borude P.; Gunewardena S.; O’Neil M.; Yoo B.; Apte U. Hepatocyte nuclear factor 4 alpha deletion promotes diethylnitrosamine-induced hepatocellular carcinoma in rodents. Hepatology 2013, 57, 2480–2490. 10.1002/hep.26251. [DOI] [PMC free article] [PubMed] [Google Scholar]
- Jia B.; Jeon C. O. Promotion and induction of liver cancer by gut microbiome-mediated modulation of bile acids. PLoS Pathog. 2019, 15, e1007954 10.1371/journal.ppat.1007954. [DOI] [PMC free article] [PubMed] [Google Scholar]
- Yang J.; Zhao X.; Liu X.; Wang C.; Gao P.; Wang J.; Li L.; Gu J.; Yang S.; Xu G. High performance liquid chromatography-mass spectrometry for metabonomics: potential biomarkers for acute deterioration of liver function in chronic hepatitis B. J. Proteome Res. 2006, 5, 554–561. 10.1021/pr050364w. [DOI] [PubMed] [Google Scholar]
- Yin P.; Wan D.; Zhao C.; Chen J.; Zhao X.; Wang W.; Lu X.; Yang S.; Gu J.; Xu G. A metabonomic study of hepatitis B-induced liver cirrhosis and hepatocellular carcinoma by using RP-LC and HILIC coupled with mass spectrometry. Mol. BioSyst. 2009, 5, 868–876. 10.1039/b820224a. [DOI] [PubMed] [Google Scholar]
- Negishi M.; Irie A.; Nagata N.; Ichikawa A. Specific binding of glycyrrhetinic acid to the rat liver membrane. Biochim. Biophys. Acta, Biomembr. 1991, 1066, 77–82. 10.1016/0005-2736(91)90253-5. [DOI] [PubMed] [Google Scholar]
- Chen J.; Jiang H.; Wu Y.; Li Y.; Gao Y. A novel glycyrrhetinic acid-modified oxaliplatin liposome for liver-targeting and in vitro/vivo evaluation. Drug Des., Dev. Ther. 2015, 9, 2265–2275. 10.2147/DDDT.S81722. [DOI] [PMC free article] [PubMed] [Google Scholar] [Retracted]
- Li J. Y.; Cao H. Y.; Liu P.; Cheng G. H.; Sun M. Y. Glycyrrhizic acid in the treatment of liver diseases: literature review. BioMed Res. Int. 2014, 2014, 872139 10.1155/2014/872139. [DOI] [PMC free article] [PubMed] [Google Scholar]
- Yamaguchi H.; Yu T.; Kidachi Y.; Akitaya T.; Yoshida K.; Kamiie K.; Noshita T.; Umetsu H.; Ryoyama K. Selective toxicity of glycyrrhetinic acid against tumorigenic r/m HM-SFME-1 cells is potentially attributed to downregulation of glutathione. Biochimie 2011, 93, 1172–1178. 10.1016/j.biochi.2011.04.011. [DOI] [PubMed] [Google Scholar]
- Darvishi B.; Manoochehri S.; Esfandyari-Manesh M.; Samadi N.; Amini M.; Atyabi F.; Dinarvand R. Enhanced Cellular Cytotoxicity and Antibacterial Activity of 18-beta-Glycyrrhetinic Acid by Albumin-conjugated PLGA Nanoparticles. Drug Res. 2015, 65, 617–623. 10.1055/s-0034-1390487. [DOI] [PubMed] [Google Scholar]
- Tian J.; Wang L.; Wang L.; Ke X. A wogonin-loaded glycyrrhetinic acid-modified liposome for hepatic targeting with anti-tumor effects. Drug Delivery 2014, 21, 553–559. 10.3109/10717544.2013.853850. [DOI] [PubMed] [Google Scholar]
- Matsuo K.; Takenaka K.; Shimomura H.; Fujii N.; Shinagawa K.; Kiura K.; Harada M. Lamivudine and glycyrrhizin for treatment of chemotherapy-induced hepatitis B virus (HBV) hepatitis in a chronic HBV carrier with non-Hodgkin lymphoma. Leuk. Lymphoma 2001, 41, 191–195. 10.3109/10428190109057970. [DOI] [PubMed] [Google Scholar]
- Calder P. C. Omega-3 polyunsaturated fatty acids and inflammatory processes: nutrition or pharmacology?. Br. J. Clin. Pharmacol. 2013, 75, 645–662. 10.1111/j.1365-2125.2012.04374.x. [DOI] [PMC free article] [PubMed] [Google Scholar]
- Inoue-Yamauchi A.; Itagaki H.; Oda H. Eicosapentaenoic acid attenuates obesity-related hepatocellular carcinogenesis. Carcinogenesis 2018, 39, 28–35. 10.1093/carcin/bgx112. [DOI] [PMC free article] [PubMed] [Google Scholar]
- Lu Y.; Fang J.; Zou L.; Cui L.; Liang X.; Lim S. G.; Dan Y. Y.; Ong C. N. Omega-6-derived oxylipin changes in serum of patients with hepatitis B virus-related liver diseases. Metabolomics 2018, 14, 26 10.1007/s11306-018-1326-z. [DOI] [PubMed] [Google Scholar]
- Kim D. J.; Cho E. J.; Yu K. S.; Jang I. J.; Yoon J. H.; Park T.; Cho J. Y. Comprehensive Metabolomic Search for Biomarkers to Differentiate Early Stage Hepatocellular Carcinoma from Cirrhosis. Cancers 2019, 11, 1497. 10.3390/cancers11101497. [DOI] [PMC free article] [PubMed] [Google Scholar]
- Xie J.; Zhang A.; Wang X. Metabolomic applications in hepatocellular carcinoma: toward the exploration of therapeutics and diagnosis through small molecules. RSC Adv. 2017, 7, 17217–17226. 10.1039/c7ra00698e. [DOI] [Google Scholar]
- Holman J. D.; Tabb D. L.; Mallick P. Employing ProteoWizard to Convert Raw Mass Spectrometry Data. Curr. Protoc. Bioinf. 2014, 46, 241–9. 10.1002/0471250953.bi1324s46. [DOI] [PMC free article] [PubMed] [Google Scholar]
- Pluskal T.; Castillo S.; Villar-Briones A.; Oresic M. MZmine 2: modular framework for processing, visualizing, and analyzing mass spectrometry-based molecular profile data. BMC Bioinf. 2010, 11, 395 10.1186/1471-2105-11-395. [DOI] [PMC free article] [PubMed] [Google Scholar]
- Wishart D. S.; Feunang Y. D.; Marcu A.; Guo A. C.; Liang K.; Vazquez-Fresno R.; Sajed T.; Johnson D.; Li C.; Karu N.; Sayeeda Z.; Lo E.; Assempour N.; Berjanskii M.; Singhal S.; Arndt D.; Liang Y.; Badran H.; Grant J.; Serra-Cayuela A.; Liu Y.; Mandal R.; Neveu V.; Pon A.; Knox C.; Wilson M.; Manach C.; Scalbert A. HMDB 4.0: the human metabolome database for 2018. Nucleic Acids Res. 2018, 46, D608–D617. 10.1093/nar/gkx1089. [DOI] [PMC free article] [PubMed] [Google Scholar]
Associated Data
This section collects any data citations, data availability statements, or supplementary materials included in this article.


