Abstract
Purpose
To evaluate vinorelbine drug exposure and activity in brain metastases of the human MDA-MB-231BR breast cancer model using integrated imaging and analysis.
Methods
Brain and systemic metastases were created by administration of cancer cells in female NuNu mice. After metastases developed, animals were administered vinorelbine at the maximal tolerated dose (12 mg/kg), and were evaluated thereafter for total and unbound drug pharmacokinetics, biomarker TUNEL staining, and barrier permeability to Texas red.
Results
Median brain metastasis drug exposure was 4-fold greater than normal brain, yet only ~8% of non-barrier systemic metastases, which suggests restricted brain exposure. Unbound vinorelbine tissue/plasma partition coefficient, Kp,uu, equaled ~1.0 in systemic metastases, but 0.03–0.22 in brain metastases, documenting restricted equilibration. In select sub-regions of highest drug-uptake brain metastases, Kp,uu approached 1.0, indicating complete focal barrier breakdown. Most vinorelbine-treated brain metastases exhibited little or no positive early apoptosis TUNEL staining in vivo. The in vivo unbound vinorelbine IC50 for TUNEL-positive staining (56 nM) was 4-fold higher than that measured in vitro (14 nM). Consistent with this finding, P-glycoprotein expression was observed to be substantially upregulated in brain metastasis cells in vivo.
Conclusions
Vinorelbine exposure at maximum tolerated dose was less than one-tenth that in systemic metastases in >70% of brain metastases, and was associated with negligible biomarker effect. In small subregions of the highest uptake brain metastases, compromise of blood-tumor barrier appeared complete. The results suggest that restricted delivery accounts for 80% of the compromise in drug efficacy for vinorelbine against this model.
Keywords: blood–brain barrier, brain metastases, breast cancer, permeability, vinorelbine
INTRODUCTION
Brain metastases are a dreaded form of cancer for which there is no effective long-term therapy. They represent the most common type of CNS neoplasms, outnumbering primary brain tumors by >10 fold, and are formed most commonly in specific cancers, of which breast cancer is one of the most important (1). Prognosis for brain metastases depends on breast cancer subtype, number of brain lesions, status of systemic metastases and other factors, and ranges from less than a year for triple-negative disease, to two years in HER2+ cases (2). Current treatment is mostly palliative, consisting primarly of local therapy (stereotactic radiosurgery, whole brain radiation therapy, surgery) and steroids (3). Drug therapy with cytostatic and molecularly-targeted agents is the mainstay of systemic breast cancer treatment (4). For brain metastases, however, it generally provides limited benefit and is only recommended under specific circumstances (5).
Multiple reasons have been put forward to explain the failure of chemotherapy against brain metastases. Brain metastases acquire a distinct set of mutations that can affect drug sensitivity (6). The microenvironment may also play a role: astrocytes, which surround and infiltrate metastatic lesions, may create a cytoprotective microenvironment for tumor cells by sequestering calcium, inducing tumor cell survival genes, modulating the environment, and stimulating tumor cell proliferation with a cocktail of peptides and inflammatory cytokines that support development of a metastatic niche (7). Suboptimal drug delivery has also been raised as a factor. The blood vessels of the central nervous system (CNS), the blood–brain barrier (BBB), uniquely exhibit minimal paracellular diffusion and vesicular traffic, and express very high levels of active efflux transporters, such as P-glycoprotein (P-gp), which use metabolic energy to remove drugs from brain (8). The BBB is partially compromised in brain metastases, forming the blood-tumor barrier (BTB). The composition and permeability of the BTB are poorly understood, but may represent a molecular target to improve drug efficacy.
The contribution of the BTB to brain metastasis permeability has been debated. Brain metastases are diagnosed in large part based upon their vascular leakiness to imaging agents (9), inferring permeability; however, experimental imaging modalities with greater sensitivity now detect additional non-gadolinium-enhancing lesions (10,11). The enhanced permeability of the BTB has been argued to allow sufficient delivery of therapeutic agents for their pharmacological action (5,12,13). However, the extent of this delivery is uncertain (14). We have established that brain metastasis exposure to critical drugs, such as lapatinib, paclitaxel, and doxorubicin, is heterogeneous and overall lower than that of systemic metastases (15–17). Data from a human presurgical study for capecitabine and lapatinib confirm heterogeneous drug exposure (18). However, the extent and impact of delivery have been more difficult to interpret given lack of knowledge regarding the level of drug necessary for activity in brain metastases (i.e., in vivo IC50) and the level of drug which represents free equilibration.
To better understand the BTB and its impact on in vivo brain metastasis drug exposure and action, we performed a combined pharmacokinetic (PK)/pharmacodynamic (PD) study on vinorelbine, a widely used 3rd generation synthetic vinca alkaloid cytostatic agent. Vinorelbine has the advantages that it can be administered orally and shows improved therapeutic index with reduced sensorimotor toxicity relative to other anti-tubulin agents, including taxanes (19). Clinical trials have demonstrated that vinorelbine is effective as a single agent and has positive outcomes when combined with specific other agents in adjuvant, front-line, or salvage therapy of metastatic breast cancer (20,21). Its activity against brain metastases of breast cancer as monotherapy or in combinations has received less attention (22,23).
In this work, we examined the distribution of vinorelbine in brain and systemic metastases of the triple negative MDA-MB-231BR breast cancer metastasis model. Vinorelbine exposure was imaged within and between tumors using quantitative autoradiography validated as to chemical species using HPLC & LC-MS/MS. Drug equilibration was assessed from the partition coefficient for unbound drug distribution (Kp,uu), which was applied across brain metastases. Matching in vivo TUNEL staining was used as a biomarker of early apoptosis, and contrasted with exposure and efficacy obtained in matching experiments in cell culture in vitro. Together, the results provide a framework in which to assess therapeutic drug delivery and efficacy in brain metastases. The results suggest that restricted delivery accounts for 80% of the deficiency in vinorelbine action against MDA-MB-231BR brain metastases. Preliminary results of this study have been presented in abstract form (24).
MATERIALS AND METHODS
Chemicals
3H-Vinorelbine (10.2 Ci/mmol; 3H label on the aromatic ring) was obtained from Vitrax (Placentia, CA) and was confirmed as > 99% pure by reversed phase HPLC prior to use. Sulforhodamine 101 (Texas red) and Click-iT® TUNEL Alexa Flour 647 Imaging Assay were obtained from Invitrogen (Carlsbad, CA). D-luciferin was purchased from Caliper Life Sciences (Mountain View, CA). All other chemicals were from Sigma (St. Louis, MO).
Cell Lines
The human MDA-MB-231BR brain seeking metastatic breast cancer cell line was previously described (16,25). The cell line was transfected with luciferase and maintained at 37°C in 5% CO2-95% air ambience in DMEM containing 10% FBS.
Mouse Model of Breast Cancer Brain Metastases
Immune-compromised female NuNu mice (7–8 weeks) were obtained from Charles River Laboratories (New York, NY). Institutional Animal Care and Use Committee of Texas Tech University Health Sciences Center and Animal Care and Use Review Office of the United States Army Medical Research and Materiel Command reviewed and approved all animal procedures.
Brain and systemic metastases of human breast cancer were created as previously described (16,17). Mice received 1.75 × 10⁵ MDA-MB-231BR cells in 100 μL of serum-free media via left ventricular intracardiac injection. Some animals also received subcutaneous administration of tumor cells in the flank (2 × 10⁶ cells in 100 μL of 1:1 serum-free media:extracellular matrix) to develop subcutaneous tumors. Cancer cell disposition and growth were monitored using an IVIS XR in vivo optical imaging system (Caliper Life Sciences, Inc.). Mice received 120 mg/kg D-luciferin i.p. in sterile phosphate buffered saline 10 min before imaging. Bioluminescence imaging was performed on days 1 and 3, and once every week thereafter.
Vinorelbine Administration and Tissue Distribution Studies
Brain and systemic metastases were allowed to develop until the animal started to exhibit neurologic effects such as hunched posture, lethargic gait and weight loss. At that point (days 28–33), mice were administered Navelbine (vinorelbine) containing 200 μCi of 3H-vinorelbine at the maximum tolerated dose (12 mg/kg) into the femoral vein in 100 μL of 0.9% normal saline (26). Drug was allowed to circulate for 0.5, 2 or 8 h. Ten minutes prior to the end of exposure period, 150 μg Texas red (in 100 μL) was administered intravenously as a marker of barrier permeability. At the end of the circulation period, the animal was anesthetized with ketamine and xylazine (i.p. 100 and 10 mg/kg, respectively) and cardiac puncture was performed to obtain a fresh blood sample which was processed immediately. Blood was collected in heparinized tubes and centrifuged at 8000g for 8 min to obtain plasma. Blood and plasma samples were dried in order to remove any possible volatile tracer species (27).
At the same time that blood was being processed, residual blood was removed from the brain vasculature by normal pressure left ventricular cardiac perfusion for 60 s with physiologic buffered saline (37°C) containing 2.7% albumin. At the end of perfusion, whole brain and tissues with systemic metastases were quickly removed and flash frozen in cold isopentane (−65°C) for 20 seconds. Samples of various organs were also collected, cleaned and weighed. Vinorelbine integrity in tissues was assessed using HPLC and LC-MS/MS, as described in the Supplementary Material.
Tumor-containing, frozen tissue specimens were cut into 20 μm-thick sections at −20°C using a cryostat (Leica CM3050S), thaw-mounted onto glass microscope slides and stored at −80°C. Matching tissue and plasma specimens were collected and prepared for HPLC analysis with UV/visible + flow scintillation spectroscopy (see Supplementary Material) for detection. Specimens were also processed for liquid scintillation counting, as previously described (16). LC-MS/MS was performed on a parallel set of radiotracer-free animals for detection and analysis of metabolites (see Supplementary Material).
Brain Section Analyses
Mouse coronal tissue sections (20 μm thick) were analyzed for BBB/BTB permeability, drug concentration, and biomarker activity using a series of linked imaging methods (16,17). First, bright field light microscopy was used on cresyl violet-stained sections to map the location and size of metastases based upon their large nuclear structure, which was confirmed as needed with antihuman cytokeratin staining. Each metastasis was scanned in three dimensions using serial tissue sections to confirm the metastasis as an independent unit (i.e., separated by >100 μm). This information was then imported and applied against fluorescence images of tumor sections to spatially quantify barrier permeability-surface area product (henceforth, termed “permeability”) from Texas red distribution. Tritium-sensitive phosphor screens were exposed for 30 days to sections as well as matching 3H autoradiography standards. The resulting quantitative images were measured using a Fuji phosphoimager system and processed using MCID software (Imaging Research) to obtain color-coded drug concentrations (nM or μM) and Slidebook for barrier permeability quantitation. More detailed descriptions of these methods and procedures are provided in the Supplementary Material.
TUNEL staining, to visualize and quantify early apoptosis, of in vivo brain sections of mice exposed to vinorelbine for 2 h, was performed using Click-iT® TUNEL Alexa Fluor® imaging assay (Invitrogen), per the manufacturer’s directions, and was compared to in vitro apoptotic activity after 2 h of incubation in cells grown on cover glass. Details of these procedures and those used for immunofluorescence staining for localization of ABCB1 and CD31 are described in the Supplementary Material.
Frozen Brain Slice Binding Method
Vinorelbine unbound fraction (fu) measurements were made on a second brain section slide, adjacent to the slide used for drug uptake measurements. A hydrophobic well was drawn around the brain sections, using a Liquid Blocker Super Pap Pen (Daido Sangyo Co. Ltd). Sections then were incubated at 37°C for 45 minutes with PBS containing 1 μCi/ml of 3H-vinorelbine. The incubation process was performed in a humidified chamber in order to avoid evaporation of the PBS. At the end of the incubation period, PBS was collected and slides were washed with cold PBS. The 3H-vinorelbine concentration in the collected PBS is called the “in vitro unbound drug concentration”. Slides were allowed to dry at room temperature, placed in cassettes along with tissue calibrated standards for QAR analysis. Total in vitro concentration in the brain slice was calculated using the MCID software by interpolating the measured radioactivity from the radioactive standards co-exposed with brain sections. The ratio of unbound drug concentration in buffer to total in vitro concentration in the brain section, calculated with MCID, provides the in vitro unbound fraction (fu) of drug in brain and brain metastases. The MCID transformation function was used to multiply the in vivo total drug concentration in each pixel with the corresponding pixel in vitro fu from the adjacent section to obtain a color-coded, digital image with location-specific in vivo unbound drug concentration. Similarly, the product of the images of in vivo total drug concentration with (1- in vitro fu) provided an image of the bound vinorelbine concentration. The steps in this process are illustrated in Fig. 1.
Fig. 1.
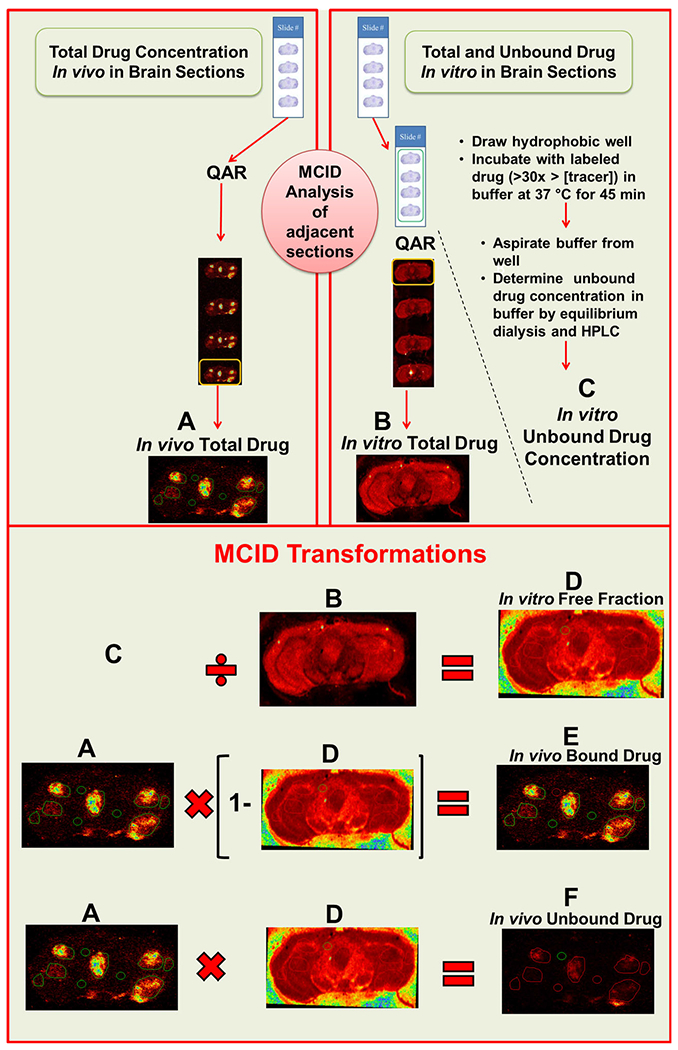
Schematic of brain slice binding method for the determination of in vivo free drug concentration. A In vivo total drug concentration was quantified using QAR in one slide containing 20 μm brain slices. The adjacent slide was incubated with higher concentration of radiotracer at 37°C for 45 minutes and at the end of incubation, in vitro unbound drug concentration (C) was estimated using equilibrium dialysis. Following rinsing and drying, the radioactivity in the first section (adjacent to the last section of previous slide) was quantified using QAR, to obtain the in vitro total drug concentration (B). Using the MCID transform function, in vitro free fraction (D) was calculated as C/D. An image of in vivo bound drug (E) was obtained by A × (1 -B). Similarly, in vivo unbound drug (F) was estimated from A × D.
Equilibrium Dialysis
Equilibrium dialysis was used to measure vinorelbine fu in plasma and tissue homogenate. Plasma or homogenized brain tissues were spiked with 3H-vinorelbine to achieve a final concentration of 2 μCi/mL and dialyzed against an equal volume of 100 mM phosphate buffer, as described in the Supplementary Material. fu was obtained as the equilibrium ratio of drug concentration in receiver and donor chambers. Since brain samples were homogenized with phosphate buffer, the unbound (free) fraction obtained for diluted homogenate was corrected for dilution using equation 1,
| (1) |
where fu is the unbound fraction, D is dilution factor (w/v), and fu/hd is the unbound fraction of diluted homogenate (28).
Pharmacokinetic Calculations and Statistical Analysis
The steady state tissue partition coefficient (Kp) for vinorelbine distribution was calculated from the ratio of integrated total drug concentration in tissue (AUCtot, tissue) to that in plasma (AUCtot,plasma). The matching partition coefficient for unbound vinorelbine distribution (Kp,uu) was calculated as the ratio of integrated unbound drug concentration in tissue (AUCu,tissue) to that in plasma (AUCu,plasma) (29). In vivo unbound concentration was calculated as Cu = fu x Ctot assuming rapid binding equilibration. Kp,uu was calculated as Kp x (fu,brain/fu, plasma). The barrier-free distribution coefficient Kp, tissue − no barrier was estimated as fu,plasma/fu,tissue assuming Kp,uu =1. Descriptive and comparative statistics, area-under-the-curve integration, and best fit modeling were performed using GraphPad Prism 6.07 (GraphPad Software, La Jolla CA. In general, summary values are mean ± SD for plasma, blood and normal tissues, and median ± quartiles for brain and systemic tumors. SDs for some parameters were estimated by propagation of error.
RESULTS
Bioluminescent Imaging of Metastasis Growth
Brain showed significant enrichment of bioluminescent signal within 1 h of intracardiac administration of the brain-tropic breast cancer cell line MDA-MB-231BR (Fig. 2). Over the next 3 days, the bioluminescent signal declined to nearly undetectable levels, and then re-emerged by days 18–22 growing predominently in brain and, in a subset of animals, in bone and soft tissues, such as lung, liver or kidney. Animals with significant brain signal were utilized for drug studies when they started to exhibit neurological changes from tumor growth (≥27 days).
Fig. 2.
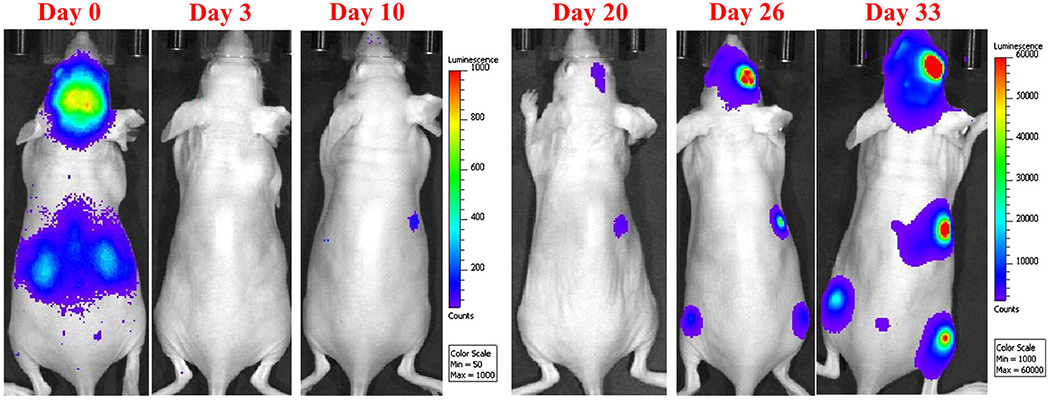
Metastatic tumor growth after intracardiac injection was confirmed and monitored with in vivo optical imaging. Bioluminescence data were acquired under isoflurane anesthesia with an IVIS XR in vivo optical imaging system. A gradual decrease of bioluminescence signal from day 0–3 confirms that most of disseminated cancer cells die or are eliminated from the body. The gradual increase in the bioluminescence signal in the brain and other locations reflects the metastatic pattern and potential of MDA-MB-231BR cancer cells (day 20 to day 33). Images are of the same mouse followed over time.
Barrier Permeability and Drug Distribution Within Brain Metastases
Vinorelbine pharmacokinetics and barrier permeability were assessed simultaneously in MDA-MB-231BR tumor-bearing mice. HPLC and LC-MS/MS demonstrated that, from 0.5 to 8 h, circulating drug was principally intact vinorebine, with only a single metabolite, deacetylvinorelbine, which represented 5–17% of vinca species in most tissues and fluids (Fig. S2 in Supplementary Material). As deacetylvinorelbine is active, with tubulin binding and cytotoxicity comparable to vinorelbine (30–32), drug concentration was expressed as total vinorelbine species (i.e., vinorelbine and deacetylvinorelbine).
Metastasis vinorelbine concentration varied >30 fold between brain metastases at each time point. Figure 3 shows representative brain tissue sections from three animals. Metastases differed in size and location. Most (85%) had vinorelbine concentrations that exceeded normal brain (P < 0.05) with a median increase of ~4 fold. A small subset (8%) had very high levels (10–30 fold) and 15% had low values that did not differ from normal brain (Fig. 4a). The pattern did not follow a normal distribution (P < 0.0001). Median brain metastasis vinorelbine (1.6 μM), though 4-fold greater than normal brain, was still only 8% of that of matching systemic metastasis concentrations (20–26 μM) (Fig. 4b). Subcutaneous tumors had vinorelbine concentrations 2-fold lower (12 ± 0.9 μM at 2 h) than systemic metastases. BTB permeability varied heterogeneously and also did not follow a normal distribution (Fig. 4c). The change in brain metastasis vinorelbine concentration correlated significantly with BTB permeability (Fig. 4d, R2 = 0.640, P < 0.0001, N = 132). Brain had the lowest concentration of all tissues measured, and matched well those previously reported by HPLC (26). Vinorelbine concentrations for other tissues are listed in Table I.
Fig. 3.
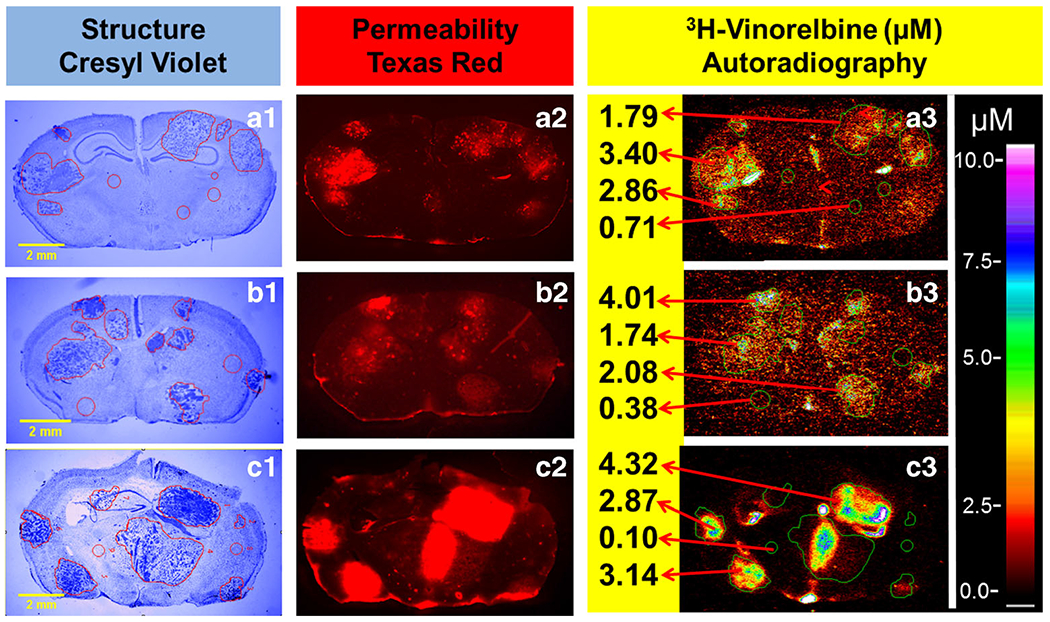
Experimental brain metastases exhibit heterogeneous permeability and uptake of vinorelbine. Representative coronal brain section images at 0.5–8 h following i.v. administration of 3H-vinorelbine. (a1-c1) MDA-MB231BR brain metastasis localization and identification based on cresyl violet staining, yellow scale bar represents 2 mm. (a2-c2) Texas red fluorescence shows heterogeneous distribution and was used as marker of passive permeability in uninvolved brain and metastases. (a3-c3) Heterogeneous distribution of 3H-vinorelbine in brain metastases by QAR. Images across a row are of the same brain section.
Fig. 4.
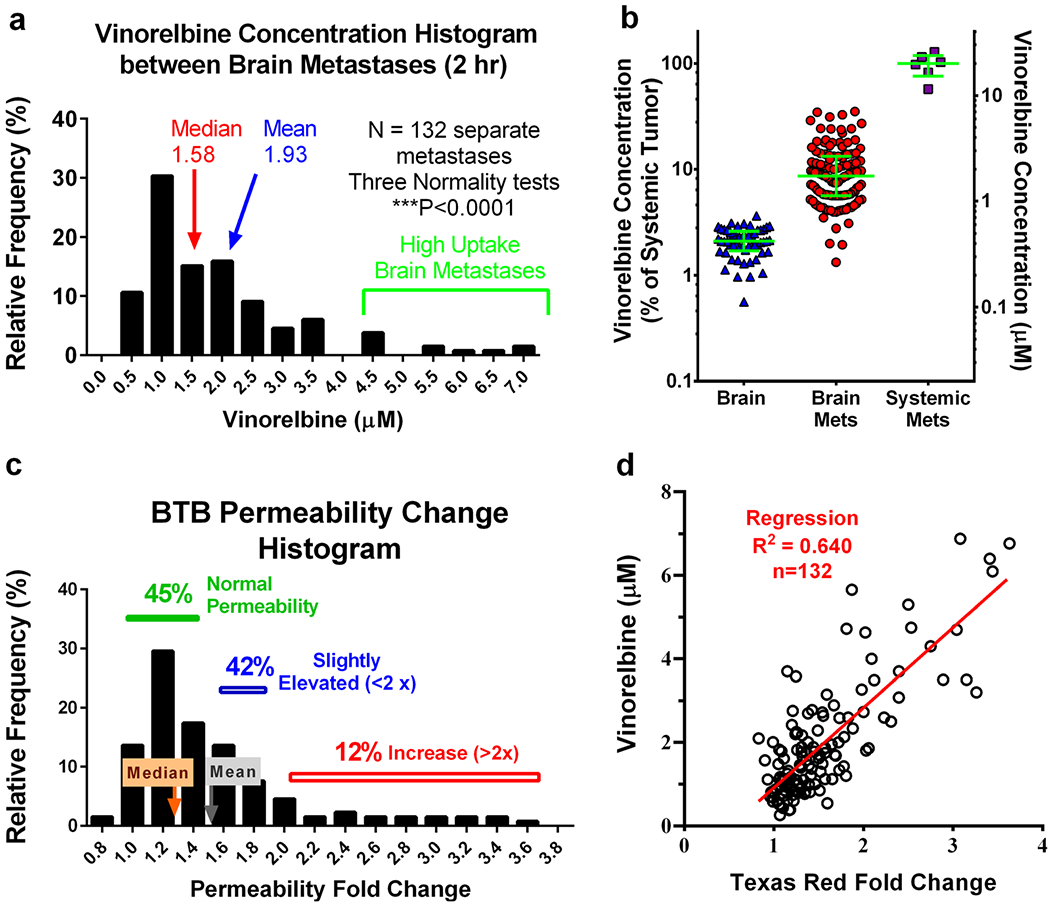
3H-vinorelbine distribution between metastases is non-Gaussian and correlates with passive permeability. Mice bearing MDA-MB-231BR brain metastases were administered 3H-vinorelbine (12 mg/kg, i.v.) and evaluated 2 h post injection. a Histogram of 3H-vinorelbine concentrations in brain metastases, exhibiting a tail toward higher concentrations. b Under the same experimental conditions, 3H-vinorelbine concentrations in brain, brain metastases and systemic metastases, expressed as a percent of median systemic metastasis concentration (left axis) and as concentration (right axis) with median and quartiles shown by green lines. c Non-Gaussian distribution of metastasis permeability, as measured with Texas red fluorescence, expressed as fold increase in fluorescence from uninvolved brain. d Vinorelbine concentration vs. fold increase in Texas red dye. Pearson correlation is shown as a red line and was statistically significant (P < 0.001).
Table I.
Plasma, Blood, and Tissue Concentrations at 0.5, 2 and 8 hr After i.v Administration of 12 mg/kg Vinorelbine
| Sample | Vinorelbine concentration (μM) |
||
|---|---|---|---|
| 0.5 hours | 2 hours | 8 hours | |
| Plasma | 4.2 ± 1.3 | 1.6 ± 0.1 | 0.11 ± 0.006 |
| Blood | 4.8 ± 0.9 | 1.9 ± 0.5 | 0.11 ± 0.03 |
| Brain | 0.92 ± 0.15 | 0.41 ± 0.02 | 0.17 ± 0.03 |
| Heart | 23.4 ± 7 | 27 ± 1.9 | 12 ± 5 |
| Lung | 23 ± 3.4 | 25.5 ± 16.2 | 5.6 ± 1.3 |
| Liver | 59.2 ± 15.2 | 59.3 ± 14.4 | 32.3 ± 7 |
| Kidney | 74 ± 24.5 | 42 ± 4.3 | 24.5 ± 8 |
| Spleen | 18 ± 3.2 | 24 ± 3.6 | 13.5 ± 5 |
| Abdominal Fat | 21 ± 2.6 | 34.6 ± 9.4 | 13.5 ± 9.6 |
| Large Intestine | 7.2 ± 2.9 | 11.8 ± 1.7 | 5.3 ± 2.8 |
| Small Intestine | 28.5 ± 12.2 | 16.7 ± 9.4 | 9.62 ± 4.7 |
| Muscle | 5.2 ± 2.5 | 5.8 ± 0.5 | 2.4 ± 0.5 |
| Bone | 3.3 ± 0.8 | 4.7 ± 0.6 | 2.1 ± 1.1 |
| Brain Metastases | 1.8 (0.73–6.5) | 1.7 (0.26–6.9) | 0.52 (0.14–5.8) |
| Systemic Metastases | 28 (17–29) | 18.7 (5–32) | |
Values represent mean ± SD (n = 3), except for metastases, where the median and range are presented
Drug distribution imaging revealed that vinorelbine distribution also varied markedly within brain metastases (Fig. 5). Vinorelbine concentration across metastases ranged >80 fold from 0.2 to 40 μM. Vinorelbine concentration fell quickly away along the edge of the brain metastasis, approaching baseline values within ~300 μm (Fig. 5d). This band did not appear to extend further at 2 or 8 h than at 0.5 h (Fig. 5d), suggesting limited diffusion into surrounding brain tissue. No evidence was obtained for a “brain-adjacent-to tumor” zone with elevated BTB permeability and drug concentration outside the narrow 300 μm band which surrounded each metastasis. Sites of perceived elevated drug concentration outside of brain metastases correlated with nonbarrier regions (e.g., choroid plexuses) or tissue processing artifacts, (e.g., areas of tissue folding or damage).
Fig. 5.
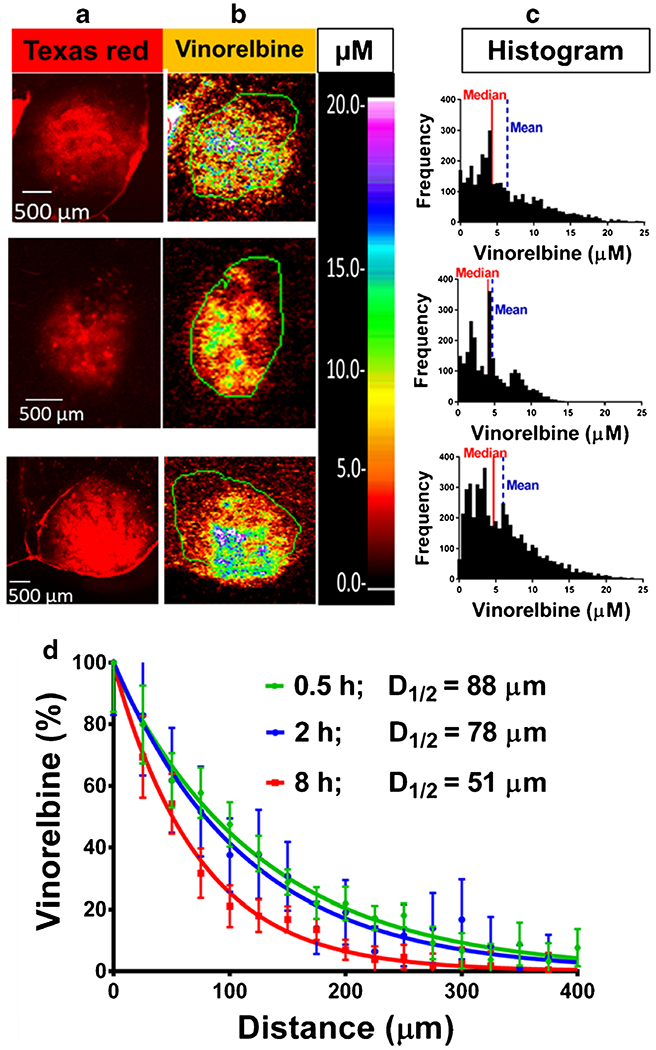
Heterogeneous vinorelbine distribution within brain metastases and concentration in brain adjacent to tumor (BAT). Three representative high (≥ 10 × brain) 3H-vinorelbine-uptake MDA-MB-231BR metastases showing heterogeneous internal vinorelbine distribution. Images across a row are of the same metastasis. a Texas red fluorescence for permeability analysis, scale bar = 500 μm. b QAR images with concentration scale set to the same maximum, as indicated by μM scale bar. c Frequency distributions of 3H-vinorelbine concentration with medians (red line) and means (blue dashed line). d Analysis of vinorelbine concentration from tumor edge to brain, expressed as % of average concentration at tumor edge (0 mm) in n = 13–15 regions of leaky tumors for each time point. Each time point is normalized to the calculated plateau of the curve.
Comparison of Integrated Vinorelbine Exposure Between Brain and Systemic Metastases
Vinorelbine concentrations were plotted against time and integrated to obtain apparent Kp values. Highest vinorelbine concentrations were observed in critical core organs, including liver, kidney, lung, and spleen, (Table I, Fig. 6a) and in nonbarrier brain regions as well as systemic tumors (Fig. 6b). Vinorelbine Kp ranged from 2.7–40 in systemic tissues and equaled 15.7 and 13.5, respectively, in non-BBB brain regions and in peripheral soft tissue metastases, such as those found in or near the kidney and in other regions. In contrast, median brain metastasis vinorelbine Kp was 4.6 to 36-fold lower than that of systemic metastases among the three subgroups of brain metastasis uptake. Normal brain had the lowest Kp (0.28), 52-fold lower than that of systemic metastases (Fig. 6c and Table II). The difference in vinorelbine Kp from brain metastases to systemic metastases attests to the deficiency of drug exposure to CNS metastases.
Fig. 6.
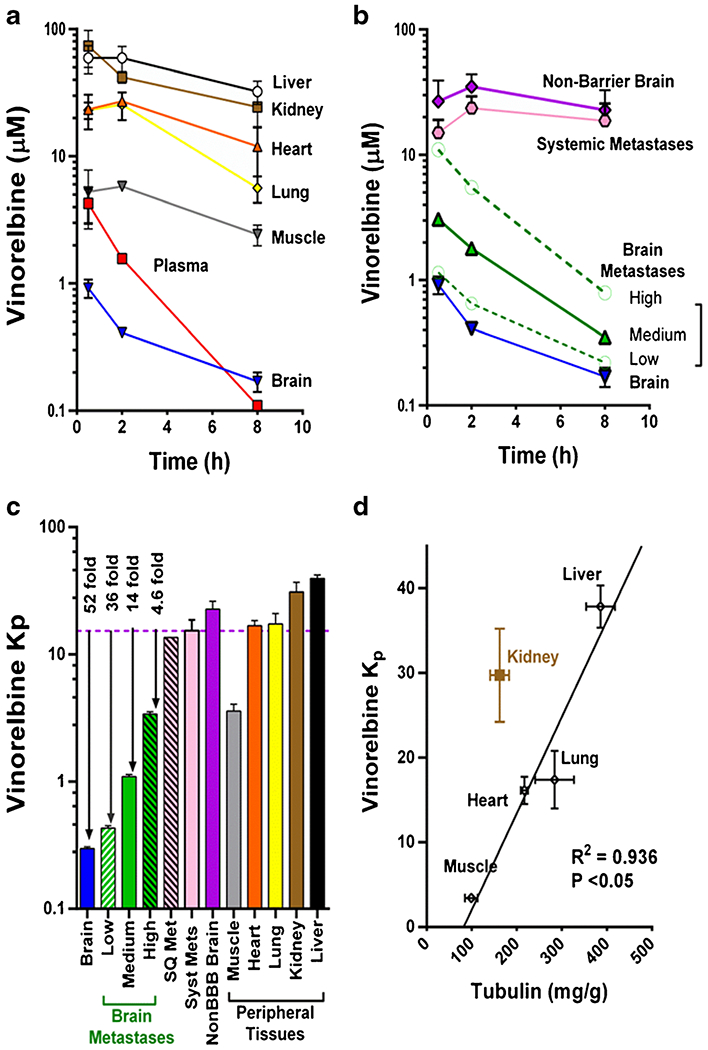
Pharmacokinetics of 3H-vinorelbine distribution to peripheral tissues, brain and brain metastases. a-b Pharmacokinetics of 3H-vinorelbine in various organs over 8 h following i.v. administration of vinorelbine to MDA-MB-231BR tumor-bearing mice. a Data represent mean ± SD for n = 3 animals per time point. b Brain metastases are divided into 3 groups based on uptake compared to uninvolved brain: low < (brain + 3 × SD), medium ≤ 10 × brain, high ≥ 10 × brain, to show pharmacokinetics within the groups. c Vinorelbine partition coefficient in various tissues showing greatly reduced distribution into brain metastases compared to peripheral tissues and non-barrier brain. d Projected Kp based on tubulin content in different tissues. Tubulin concentrations were obtained from Table I of Wierzba, K., et al. (33), line represents least squares fit to data.
Table II.
Integrated Vinorelbine Exposure (AUC, μmol.h.Kg−1) as Calculated by Trapezoidal Method
| Sample | AUC (μmol.h.Kg−1) | Kp |
|---|---|---|
| Liver | 364 ± 24 | 39.5 ± 2.6 |
| Kidney | 286 ± 53 | 31.0 ± 5.7 |
| Fat | 186 ± 16 | 20.2 ± 1.8 |
| Heart | 155 ± 15 | 16.8 ± 1.7 |
| Lung | 130 ± 58 | 14.1 ± 6.3 |
| Muscle | 33 ± 4 | 3.6 ± 0.5 |
| Bone | 26 ± 5 | 2.9 ± 0.6 |
| Systemic Mets | 126 ± 30 | 13.5 ± 3.1 |
| Non-Barrier Brain | 129 ± 17 | 13.7 ± 1.9 |
| High Brain Mets | 31 ± 4 | 3.9 ± 0.4 |
| Medium Brain Mets | 10 ± 4 | 1.1 ± 0.04 |
| Low Brain Mets | 3.9 ± 0.5 | 0.42 ± 0.05 |
| Brain | 2.7 ± 0.2 | 0.28 ± 0.02 |
| Blood | 12 ± 1 | |
| Plasma | 9.4 ± 0.4 | |
| Blood | 12 ± 1 | |
| Plasma | 9.4 ± 0.4 |
Data represents mean ± SD (n = 3)
Vinorelbine, as a lipophilic tubulin-targeting agent (cLogP of 4.07) (33), would be predicted to show substantial nonselective tissue binding (>90%) (34), as well as tissue-selective binding based upon tubulin expression (35). Figure 6d shows a significant relation between vinorelbine Kp and tissue tubulin concentration (R2 = 0.936) among systemic tissues. Brain, which expresses significant tubulin, falls well off the graph, as would be expected due to the presence of the BBB. The results emphasize the importance of tissue type on vinorelbine distribution and equilibration.
Unbound Vinorelbine Exposure
Figure 7 illustrates the tissue slice approach used to determine local vinorelbine fu and unbound concentration in normal brain and brain metastases. Mean vinorelbine fu equaled 0.0129 ± 0.0016 (n = 20) in brain and 0.0115 ± 0.0010 (n = 20) in brain metastases, and did not differ statistically from matching values obtained with the tissue homogenate method. For example, fu,brain equaled 0.0140 ± 0.0036 (n = 6) for brain homogenate and was slightly lower in brain and systemic metastases (P > 0.2). Vinorelbine unbound fraction in plasma was 0.148 ± 0.020, and did not differ in tumor-bearing animals (P > 0.2).
Fig. 7.
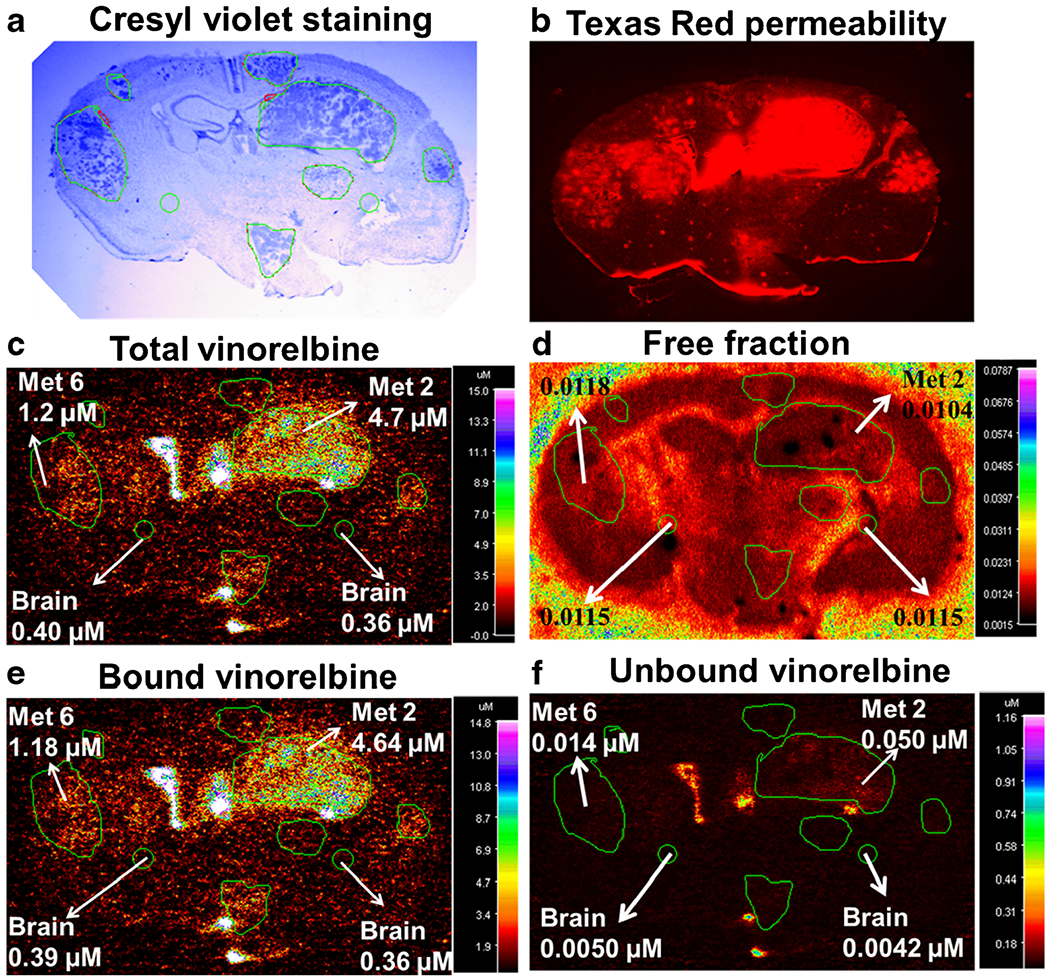
Vinorelbine total, bound and unbound concentration in MDA-MB-231BR experimental brain metastases of breast cancer. Representative images for determination of unbound vinorelbine concentration in 20 μm coronal brain sections from mice harbouring metastases 2 h after injection of vinorelbine. a Cresyl violet staining of brain section for tumor localization. b Fluorescence image of Texas red permeability. c QAR image of in vivo total vinorelbine. d QAR image of in vitro free fraction. e Bound vinorelbine concentration. f Unbound vinorelbine concentration. Images a-c and e-f are of the same brain section, while d is from the adjacent bran section. Images d-f were obtained following the procedure illustrated in Fig. 1 using MCID software.
Unbound vinorelbine concentrations in tissues and plasma as well as Kp,uu values are summarized in Fig. 8. Plasma unbound vinorelbine concentration decreased from 620 nM at 30 min to 16 nM at 8 h. Matching brain and brain metastasis unbound vinorelbine concentrations were 10–100 fold lower (Fig. 8a). Calculated Kp,uu equaled 0.025 for brain and 0.032–0.23 for brain metastases (Fig. 8b). The integrated average vinorelbine unbound concentration in vivo equaled 5.5 ± 0.9 nM (n = 10) in brain and 24 ± 16 nM (n = 20) in brain metastases over the course of the experiment. The fact that Kp,uu for brain metastases is far below 1.0 suggests that substantial factors limit vinorelbine exposure to brain metastases using the MDA-MB-231BR model. In contrast, systemic metastases had Kp,uu of ~1.18, consistent with equilibration of vinorelbine in those specimens (Fig. 8). Barrier-free brain metastasis Kp and Ctot (barrier-free Kp = fu,plasma / fu,brain met) equaled 13.7 and 19.6 μM, respectively at 2 h and reasonably matched values for systemic tumors (Kp = 15.2, Ctot = 23.6 μM at 2 h).
Fig. 8.
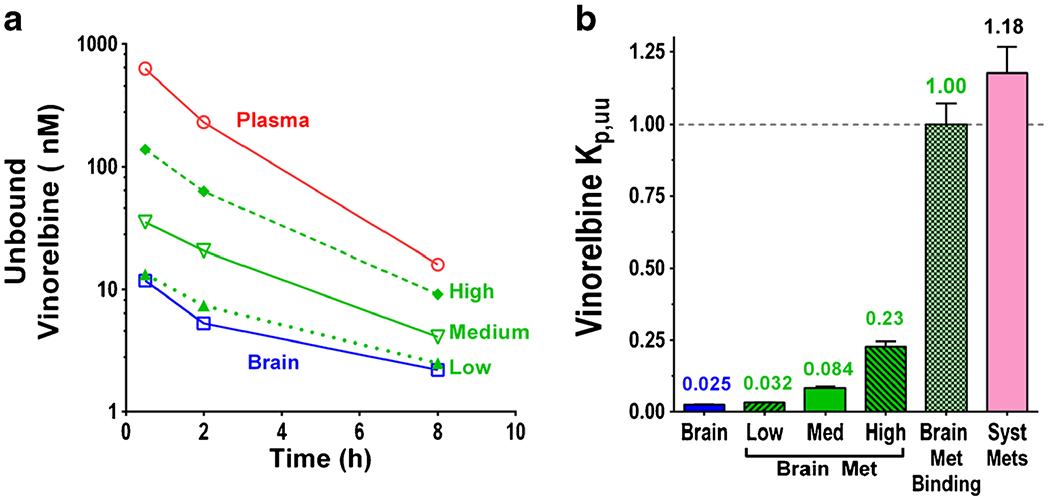
Unbound vinorelbine time course and Kp,uu of brain and brain metastases a Unbound vinorelbine time course in plasma and subgroups of brain metastases, b Kp,uu of brain, subgroups of brain metastases and systemic metastases, data represents mean ± SD, (n = 3–70).
While the great majority of brain metastases had vinorelbine Kp,uu values indicative of strong restriction in MDA-MB-231BR brain metastasis drug exposure, ~5% of subregions within “high uptake” brain metastases predicted Kp,uu ~ 0.5–>1 (Fig. 9), suggesting substantial, if not total, compromise of the BTB. Such areas were associated with vinorelbine unbound concentrations of >150–300 nM. A strong correlation was found in these regions between vinorelbine unbound concentration and uptake of the permeability marker Texas red (Fig. 9e). Brain metastasis fu varied minimally across metastases and followed a normal distribution with a tight range < 2 fold (Fig. S4A in Supplementary Material). Thus, the differences in Cu correlated with BTB compromise.
Fig. 9.
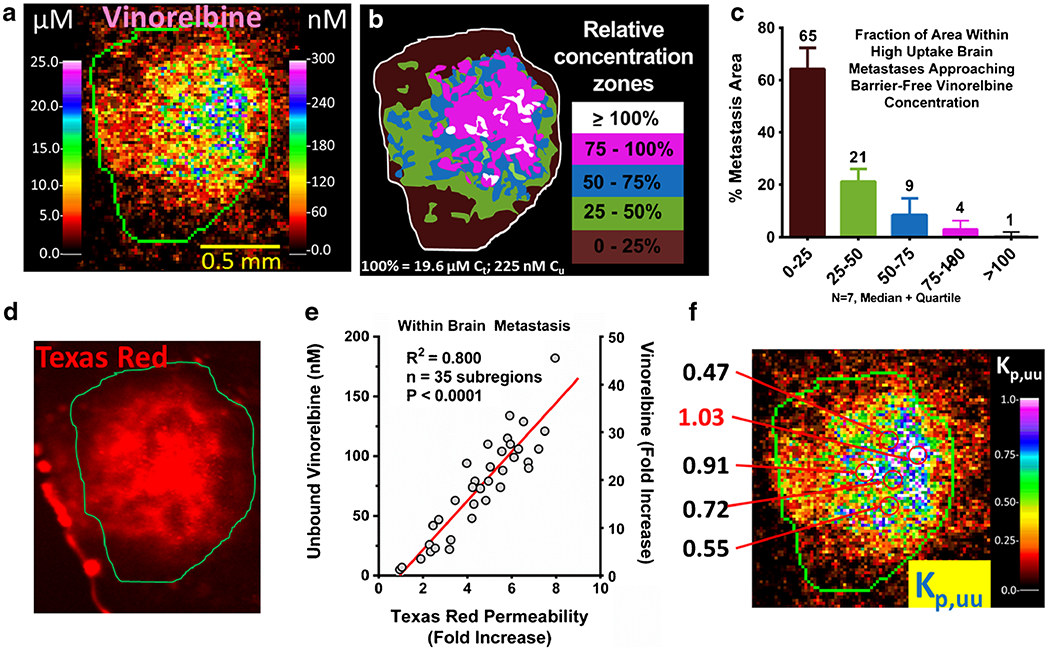
3H-vinorelbine distribution within a high-uptake metastasis. a Expanded QAR image of a representative high-uptake (>10 × (uninvolved brain average vinorelbine concentration)) metastasis showing localized total (left scale) and corresponding unbound (right scale) vinorelbine. b Illustration of the concentration zones observed in a relative to calculated equilibrium concentration that would be attained in brain without barrier (19.6 μM). c Areas within high uptake brain metastases (N = 7) partitioned by concentration relative to equilibrium concentration. d Localized Texas red fluorescence measurement in the same metastasis. e Correlation between fold increase in Texas red permeability and unbound vinorelbine concentration. f Calculated Kp,uu within metastasis, with select high-uptake regions shown, which could be reaching efficacious levels.
Correlation with Biomarker Activity
TUNEL staining was used as an in vivo biomarker of drug activity (Fig. 10a). Tumor cell-positive TUNEL staining at 2 h following drug administration ranged from 0 to 66% in whole brain metastases of animals treated with vinorelbine at the maximum tolerated dose. No TUNEL staining was observed in control brain tissue. When the data were plotted against measured whole brain metastasis vinorelbine concentration (total drug), least squares regression analysis showed that 50% apoptosis was associated with a total vinorelbine concentration of 4.7 μM. and 10% positive staining was associated with a total vinorelbine concentration of 1.2 μM (Fig. 10b). Application of these values to the database of brain metastases (N = 132 at 2 h after drug administration) revealed that 42% of brain metastases fell within the range of 0–10% positive staining and 51 % had intermediate (10–50%) positive staining (Fig. 10c). Only 7% of brain metastases were associated with >50% TUNEL staining (Fig. 10c).
Fig. 10.
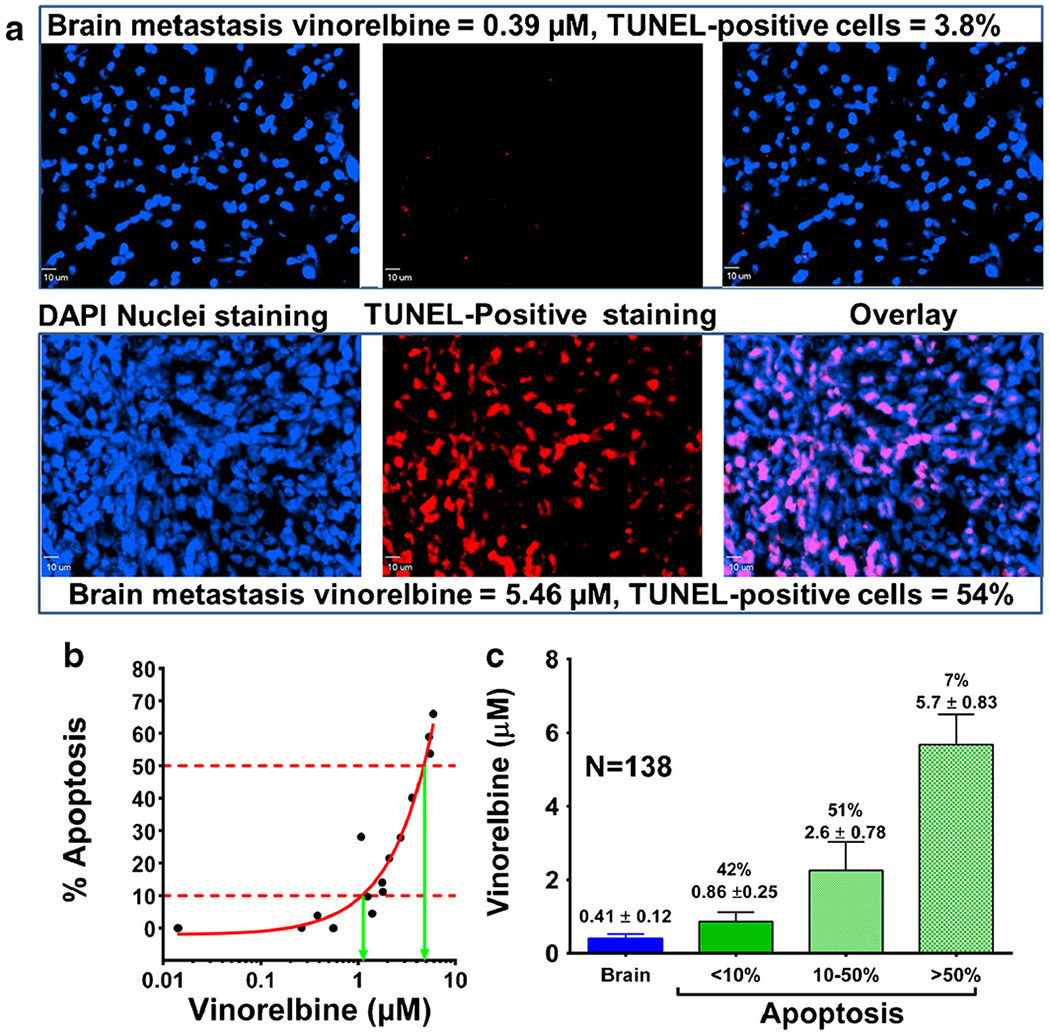
In vivo pharmacokinetic-pharmacodynamic relationship in brain metastases of breast cancer after 2 hours of vinorelbine circulation. Mice harbouring MDA-MB-231BR metastases were injected with 12 mg/kg vinorelbine. Brain sections were analysed for evidence of tumor cell death (TUNEL) 2 h post-injection. Two metastases representative of relatively low and high drug uptake are shown. a TUNEL staining overlaid onto DAPI nuclear staining as visualized by fluorescence. b In vivo localized relationship of drug levels and percentage tumor cell apoptosis. C Vinorelbine concentration in brain metastases as a function of level of apoptosis.
When in vivo % apoptosis at 2 h was plotted versus matching in vivo average integrated unbound vinorelbine concentration, the best fit IC50 equaled 56 nM (Fig. 11a). The IC50 for matching data obtained with 2 h vinorelbine exposure in vitro equaled 14 ± 1.4 nM. The fact that the two IC50 values fell within 4 fold supports the hypothesis that unbound vinorelbine concentration and IC50 could be used to model drug efficacy in vivo. The difference may be related to multiple factors.
Fig. 11.
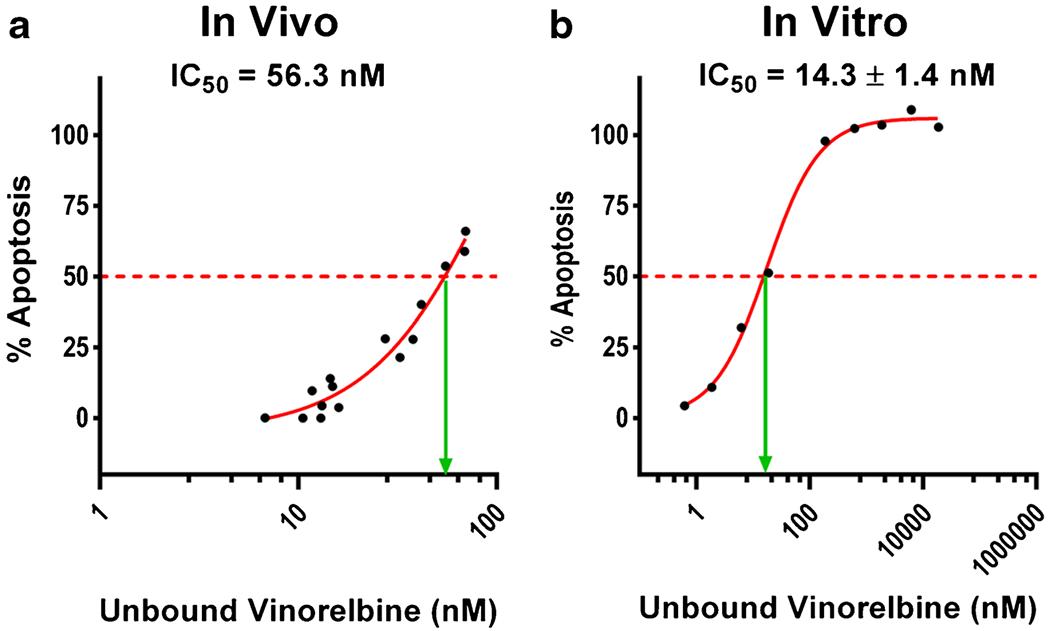
Comparison of in vivo and in vitro vinorelbine IC50. Dose response of MDA-MB-231BR cells to vinorelbine, as measured by TUNEL staining. a In vivo curve was obtained with brain slices bearing MDA-MB-231BR metastases 2 h after i.v. administration of 12 mg/kg vinorelbine. b In vitro study used MDA-MB-231BR cells with 2 h exposure to vinorelbine in cell culture on a glycine-coated cover glass. In vivo (a) unbound vinorelbine concentration (nM) was calculated by the in vivo brain slice binding method. In vitro (b) unbound vinorelbine was calculated using equilibrium dialysis. Data represents mean only (n = 4).
One possible factor is differential expression of P-gp by MDA-MB-231BR cells. P-gp, an ABC drug transporter known to mediate active vinorelbine efflux from cells (36), was expressed by MDA-MB-231BR cells in brain metastases in vivo at levels comparable or greater (2x) to that of in vivo brain capillaries (Fig. 12). In contrast, little or no P-gp expression was found in MDA-MB231BR cells in vitro (37).
Fig. 12.
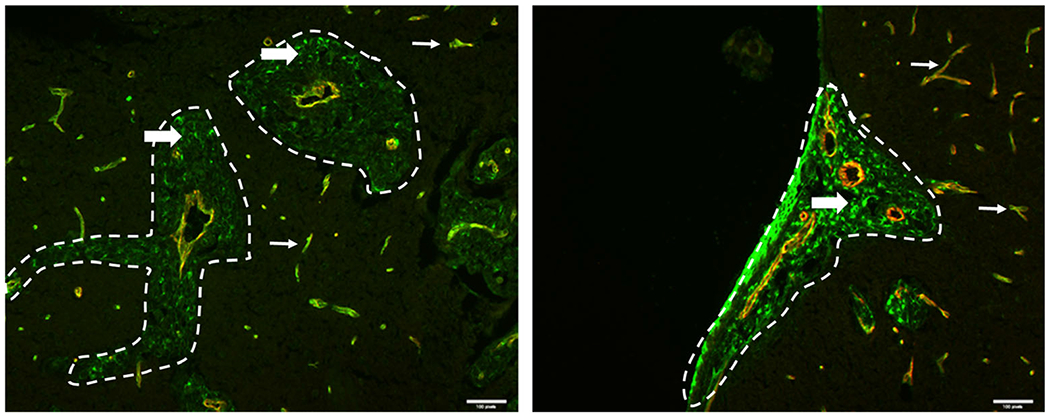
Immunostaining for presence and localization of ABCB1 (P-gp) in brain. Mouse brain tissue sections from mice injected with MDA-MB-231BR cells were stained for ABCB1 (green) and CD31 (red). CD31 highlights the blood vessels and the metastases are circled in white dashed lines. Scale bars = 50 μm. In two different metastatic clusters (a and b), ABCB1 is expressed in both the blood vessels (thin white arrows) and the metastatic cells (thick white arrows), illustrating the heterogeneity of ABCB1 expression in the metastatic cells.
DISCUSSION
The results of this study show that vinorelbine distribution is markedly limited in the vast majority of brain metastases of the MDA-MD-231BR human breast cancer model. At the maximum tolerated dose, vinorelbine Kp in over half of intracranial metastases fell 10 fold or more below that of matching systemic metastases when expressed either as total or unbound drug. TUNEL staining, as a marker of early apoptosis, was <10% in the same set of low delivery metastases, confirming poor activity. Only in the 7% of brain metastases with the highest vinorelbine exposure did TUNEL-positive staining exceed 50%. Extrapolation to humans would predict even weaker response, as the plasma concentration integral noted here and in other studies (26) at maximum tolerated dose exceeds that reported for humans at standard dosing (26,30) by >6 fold. Therefore, human in vivo brain metastasis vinorelbine concentration and effect would be predicted to be even less than that noted in this report (26,30,38). Though BTB permeability was significantly elevated and vinorelbine concentration exposure exceeded normal brain on average by >4 fold in the vast majority (>85%) of brain metastases, the magnitude of the effect fell far short of that desired for good therapeutic activity. Instead of the median concentrations of 1.6 μM (Ctot) and 18 nM (Cu) in brain metastases at 2 h, the model suggests that corresponding values of >16 μM and >180 nM would be more appropriate for therapeutic success. These findings reinforce prior work with paclitaxel (17), doxorubicin (17) and lapatinib (16), and support the hypothesis that overall, the BTB, though compromised, still has a marked impact restricting anticancer drug exposure to brain metastases. The study provides a structured approach for assessing in vivo anticancer drug delivery and efficacy to brain metastases so that better therapeutic agents can be developed in the future.
This study also incorporates estimation of free drug concentration and equilibration as important parameters in brain metastasis drug availability and success. In prior studies, it was difficult to say what total level of drug exposure was expected in the absence of a compromised BTB. Multiple parameters impact total drug levels in tissues, including local binding, pH-dependent intracellular sequestration in organelles, active transport, and metabolism. One approach to simplify this analysis is to compare drug levels in brain metastases to those in systemic metastases in vivo without a BTB or in cancer cells in vitro of the same tumor line (16,17). However, the 2-fold vinorelbine concentration difference between systemic metastases and matching subcutaneous tumors, as well as previously reported differences for other anticancer drugs (16,17), suggests that heterogeneity in systemic metastases may be important. In this paper, we extend the analysis to include unbound drug concentration, which can be more clearly compared to that in vitro, and to provide an index of drug equilibration, Kp,uu, to assess the extent that drug exposure is restricted or compromised. Brain fu for vinorelbine (0.012) was similar to that previously reported for vinblastine (0.006) by Kalvass et al. (28) by the homogenate method and Uchida et al. (39) by the fresh brain slice method. The fu for vinorelbine may be somewhat less than for vinblastine because it was designed to bind less to axonal than to mitotic tubulin to decrease neurologic adverse effects (19,30). Likewise, the brain Kp for vinorelbine (0.28) was also similar to that for vinblastine (0.38) previously reported (39). Using the tissue homogenate method, Kp,uu for vinorelbine in brain metastasis was ~8% of Kp. The 20 μm frozen tissue sections, adapted for autoradiography and tissue staining, were found to equilibrate 3H-vinorelbine within 3 h and to provide fu tissue values that matched those provided by the bulk tissue homogenate method. Attempts to adapt the fresh intact brain slice technique (40, 41) to autoradiography failed in our lab due to the long time period required to obtain radiotracer drug equilibration across 300 μm—thick tissue sections. Slow vinorelbine interstitial diffusion together with high intracellular binding, combined to make the equilibration time exceed that which could be sustained in a viable in vitro tissue slice preparation. Significant gradients were found in 300 μm thick sections even after 5 h of incubation at 37°C and pH 7.4 (data not shown). The intact tissue slice approach has the advantage of correcting for cellular compartmentation and active transport (40, 41). However, the frozen 20 μm slice technique used here allows correction for tissue binding and provides measurement of Ctot, fu and Cu across tissue sections in small volumes (25 μm× 25 μm) which reveal the broad range of drug distribution in brain metastases and the local degree of compromise of the BTB.
In the absence of active transport, marked bulk flow out of the tissue, or catabolism, Kp,uu, should equal ~1.0, indicating equilibration of unbound drug between tissue fluid and plasma (27). Kp,uu values markedly less than 1.0 suggest the presence of an active efflux transport barrier or appreciable tissue metabolism. Kp,uu for vinorelbine in normal brain was found to be 0.025, indicative of a 40-fold net restriction or active efflux in maintaining low brain vinorelbine concentration. In comparison, our value for vinorelbine Kp,uu in the MDA-MD-231BR brain metastatic model was between 0.03 and 0.22 (median 0.08). The results clearly show that by total drug and by unbound drug, vinorelbine is substantially limited in the great majority of the MDA-MB-231BR brain metastases. LC-MS/MS revealed minimal metabolism over 8 h with <20% brain deacteylvinorelbine exposure. Given the presence of the BTB and the marked role of active drug efflux in that system, it is logical to hypothesize that low permeability or active barrier efflux are the most important parameters accounting for the low Kp,uu exposure.
In this paper, we add “brain metastasis without a barrier” (Kp = 13.7), which can be calculated from fu, brain met, fu,plasma, and integrated average Ctot, plasma and may serve as a superior comparison to that of systemic metastases (39). Using the brain metastasis itself with its own binding fu reduces errors due to differences in binding that are present from tissue to tissue. Using these guideposts, we can now identify specific areas within brain metastases with the greatest BTB breakdown and relate this to the maximum that might be predicted. We find that in a 6% subset of areas within the 8% highest vinorelbine uptake brain metastases, small 100 μm diameter regions exist that exhibit almost complete BBB breakdown (Kp,uu ~1.0), as illustrated in Fig. 9b and f. Overall, the zones of near total BTB breakdown comprise ~0.5% (8% × 6%) of total MDA-MB-231BR brain metastasis area with totally compromised BTB function. Several potential biological processes may underlie these regions of markedly high permeability. VEGF production and angiogenesis create new blood vessels with generally leakier BBB (42). Several gradations of leakiness are present within brain metastases and likely correlate with specific processes. Heterogeneous uptake has been a constant in BTB permeability studies of brain metastases and primary brain tumors (8,18,43). In several studies from our lab we have reported a correlation between simultaneously measured BTB drug leakage and brain metastasis drug uptake. Interestingly, the large heterogeneity observed in drug uptake between brain metastases is also observed with drug uptake within brain metastases, when analyzed with appropriate imaging methods. The variation in drug exposure within metastases is hypothesized to be a critical factor in metastasis survival and future growth and resistance.
Active efflux transport has been shown to limit brain exposure to vinca alkaloids, such as vinblastine and vincristine (44,45). Various transporters, such as P-gp, MRP1, MRP2 and MRP7 have all been shown to transport vinca alkaloids in cell models and in vivo (46–48). Influx transporters, such as Oct3, may also have roles taking vinca alkaloids into brain. In our laboratory using brain perfusion in transporter knockout animals and with inhibitors, evidence has been found for roles of P-gp and MRP in vinorelbine transport out of brain at the BBB (24). The results suggest that vinorelbine exposure in normal brain is critically limited by BBB active efflux transport.
Contrary to prior studies, the results herein with the MDA-MB-231BR brain metastasis model raise questions regarding the importance of the brain around tumor (BAT) area. Detailed microscopic analysis of the tumor border showed that elevated vinorelbine concentration normalized to surrounding brain concentration within ~300 μm (0.3 mm) (Fig. 5d), similar to the limited diffusion of carmustine in brain and brain tumors (49). Thus, if this model is representative of others, elevated drug concentration in BAT collected by dissection (not tissue imaging) may be due to inclusion of small portions of tumor with surrounding brain. We have found similar minimal evidence for substantial BAT in 4T1, MCF-7 and ZR-75 breast cancer brain metastasis models (data not shown).
Comparison of in vitro and in vivo dose–response curves shows a ~ 4 fold difference. This relative agreement suggests that in vitro models may be useful to approximate drug activity in vivo if correction is made to reflect the free drug concentration. The higher IC50 value in vivo may be explained by a) tumor cell resistance to drug in vivo due to up-regulation of P-gp or other transporters (Fig. 12), b) in vivo hypoxia- or acidosis-induced drug resistance from other pathways, c) in vivo effects of extracellular matrix, and d) interactions between cancer cells and other cells (e.g., astrocytes) within the tumor to vary the sensitivity to vinorelbine (7,12). While in vivo expression of P-gp in brain metastasis cells in the CNS was observed, the same expression was not seen in vitro (39). Taking this difference of expression into account, the agreement between in vitro and in vivo measurements is quite good. Our results confirm that in this model, low drug exposure is by far the primary reason for poor CNS metastasis antitumor activity.
From the data derived thus far by our laboratory with the preclinical MDA-MB-231BR brain metastasis model, restricted vinorelbine exposure to CNS metastases accounts for a median 14-fold compromise over that in a systemic tumor. Also, results from PK-PD modeling predict that in vivo efficacy requires 4-fold higher drug exposure for desired effect. Therefore, based upon these numbers, BTB restriction in drug supply accounts for 80% of the compromise in vinorelbine efficacy against brain metastases (100 x (14/(14 + 3.5)) = 80%), while the remaining 20% may be determined by the reduced sensitivity of the tumor in the brain microenvironment (5,12,13). We can predict by extrapolation of the in vivo concentration-response curve, that brain unbound and total vinorelbine concentrations of 112 nM and 9.3 μM, respectively, would be required to obtain >75% apoptosis effect as measured by TUNEL staining. This would require increasing vinorelbine distribution by ~15 fold, in order to bring the lowest brain metastases up to this level. The BTB stands as an important factor limiting vinorelbine drug exposure to brain metastases.
CONCLUSIONS
This study documents the critical role of the BBB and BTB in limiting vinorelbine distribution to brain and experimental brain metastases. We have demonstrated that vinorelbine delivery to normal brain is 52-fold less than the delivery to nonbarrier tissues within and outside the CNS. Vinorelbine distribution among different sizes of metastases was found to be heterogeneous with no simple relationship to size or morphology. In many brain metastases, a substantial fraction of tumor area received 5- or 10-fold less drug than elevated areas. This heterogeneity of drug delivery with many low uptake regions would be expected to provide pockets where drug efficacy is severely compromised and tumor would be allowed to further grow in brain. Unbound drug concentrations (measured with frozen brain section method) provide regional information on drug concentration that has heretofore not been available. Our results emphasize the need for good brain vascular transport properties in the development of effective therapeutic agents against this devastating disease. The results, when coupled with measured in vivo drug activity (i.e., TUNEL staining) also demonstrate that, while active drug concentrations are reached in a subset of brain metastases, marked increases on the order of 10 fold or more would be required to obtain active concentrations in the majority of brain metastases.
Supplementary Material
ACKNOWLEDGMENTS AND DISCLOSURES
This work was supported by grants from the Department of Defense Breast Cancer Program (W81XWH-06-2-0033) and the Cancer Prevention Research Institute of Texas (RP120489 and RP110786)
ABBREVIATIONS
- AUC
Area under the curve
- BAT
Brain adjacent to tumor
- BBB
Blood–brain barrier
- BTB
Blood-tumor barrier
- CNS
Central nervous system
- fu
Unbound fraction
- fu,hd
Unbound fraction in diluted homogenate
- Kp
Integrated total drag partition coefficient between tissue and plasma
- Kp,uu
Integrated unbound drug partition coefficient between tissue and plasma
- PD
Pharmacodynamics
- P-gp
P-glycoprotein (ABCB1)
- PK
Pharmacokinetics
Footnotes
Electronic supplementary material The online version of this article (doi:10.1007/s11095-016-2012-3) contains supplementary material, which is available to authorized users.
REFERENCES
- 1.Sul J, Posner JB. Brain metastases: epidemiology and pathophysiology. Cancer Treat Res. 2007;136:1–21. [DOI] [PubMed] [Google Scholar]
- 2.Rostami R, Mittal S, Rostami P, Tavassoli F, Jabbari B. Brain metastasis in breast cancer: a comprehensive literature review. J Neurooncol. 2016;127(3):407–14. [DOI] [PubMed] [Google Scholar]
- 3.Mehta MP, Paleologos NA, Mikkelsen T, Robinson PD, Ammirati M, Andrews DW, et al. The role of chemotherapy in the management of newly diagnosed brain metastases: a systematic review and evidence-based clinical practice guideline. J Neurooncol. 2010;96(1):71–83. [DOI] [PMC free article] [PubMed] [Google Scholar]
- 4.Gradishar WJ, Anderson BO, Balassanian R, Blair SL, Burstein HJ, Cyr A, et al. Breast Cancer, Version 1.2016. J Natl Compr Canc Netw. 2015;13(12):1475–85. [DOI] [PubMed] [Google Scholar]
- 5.Lin X, DeAngelis LM. Treatment of brain metastases. J Clin Oncol : Off J Am Soc Clin Oncol. 2015;33(30):3475–84. [DOI] [PMC free article] [PubMed] [Google Scholar]
- 6.Brastianos PK, Carter SL, Santagata S, Cahill DP, Taylor-Weiner A, Jones RT, et al. Genomic characterization of brain metastases reveals branched evolution and potential therapeutic targets. Cancer Discov. 2015;5(11):1164–77. [DOI] [PMC free article] [PubMed] [Google Scholar]
- 7.Blecharz KG, Colla R, Rohde V, Vajkoczy P. Control of the blood-brain barrier function in cancer cell metastasis. Biol Cell. 2015;107(10):342–71. [DOI] [PubMed] [Google Scholar]
- 8.Steeg PS, Camphausen KA, Smith QR. Brain metastases as preventive and therapeutic targets. Nat Rev Cancer. 2011;11(5):352–63. [DOI] [PMC free article] [PubMed] [Google Scholar]
- 9.Parrish KE, Sarkaria JN, Elmquist WF. Improving drug delivery to primary and metastatic brain tumors: strategies to overcome the blood-brain barrier. Clin Pharmacol Ther. 2015;97(4):336–46. [DOI] [PubMed] [Google Scholar]
- 10.Henry MN, Chen Y, McFadden CD, Simedrea FC, Foster PJ. In-vivo longitudinal MRI study: an assessment of melanoma brain metastases in a clinically relevant mouse model. Melanoma Res. 2015;25(2):127–37. [DOI] [PubMed] [Google Scholar]
- 11.Murrell DH, Hamilton AM, Mallett CL, van Gorkum R, Chambers AF, Foster PJ. Understanding heterogeneity and permeability of brain metastases in murine models of HER2-positive breast cancer through magnetic resonance imaging: implications for detection and therapy. Transl Oncol. 2015;8(3):176–84. [DOI] [PMC free article] [PubMed] [Google Scholar]
- 12.Fidler IJ. The biology of brain metastasis: challenges for therapy. Cancer J. 2015;21(4):284–93. [DOI] [PubMed] [Google Scholar]
- 13.Leone JP, Leone BA. Breast cancer brain metastases: the last frontier. Exp Hematol Oncol. 2015;4:33. [DOI] [PMC free article] [PubMed] [Google Scholar]
- 14.Levin VA, Tonge PJ, Gallo JM, Birtwistle MR, Dar AC, Iavarone A. CNS anticancer drug discovery and development conference white paper. Neuro Oncol. 2015;17 Suppl 6:vi1–26. [DOI] [PMC free article] [PubMed] [Google Scholar]
- 15.Thomas FC, Taskar K, Rudraraju V, Goda S, Thorsheim HR, Gaasch JA, et al. Uptake of ANG1005, a novel paclitaxel derivative, through the blood-brain barrier into brain and experimental brain metastases of breast cancer. Pharm Res. 2009;26(11):2486–94. [DOI] [PMC free article] [PubMed] [Google Scholar]
- 16.Taskar KS, Rudraraju V, Mittapalli RK, Samala R, Thorsheim HR, Lockman J, et al. Lapatinib distribution in HER2 overexpressing experimental brain metastases of breast cancer. Pharm Res. 2012;29(3):770–81. [DOI] [PMC free article] [PubMed] [Google Scholar]
- 17.Lockman PR, Mittapalli RK, Taskar KS, Rudraraju V, Gril B, Bohn KA, et al. Heterogeneous blood-tumor barrier permeability determines drug efficacy in experimental brain metastases of breast cancer. Clin Cancer Res. 2010;16(23):5664–78. [DOI] [PMC free article] [PubMed] [Google Scholar]
- 18.Morikawa A, Peereboom DM, Thorsheim HR, Samala R, Balyan R, Murphy CG, et al. Capecitabine and lapatinib uptake in surgically resected brain metastases from metastatic breast cancer patients: a prospective study. Neuro Oncol. 2015;17(2):289–95. [DOI] [PMC free article] [PubMed] [Google Scholar]
- 19.Galano G, Caputo M, Tecce MF, Capasso A. Efficacy and tolerability of vinorelbine in the cancer therapy. Curr Drug Saf. 2011;6(3):185–93. [DOI] [PubMed] [Google Scholar]
- 20.Andersson M, Lidbrink E, Bjerre K, Wist E, Enevoldsen K, Jensen AB, et al. Phase III randomized study comparing docetaxel plus trastuzumab with vinorelbine plus trastuzumab as first-line therapy of metastatic or locally advanced human epidermal growth factor receptor 2-positive breast cancer: the HERNATA study. J Clin Oncol : Off J Am Soc Clin Oncol. 2011;29(3):264–71. [DOI] [PubMed] [Google Scholar]
- 21.Xu YC, Wang HX, Tang L, Ma Y, Zhang FC. A systematic review of vinorelbine for the treatment of breast cancer. Breast J. 2013;19(2):180–8. [DOI] [PubMed] [Google Scholar]
- 22.Omuro AM, Raizer JJ, Demopoulos A, Malkin MG, Abrey LE. Vinorelbine combined with a protracted course of temozolomide for recurrent brain metastases: a phase I trial. J Neurooncol. 2006;78(3):277–80. [DOI] [PubMed] [Google Scholar]
- 23.Iwamoto FM, Omuro AM, Raizer JJ, Nolan CP, Hormigo A, Lassman AB, et al. A phase II trial of vinorelbine and intensive temozolomide for patients with recurrent or progressive brain metastases. J Neurooncol. 2008;87(1):85–90. [DOI] [PubMed] [Google Scholar]
- 24.Samala R, Kunal T, Thorsheim HR, Lockman PR, Smith QR. Vinorelbine distribution to brain metastases of breast cancer and factors affecting in vivo efficacy. 2012 AAPS Annual Meeting and Exposition October 14–17, 2012; McCormick Place, Chicago IL. [Google Scholar]
- 25.Palmieri D, Bronder JL, Herring JM, Yoneda T, Weil RJ, Stark AM, et al. Her-2 overexpression increases the metastatic outgrowth of breast cancer cells in the brain. Cancer Res. 2007;67(9):4190–8. [DOI] [PubMed] [Google Scholar]
- 26.van Tellingen O, Kuijpers AV, Beijnen JH, Nooijen WJ, Bult A. Plasma pharmacokinetics, tissue disposition, excretion and metabolism of vinorelbine in mice as determined by high performance liquid chromatography. Invest New Drugs. 1993; 11 (2–3):141–50. [DOI] [PubMed] [Google Scholar]
- 27.Kobayashi S, Sakai T, Dalrymple PD, Wood SG, Chasseaud LF. Disposition of the novel anticancer agent vinorelbine ditartrate following intravenous administration in mice, rats and dogs. Arzneimittelforschung. 1993;43(12): 1367–77. [PubMed] [Google Scholar]
- 28.Kalvass JC, Maurer TS, Pollack GM. Use of plasma and brain unbound fractions to assess the extent of brain distribution of 34 drugs: comparison of unbound concentration ratios to in vivo p-glycoprotein efflux ratios. Drug Metab Dispos. 2007;35(4):660–6. [DOI] [PubMed] [Google Scholar]
- 29.Hammarlund-Udenaes M, Friden M, Syvanen S, Gupta A. On the rate and extent of drug delivery to the brain. Pharm Res. 2008;25(8):1737–50. [DOI] [PMC free article] [PubMed] [Google Scholar]
- 30.Leveque D, Jehl F. Clinical pharmacokinetics of vinorelbine. Clin Pharmacokinet. 1996;31(3): 184–97. [DOI] [PubMed] [Google Scholar]
- 31.Krikorian A, Rahmani R, Bromet M, Bore P, Cano JP. Pharmacokinetics and metabolism of Navelbine. Semin Oncol. 1989;16(2 Suppl 4):21–5. [PubMed] [Google Scholar]
- 32.Biziota E, Briasoulis E, Mavroeidis L, Marselos M, Harris AL, Pappas P. Cellular and molecular effects of metronomic vinorelbine and 4-O-deacetylvinorelbine on human umbilical vein endothelial cells. Anticancer Drugs. 2016;27(3):216–24. [DOI] [PMC free article] [PubMed] [Google Scholar]
- 33.Varma MV, Sateesh K, Panchagnula R. Functional role of P-glycoprotein in limiting intestinal absorption of drugs: contribution of passive permeability to P-glycoprotein mediated efflux transport. Mol Pharm. 2005;2(1):12–21. [DOI] [PubMed] [Google Scholar]
- 34.Summerfield SG, Read K, Begley DJ, Obradovic T, Hidalgo IJ, Coggon S, et al. Central nervous system drug disposition: the relationship between in situ brain permeability and brain free fraction. J Pharmacol Exp Ther. 2007;322(1):205–13. [DOI] [PubMed] [Google Scholar]
- 35.Wierzba K, Sugiyama Y, Okudaira K, Iga T, Hanano M. Tubulin as a major determinant of tissue distribution of vincristine. J Pharm Sci. 1987;76(12):872–5. [DOI] [PubMed] [Google Scholar]
- 36.Adams DJ, Knick VC. P-glycoprotein mediated resistance to 5’-nor-anhydro-vinblastine (Navelbine). Invest New Drugs. 1995;13(1):13–21. [DOI] [PubMed] [Google Scholar]
- 37.Obuchi W, Ohtsuki S, Uchida Y, Ohmine K, Yamori T, Terasaki T. Identification of transporters associated with Etoposide sensitivity of stomach cancer cell lines and methotrexate sensitivity of breast cancer cell lines by quantitative targeted absolute proteomics. Mol Pharmacol. 2013;83(2):490–500. [DOI] [PubMed] [Google Scholar]
- 38.Inaba M, Kobayashi T, Tashiro T, Sakurai Y. Pharmacokinetic approach to rational therapeutic doses for human tumor-bearing nude mice. Jpn J Cancer Res. 1988;79(4):509–16. [DOI] [PMC free article] [PubMed] [Google Scholar]
- 39.Uchida Y, Ohtsuki S, Kamiie J, Terasaki T. Blood-brain barrier (BBB) pharmacoproteomics: reconstruction of in vivo brain distribution of 11 P-glycoprotein substrates based on the BBB transporter protein concentration, in vitro intrinsic transport activity, and unbound fraction in plasma and brain in mice. J Pharmacol Exp Ther. 2011;339(2):579–88. [DOI] [PubMed] [Google Scholar]
- 40.Fridén M, Ducrozet F, Middleton B, Antonsson M, Bredberg U, Hammarlund-Udenaes M. Development of a high-throughput brain slice method for studying drug distribution in the central nervous system. Drug Metab Dispos. 2009;37(6):1226–33. [DOI] [PubMed] [Google Scholar]
- 41.Fridén M, Bergström F, Wan H, Rehngren M, Ahlin G, Hammarlund-Udenaes M, et al. Measurement of unbound drug exposure in brain: modeling of pH partitioning explains diverging results between the brain slice and brain homogenate methods. Drug Metab Dispos. 2011;39(3):353–62. [DOI] [PubMed] [Google Scholar]
- 42.Ma T, Xue YX. MiRNA-200b regulates RMP7-induced increases in blood-tumor barrier permeability by targeting RhoA and ROCKII. Front Mol Neurosci. 2016;9:9. [DOI] [PMC free article] [PubMed] [Google Scholar]
- 43.Pitz MW, Desai A, Grossman SA, Blakeley JO. Tissue concentration of systemically administered antineoplastic agents in human brain tumors. J Neurooncol. 2011;104(3):629–38. [DOI] [PMC free article] [PubMed] [Google Scholar]
- 44.Schinkel AH, Smit JJ, van Tellingen O, Beijnen JH, Wagenaar E, van Deemter L, et al. Disruption of the mouse mdr1a P-glycoprotein gene leads to a deficiency in the blood-brain barrier and to increased sensitivity to drugs. Cell. 1994;77(4):491–502. [DOI] [PubMed] [Google Scholar]
- 45.Cisternino S, Rousselle C, Dagenais C, Scherrmann JM. Screening of multidrug-resistance sensitive drugs by in situ brain perfusion in P-glycoprotein-deficient mice. Pharm Res. 2001;18(2):183–90. [DOI] [PubMed] [Google Scholar]
- 46.Wang F, Zhou F, Kruh GD, Gallo JM. Influence of blood-brain barrier efflux pumps on the distribution of vincristine in brain and brain tumors. Neuro Oncol. 2010;12(10):1043–9. [DOI] [PMC free article] [PubMed] [Google Scholar]
- 47.Lagas JS, Damen CW, van Waterschoot RA, Iusuf D, Beijnen JH, Schinkel AH. P-glycoprotein, multidrug-resistance associated protein 2, Cyp3a, and carboxylesterase affect the oral availability and metabolism of vinorelbine. Mol Pharmacol. 2012;82(4):636–44. [DOI] [PubMed] [Google Scholar]
- 48.Johnson DR, Finch RA, Lin ZP, Zeiss CJ, Sartorelli AC. The pharmacological phenotype of combined multidrug-resistance mdr1a/1b- and mrp1-deficient mice. Cancer Res. 2001;61(4):1469–76. [PubMed] [Google Scholar]
- 49.Fung LK, Shin M, Tyler B, Brem H, Saltzman WM. Chemotherapeutic drugs released from polymers: distribution of 1,3-bis(2-chloroethyl)-1-nitrosourea in the rat brain. Pharm Res. 1996;13(5):671–82. [DOI] [PubMed] [Google Scholar]
Associated Data
This section collects any data citations, data availability statements, or supplementary materials included in this article.


