Abstract
Pharos is an integrated web-based informatics platform for analysis of data aggregated by the Illuminating the Druggable Genome (IDG) Knowledge Management Center, an NIH Common Fund initiative. The current version of Pharos (as of October 2019) spans 20,244 proteins in the human proteome, 19,880 disease and phenotype associations and 226,829 ChEMBL compounds. This resource not only collates and analyzes data from over 60 high quality resources to generate these types, it uses text indexing to find less apparent connections between targets and has recently begun to collaborate with institutions that generate data and resources. Proteins are ranked according to a knowledge-based classification system, which can help researchers to identify lesser studied “dark” targets that could be potentially further illuminated. This is an important process for both drug discovery and target validation, as more knowledge can accelerate target identification, and previously understudied proteins can serve as novel targets in drug discovery. Two basic protocols are discussed that illustrate the various levels of detail available for targets, and several methods of finding targets of interest. An Alternate Protocol is used to illustrate the difference of available knowledge between lesser and well-studied targets.
Keywords: Bioinformatics, dark genome, disease, drug discovery, drug targets, phenotype, proteins, target validation
Introduction
Since its introduction in early 2017, Pharos (Nguyen et al., 2017) has expanded in the quantity and type of datasets aggregated, while continually adding visualizations and widgets designed to aid in the discovery and illumination of target knowledge. Pharos can be used to browse and search the human proteome and analyze lists of proteins, allowing for lateral filtering and comparisons via multiple target parameters. This information can be used to drive research into further illuminating putative drug target proteins that would otherwise remain understudied.
A frequent metaphor used in drug discovery is to “not only search under the lamp post” (Oprea, Jan, et al., 2018), meaning that more data, information and knowledge may be accessible outside of the realm of common knowledge. Pharos shows how much common knowledge is available and can help bring the search away from well-studied targets, and further from the well-studied lamppost.
All targets in Pharos are categorized according to their “Target development level” (TDL), a knowledge-based classification for human proteins (Oprea, Bologa, et al., 2018) that can be used to explore the dark genome (Oprea, 2019). In brief, Tclin are proteins via which approved drugs act (i.e., mode-of-action drug targets); Tchem are proteins known to bind small molecules with high potency; Tbio are proteins with well-studied biology, having a fractional publication count (Pletscher-Frankild, Palleja, Tsafou, Binder, & Jensen, 2015) above 5; and Tdark are understudied proteins that do not meet criteria for the above 3 categories, respectively. See Background Information for additional details.
Basic Protocol 1 describes a basic target search, as well as an explanation of several key elements of a target details page, ending with filtering targets related to the original search. Alternate Protocol 1 follows the same steps as Basic Protocol 1, but is focused on a lesser studied target, and discusses some of the differences in detail pages between target knowledge levels. Basic Protocol 2 shows how the entire human proteome can be filtered to zoom in on 5 GPCR (G-protein coupled receptor) proteins annotated by GWAS (Genome-wide association studies) as related to breast cancer, that are expressed in female tissues. This second query illustrates the concept of serendipitous browsing, whereby Pharos can be explored through areas of interest rather than specific targets, an exploration that can lead to interesting results.
Basic Protocol 1 - search for a target and view details
The Pharos web interface is available at https://pharos.nih.gov. The main landing page is focused on the Pharos database search, with subdomains that navigate to pages to browse and filter targets, ligands and diseases.
Necessary Resources
Hardware
Computer with Internet connection
Software
Up-to-date Web browser such as Chrome (recommended), Firefox, or Safari.
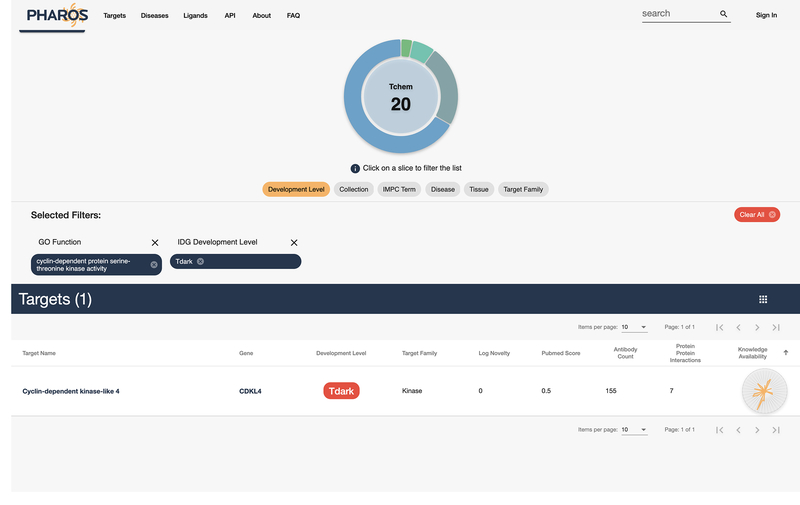
Search for a target
The search function of Pharos uses an autocomplete service to make suggestions as the user types. Several fields are available to provide suggestions: UniProt Gene Symbol, UniProt Name, Target Name, Disease, or OMIM term (Apweiler et al., 2004; Hamosh et al., 2002).
-
1
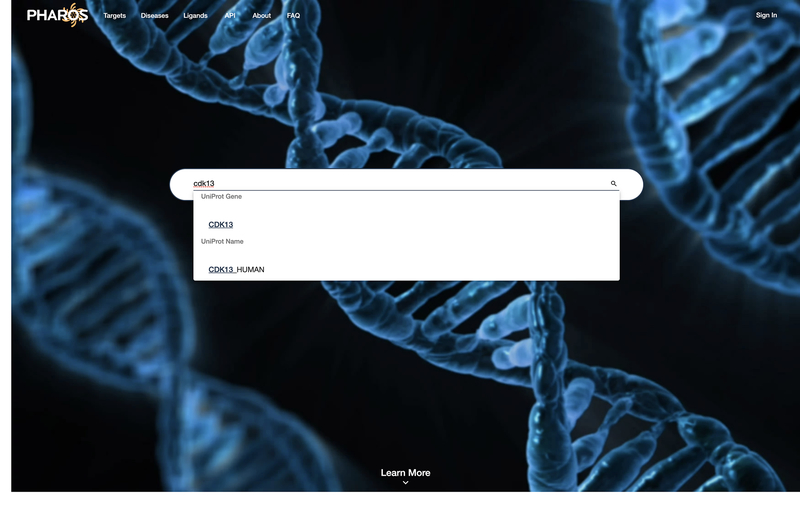
Navigate to https://pharos.nih.gov. Click on the search bar and enter “CDK13” as a query term. Selecting a value from the dropdown will populate the search field with that text, but it is sufficient to enter “CDK13” and press enter or click the magnifying glass icon on the right of the search bar (Fig 1).
Figure 1:
Main search page for Pharos, with autocomplete functionality visible.
View a Search Results Page
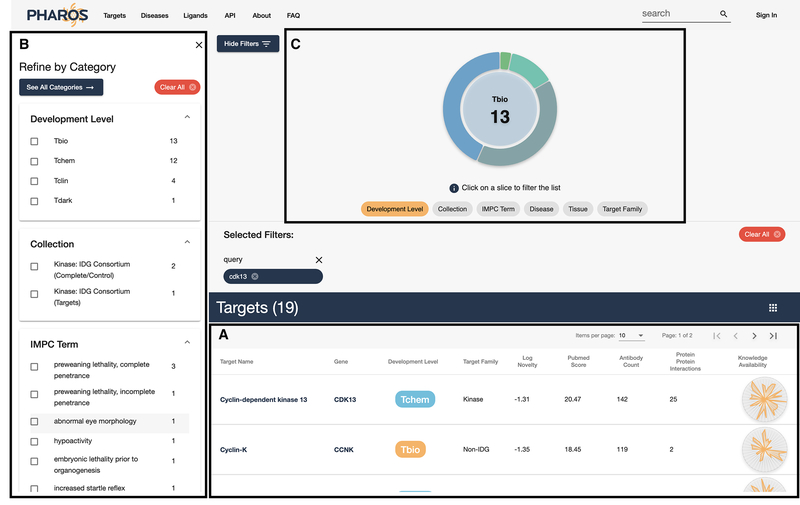
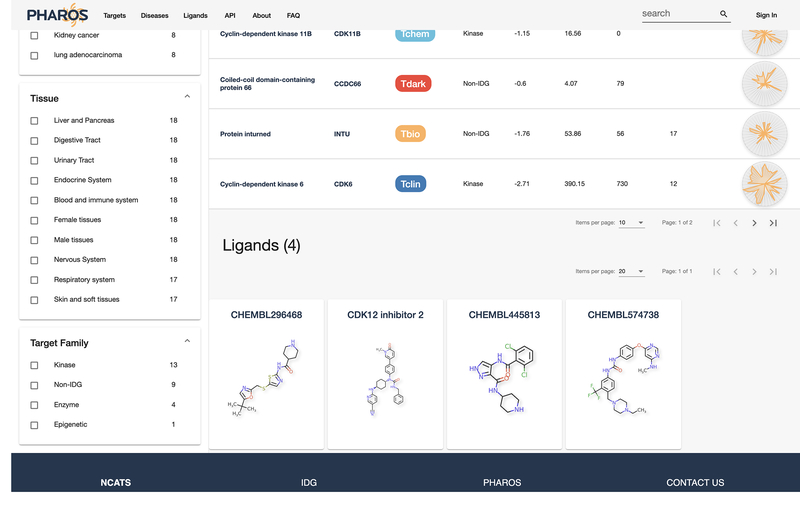
The query results page lists all proteins associated with the searched term, as well as metadata available. This may return a larger list than may be anticipated due to the addition of targets found via text mining algorithms. This results list is further filterable by the use of lists of checkboxes on the left side of the screen, or by sections of the donut chart visible near the top. If applicable, a list of associated ligands, as well as a list of associated diseases, are shown below the pageable targets list. Diseases are searched by name, not by target relationships.
-
2
Scroll down the page to view a list of 19 matched targets, ligands and diseases.
Note: In this example (“CDK13”), no disease results are returned.
Analyze a Tchem target (CDK13)
This query was for a fairly well studied target in order to illustrate some of the core details available. The higher a target is ranked according to TDL, the more information is available on the protein details page.
-
3
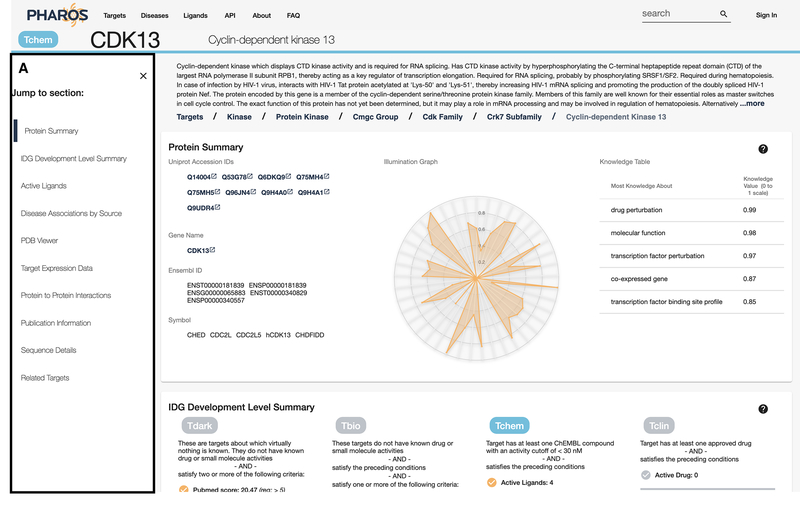
A specific target search should return a table with CDK13 as the first entry. Click on the target name or gene to navigate to the details page. Figure 5 shows the initial target details page, with a target identifier header, gene description (if available), and a breadcrumb of links that subdivide the Drug Target Ontology (Lin et al., 2017) and illustrate the various ontology level that the target belongs to.
Figure 5:
Target details view. The density of sections is dependent on the data available. The left side column (A) acts as section navigation and allows the user to quickly jump to areas of interest.
View the Protein Knowledge Summary
-
4
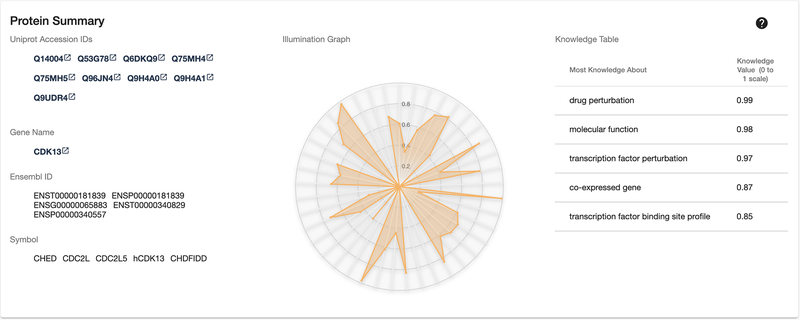
Scroll down the page to view the Protein Summary panel. This panel (Fig. 6) contains several different target identifiers, with links (where available) to the original resource. Also available is an illumination graph and corresponding knowledge table, which collectively illustrate the amount of aggregated knowledge available for a target, and highlights areas with the most knowledge.
-
5
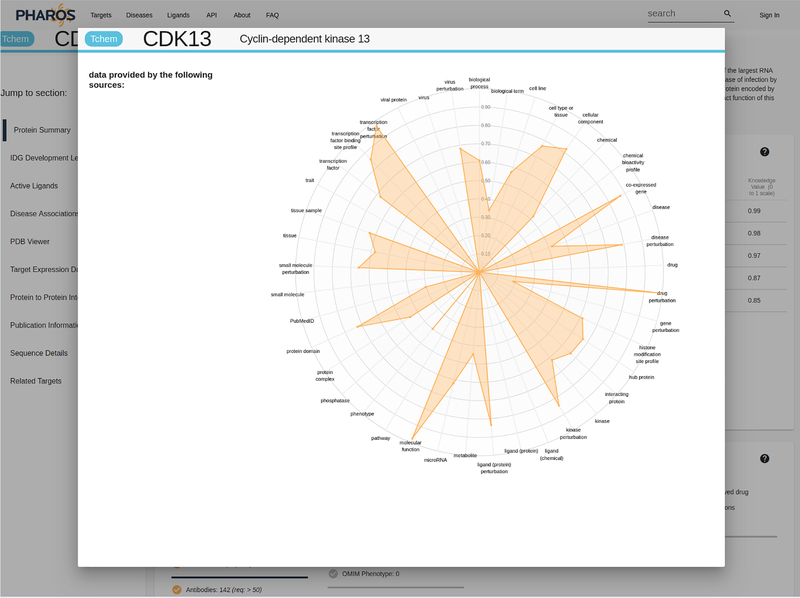
Click on the illumination graph to open up a larger view of the radar chart (Fig. 7), and hover over different apexes to view the relative (0 to 1) value of each parameter, as well as the data sources used to generate this value.
Figure 6:
Target Summary overview with protein and gene identifiers, illumination graph and knowledge table.
Figure 7:
Expanded view of the illumination graph.
View the Development Level Summary
-
6
Scroll down or click on the “IDG Development Level Summary” section on the left side. TDL designations are summarized in the IDG Development Level Summary panel, which is individually displayed for each protein. In this case, the “Tchem” TDL indicates that small molecules are known to modulate this protein (Fig. 8). TDLs range from Tdark, for understudied proteins, to Tclin, which denotes that approved drugs exist for this target (Oprea, Bologa, et al., 2018).
Figure 8:
Development Level Summary shows previous development milestones reached, as well as progress towards incomplete milestones. CDK13 is a Tchem target, which means that multiple active ligands have been discovered, but no approved drugs as of yet. It has also been fairly well published about, both in text-mined PubMed literature reviews, and GeneRIF annotations (Jimeno-Yepes, Sticco, Mork, & Aronson, 2013). Its molecular function (from GO Gene Ontology (Ashburner et al., 2000)) is also fairly well known.
View IDG Generated Resources
-
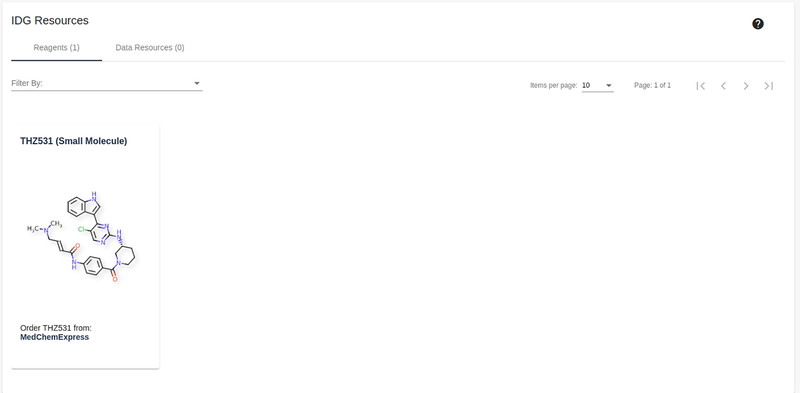
7
Scroll down or click on the “IDG Generated Resources” section on the left side. A pageable list of reagents and datasets generated by IDG consortium members is shown.
Note: Click on the header to navigate to a dataset metadata collection page, the bottom link of the panel redirects to a vendor page for the physical resource, if available.
View Active Ligands
-
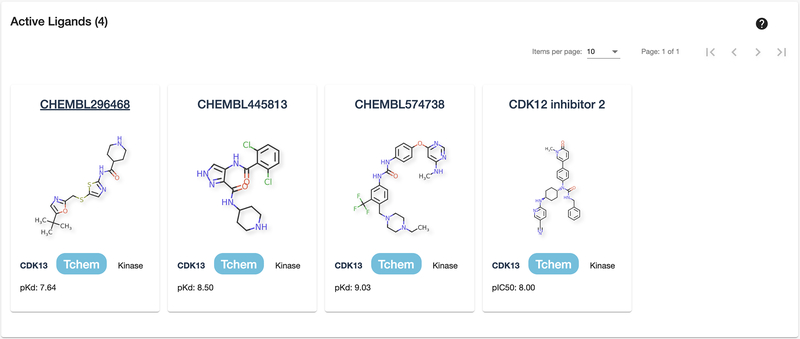
8
Scroll down the page or click on the “Active Ligands” section on the left side. Here is a pageable list of all active ligands associated with a target. For targets with approved drugs, this section will be preceded by a similar Approved Drugs section. Chemical structures are shown, as well as brief target information and the activity level discovered for the target-ligand relationship.
Note: Click on the ligand card to open up a new page with more detailed ligand information, as well as other targets this ligand is active on.
View Disease Associations
-
9
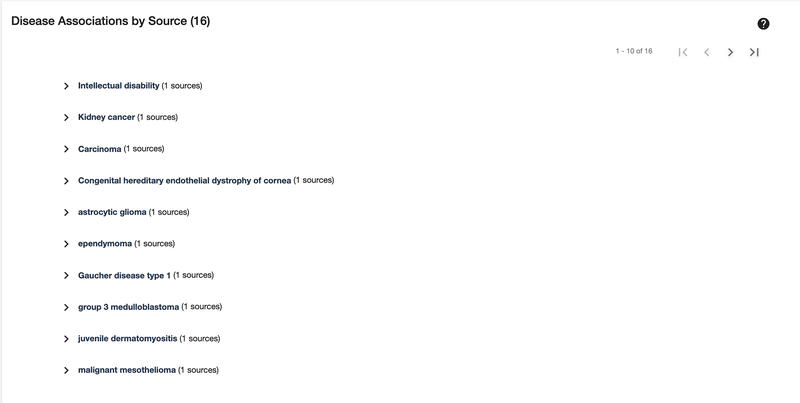
Scroll down or click on the “Disease Associations” section on the left side. Users can explore a pageable list of diseases associated with this target. Click on a disease name to display the data source used to generate this association, as well as the available supporting evidence and confidence values.
View Publication Information
-
10
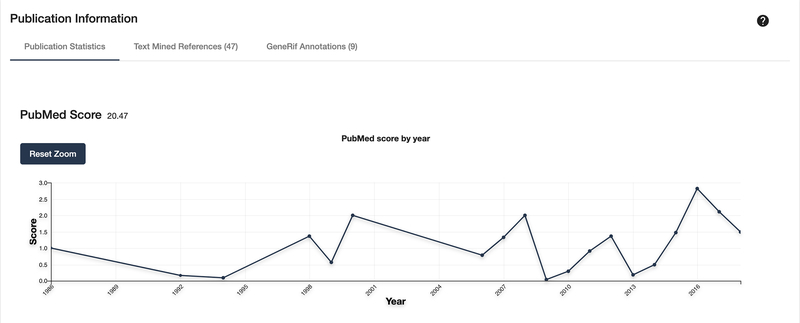
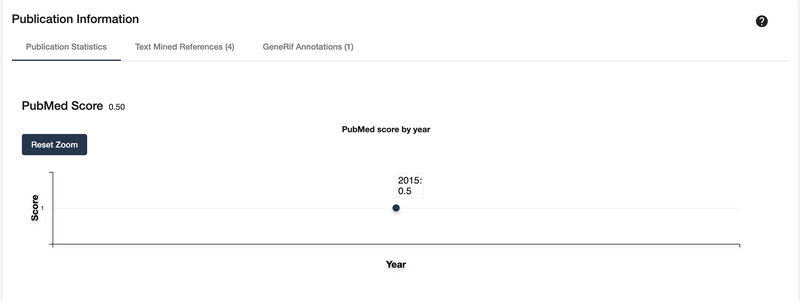
Scroll down or click on the “Publication Information” section on the left side. This panel is composed of 3 tabs. The first tab shows several line charts that display publication trends from various services and measurement matrices. Hover over a point to get a more specific value for the year (Fig. 12).
-
11
Click on the second tab of the Publication information section to view a list of text mined references in which the search target is mentioned, and lastly, click on the third tab to view a list of GeneRIF annotations.
Figure 12:
Shown is one of several available line charts that show the frequency of publication for a target.
Find related targets
-
12
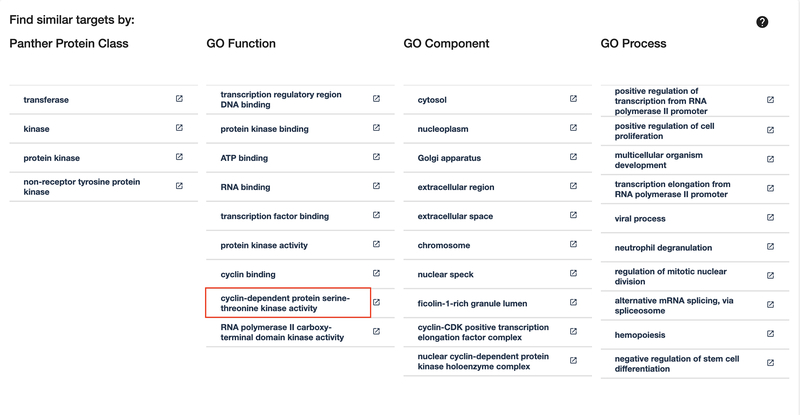
Scroll to the bottom of the page or click the “Related Targets” section of the left side. The final section of the detail page provides links to view a list of targets that share a common property.
-
13
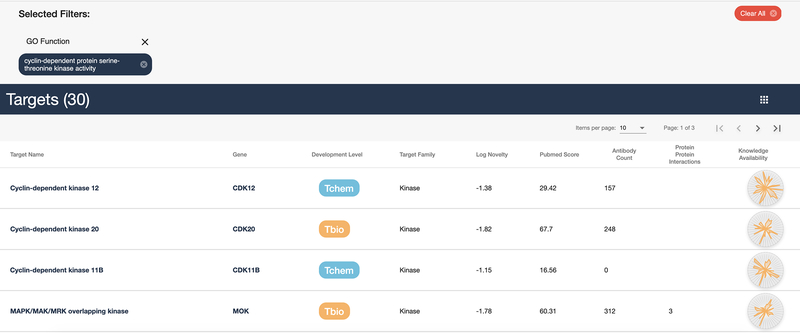
Click on the “cyclin-dependent protein serine-threonine kinase activity” link in the “GO Function” column as shown in Figure 13. The results are shown in Figure 14: a list of 30 targets that share the same GO Function. A common use of these lists is to find similar targets that may be less studied but may be similar enough to aid in drug discovery.
-
14
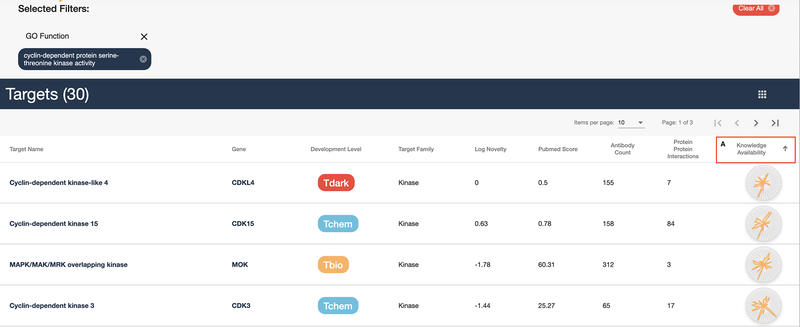
Click on the header of the “Knowledge Availability” column right above the first small illumination chart (Fig. 15). The table is now sorted in ascending order of knowledge availability. This tends to start with darker targets, which may offer unique research opportunities.
Note: Knowledge Availability is not closely linked to target development level, meaning some “dark” targets may have a higher knowledge availability score that a target with an approved drug.
-
15
Alternatively, click on the “Tdark” value in the “Refine by Category” panel, under the “Development Level” subheading (Fig 16). This filters the 30 targets listed down to a single dark target.
Figure 13:
Common target properties are shown, and a link to a list of common targets.
Figure 14:
List of cyclin-dependent protein serine-threonine kinase activity targets as annotated by their GO Function.
Figure 15:
Shows the same list of 30 targets from Figure 14, this time sorted by knowledge availability (A).
Figure 16:
The same list as Figure 14, this time filtered by “Tdark”, leaving 1 target. When more targets are available, it is possible to combine filter values to refine large lists.
16.
Alternate Protocol 1 - search for dark target and view details
Although all targets listed in Pharos are discoverable using the above steps, the details view may be sparser if the query is a dark target. The only Tdark protein related to CDK13 (CDKL4) is used here to highlight a few differences in available sections and knowledge between dark and better studies targets. Compared to CDK13, a well-studied target, there are no approved drugs or active ligands associated with this target, therefore, those panels are absent.
Necessary Resources: See Basic Protocol 1
Following the example outlined in Basic Protocol 1, click the CDKL4 target from the Related Targets menu on the left. Alternatively, follow Basic Protocol 1, and use “CDKL4” as the search query. Figure 17 shows the Illumination graph and knowledge as in the previous example. However, this illumination chart displays several deficiencies in knowledge, which could be directions to focus research on.
Scroll down or click on the “IDG Development Level Summary” section on the left side, which provides an overview of the TDL progression for CDKL4 (Fig. 18).
Scroll down or click on the “Publication Details” section on the left side, Compared to Basic Protocol 1 and CDK13, CDKL4 has minimal publication information available.
Figure 17:
Protein Summary panel of CDKL4, an understudied target.
Figure 18:
IDG Development Level Summary of CDKL4, a dark target.
Basic Protocol 2 - Filter a target list to get refined results
While the most straightforward way to find information about a target is to use the search function, Pharos also provides an interface to browse and search all targets in the human genome. Similar to an e-commerce site, this allows for serendipitous browsing, where the user may be able to discover lesser known targets of significance to a topic of interest. This example will focus on GPCRs in cancer, which are rarely targeted in cancer treatments (Insel et al., 2018; Wu et al., 2019).
Necessary Resources
Hardware
Computer with Internet connection
Software
Up-to-date Web browser such as Chrome (recommended), Firefox, or Safari.
Browse and filter all targets
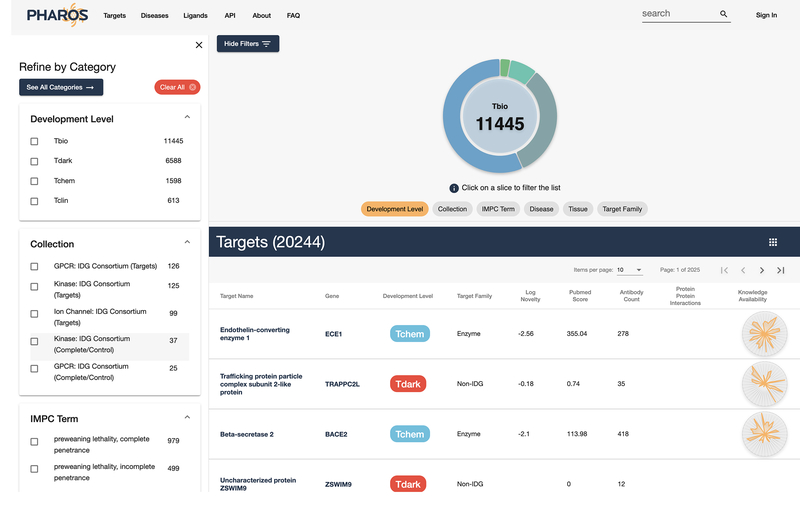
Navigate to https://pharos.nih.gov. Click on the Targets link on the main navigation bar (Fig. 20). A main page to browse and filter targets will be shown (Fig. 21).
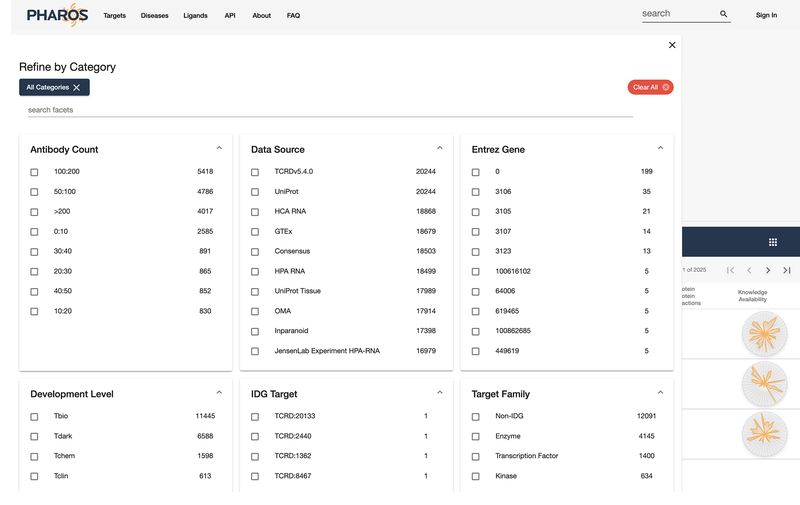
Pharos displays several common filters, but users are not limited to these. Click on the “See All Categories” button to view an expanded range of filters. Figure 21 shows the main target browse page, and Figure 22 shows the expanded filter category panel.
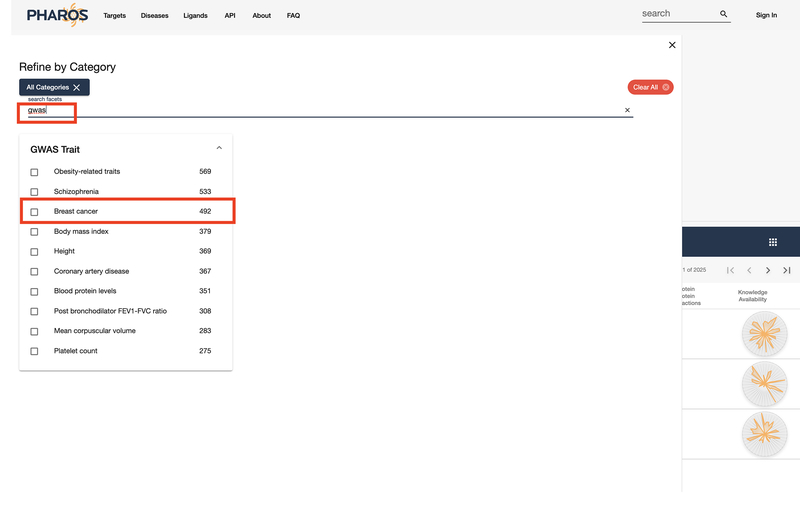
Enter “GWAS” as a search term in order to refine the categories.
Select “Breast Cancer” from the list of possible GWAS traits (Fig 23).
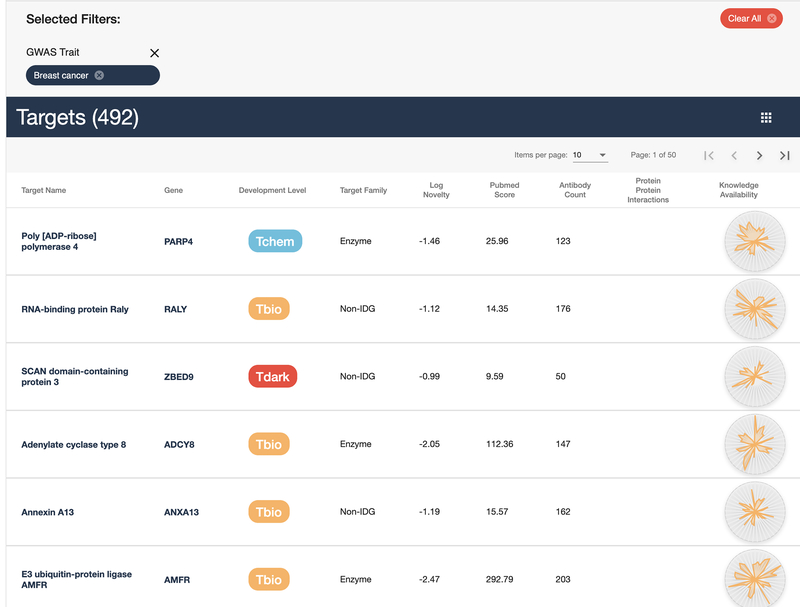
Click the “All Categories” button under the “Refine Categories” header to minimize the category list. The initial list of 20244 targets has been reduced to 492 targets (Fig. 24).
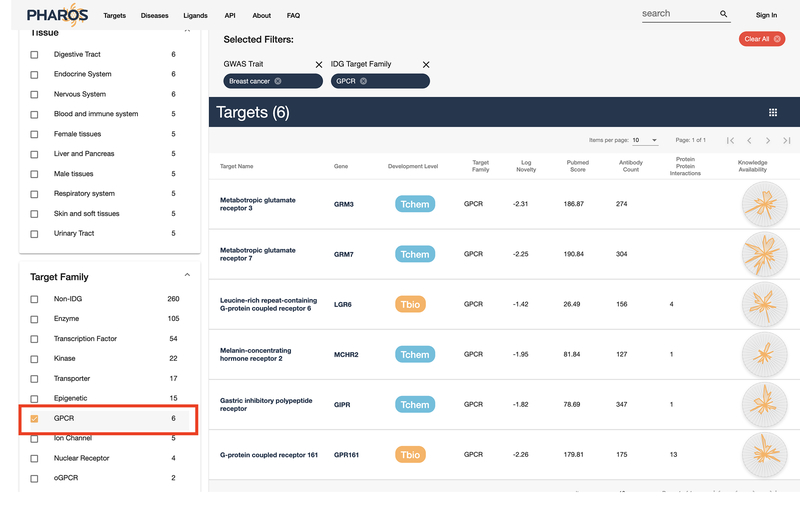
This list can be further refined to filter out GPCRs, the target family of interest. Scroll down the filter panel on the side. Select the “GPCR” value from the “Target Family” panel. The list is reduced from 492 targets to just 6 (Fig. 25).
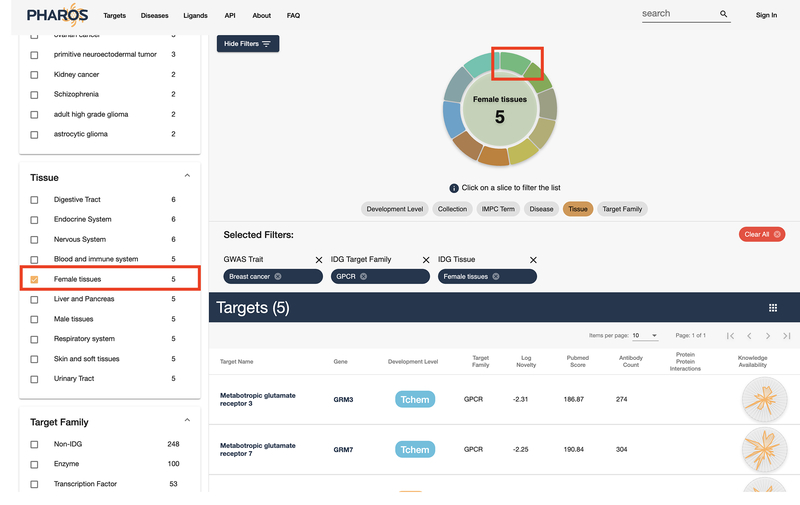
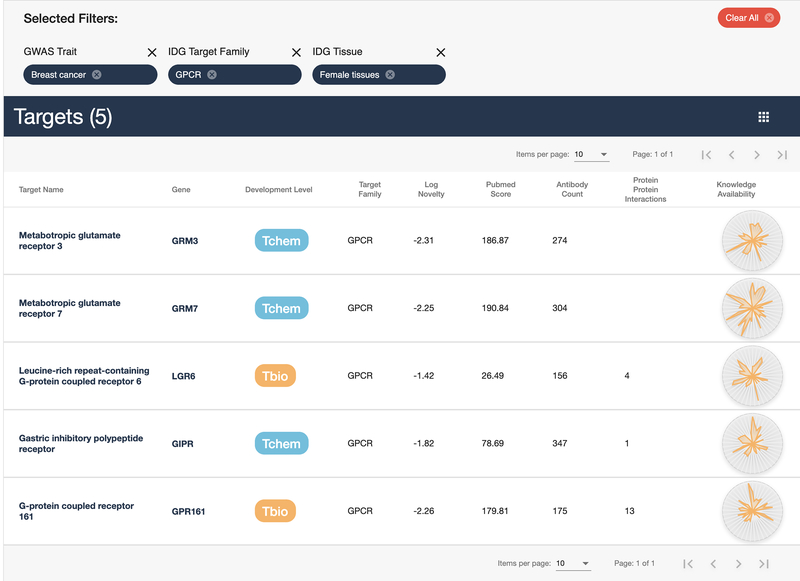
While a list with 6 targets is manageable, it may be further refined. This step will use a different filter interface. Select the Tissue button underneath the donut chart above the target list, then click the wedge that corresponds to “Female Tissues” (Fig. 26). The list has been reduced by 1, with 5 GPCR targets annotated by GWAS to be related to breast cancer, that are also expressed in female tissues (Fig. 27) remaining.
Figure 20:
Navigation bar header as seen on the Pharos home page. Subsequent pages within Pharos will lack the background image.
Figure 21:
Main target browse page
Figure 22:
Expanded filter category panel.
Figure 23:
Refined category filter list.
Figure 24:
Target list reduced from 20244 to 492 targets.
Figure 25:
Select “GPCR” from target family to further reduce the list.
Figure 26:
The donut chart above the target list can also be used to filter results.
Figure 27:
Final list of 5 GPCR targets with “breast cancer” as a GWAS trait that are expressed in female tissues.
Guideline for Understanding Results
Basic Protocol 1 and Alternate Protocol 1
The anticipated results from Basic Protocol 1 and Alternate Protocol 1 are an in-depth view of aggregated protein information and knowledge. This aggregated set, which is by no means exhaustive, can still act as a barometer to illustrate the amount and frequency of data, information and knowledge generated by the scientific community about a protein, and aid in the process of target selection and validation. Researchers can use this information to guide the early drug discovery process and focus on novel targets or re-evaluate previously more studied targets in an integrative manner. Program staff can help guide research into areas of need as well and avoid studies of targets that have fairly saturated the research landscape.
Basic Protocol 2
Basic Protocol 2 generates a list of related targets based on text mined, aggregated relationships. Subsequent literature searches may be helpful to validate or repudiate a relationship between targets, or between a target and a disease or ligand. For example, a quick literature search of the targets listed in Basic Protocol 2 revealed that one of the Tbio targets (GPR161) is ‘an important regulator and a potential drug target for triple-negative breast cancer’(Feigin, Xue, Hammell, & Muthuswamy, 2014). Thus, Pharos may provide useful starting points for scientists interested in novel targets to study.
While filtering targets, there are a multitude of ways to subdivide the target lists. Pharos makes attempts to minimize the ability to filter by unrelated values, e.g., Tdark targets by ligand activity, by removing filters in which no values will be returned. Should 0 results be returned, facets can be removed to broaden the search.
Commentary
Background Information
The process of information aggregation and display for in-depth biomedical data is not unique to Pharos. Open Targets (Koscielny et al., 2017), GeneCards (Rebhan, Chalifa-Caspi, Prilusky, & Lancet, 1997), OMIM and GO all perform similar functions, though each has a different emphasis. What sets Pharos apart is the ranking of targets by TDL, and the ease of identification of dark targets. Another unique characteristic is the ability to browse and filter the entire curated human proteome. While paging through 20,244 proteins may not initially be fruitful, the ability to filter and refine the entire proteome to a more actionable list has major potential with respect to comparative analyses, leading to novel suggestions that may help illuminate novel drug targets, thus aiding the drug discovery process. None of the above-listed resources offer a knowledge-based classification for proteins, or the ability to browse and filter target lists. By focusing on the philosophical concept of ranking and knowledge summaries, Pharos offers a unique contribution to a wealth of useful resources.
Illuminating the Druggable Genome History
The druggable genome was described as ‘the subset of the ~30,000 genes in the human genome that express proteins potentially able to bind drug-like molecules’ (Hopkins & Groom, 2002). However, since the mapping of the human genome, research has not moved past the study of the same genes known before the mapping was completed (Edwards et al., 2011). The NIH, therefore, started the Illuminating the Druggable Genome (IDG) program (Rodgers et al., 2018) in order to improve our understanding of the properties and functions of proteins that are currently not well studied within commonly drug-targeted protein families (Oprea, Bologa, et al., 2018). The IDG collated data from over 60 sources (Nguyen et al., 2017), which is released as the Target Central Resource Database (TCRD). Pharos is a web-based platform to browse and analyze the data contained within the TCRD.
Target Development Level Ranking Details
The TCRD ranks targets based on several scores, and these rankings are also used in Pharos. There are 4 distinct target development levels used in Pharos: Tdark, Tbio, Tchem, and Tclin (Oprea, Bologa, et al., 2018). Tdark targets have minimal knowledge about them. Tbio targets are targets that have been referenced in literature, have GeneRIF annotations, antibodies and molecular or biological function data and phenotypes. Tchem targets have all of the preceding values, as well as active ligands. Tclin targets are targets with approved drugs available.
Ligand Activity Cutoffs
To be displayed as an active ligand in Pharos, a ligand:
must have a pChEMBL value (i.e. a -Log M value)
must be from a binding assay
must have a MOL structure type
must have a target type of SINGLE_PROTEIN
must have standard_flag = 1 and exact standard_relation (i.e. no > 10uM type values)
must be associated with a publication
- must pass family-specific thresholds:
- Kinases: ≤ 30nM
- GPCRs: ≤ 100nM
- Nuclear Receptors: ≤ 100nM
- Ion Channels: ≤ 10μM
- Others: ≤ 1μM
Critical Parameters and Troubleshooting
There are very few parameters that are settable by users. The length of the results table can be modified to minimize paging.
Search results can take some time in assessing. For example, a user entering a specific target would not expect to see a long list of results, but more target connections are returned due to the use of text mining.
As Pharos is a web-based site, with a REST API, there may be times where web traffic is especially heavy and may decrease performance of Pharos. There are several methods to contact the Pharos team listed on the site, should a user experience frequent problem.
Pharos is also a database consisting of external data. While every effort has been made to ensure high quality, datasets are imported from external sources, analyzed, and returned, and it is possible that errors may be introduced anywhere within this workflow. Again, should inconsistencies be discovered, the Pharos team is available through several methods of communication.
Figure 2:
Primary Search results/browse page layout. Main results are in a pageable table (A). The left-hand column (B) contains multiple fields to filter on, similar to an e-commerce site. The donut chart on the top half of the screen (C) also shows a proportional breakdown of the filterable properties and is also interactive.
Figure 3:
Brief metadata is available for each target, which includes several identifiers such as: Target development level, TDL (Oprea, Bologa, et al., 2018), target family, computed target novelty (TIN-X) score (Cannon et al., 2017), fractional publication count (Pletscher-Frankild, Palleja, Tsafou, Binder, & Jensen, 2015), available antibodies (from antibodypedia.com), listed protein-protein interactions (Fabregat et al., 2016; Huttlin et al., 2017; Szklarczyk et al., 2019) and knowledge availability (based on Harmonizome (Rouillard et al., 2016)).
Figure 4:
Relevant diseases and ligands are displayed in separate pageable lists.
Figure 9:
Resources available from research funded by the IDG program
Figure 10:
Active Ligands section.
Figure 11:
Collapsed disease associations view
Figure 19:
Sparse publication information of a dark target
References
- Apweiler R, Bairoch A, Wu CH, Barker WC, Boeckmann B, Ferro S, … Yeh LS (2004). UniProt: the Universal Protein knowledgebase. Nucleic Acids Res, 32(Database issue), D115–119. doi: 10.1093/nar/gkh131 [DOI] [PMC free article] [PubMed] [Google Scholar]
- Ashburner M, Ball CA, Blake JA, Botstein D, Butler H, Cherry JM, … Sherlock G (2000). Gene ontology: tool for the unification of biology. The Gene Ontology Consortium. Nat Genet, 25(1), 25–29. doi: 10.1038/75556 [DOI] [PMC free article] [PubMed] [Google Scholar]
- Cannon DC, Yang JJ, Mathias SL, Ursu O, Mani S, Waller A, … Oprea TI (2017). TIN-X: target importance and novelty explorer. Bioinformatics, 33(16), 2601–2603. doi: 10.1093/bioinformatics/btx200 [DOI] [PMC free article] [PubMed] [Google Scholar]
- Edwards AM, Isserlin R, Bader GD, Frye SV, Willson TM, & Yu FH (2011). Too many roads not taken. Nature, 470(7333), 163–165. doi: 10.1038/470163a [DOI] [PubMed] [Google Scholar]
- Fabregat A, Sidiropoulos K, Garapati P, Gillespie M, Hausmann K, Haw R, … D’Eustachio P (2016). The Reactome pathway Knowledgebase. Nucleic Acids Res, 44(D1), D481–487. doi: 10.1093/nar/gkv1351 [DOI] [PMC free article] [PubMed] [Google Scholar]
- Feigin ME, Xue B, Hammell MC, & Muthuswamy SK (2014). G-protein-coupled receptor GPR161 is overexpressed in breast cancer and is a promoter of cell proliferation and invasion. Proc Natl Acad Sci U S A, 111(11), 4191–4196. doi: 10.1073/pnas.1320239111 [DOI] [PMC free article] [PubMed] [Google Scholar]
- Hamosh A, Scott AF, Amberger J, Bocchini C, Valle D, & McKusick VA (2002). Online Mendelian Inheritance in Man (OMIM), a knowledgebase of human genes and genetic disorders. Nucleic Acids Res, 30(1), 52–55. doi: 10.1093/nar/30.1.52 [DOI] [PMC free article] [PubMed] [Google Scholar]
- Hopkins AL, & Groom CR (2002). The druggable genome. Nat Rev Drug Discov, 1(9), 727–730. doi: 10.1038/nrd892 [DOI] [PubMed] [Google Scholar]
- Huttlin EL, Bruckner RJ, Paulo JA, Cannon JR, Ting L, Baltier K, … Harper JW (2017). Architecture of the human interactome defines protein communities and disease networks. Nature, 545(7655), 505–509. doi: 10.1038/nature22366 [DOI] [PMC free article] [PubMed] [Google Scholar]
- Insel PA, Sriram K, Wiley SZ, Wilderman A, Katakia T, McCann T, … Murray F (2018). GPCRomics: GPCR Expression in Cancer Cells and Tumors Identifies New, Potential Biomarkers and Therapeutic Targets. Front Pharmacol, 9, 431. doi: 10.3389/fphar.2018.00431 [DOI] [PMC free article] [PubMed] [Google Scholar]
- Jimeno-Yepes AJ, Sticco JC, Mork JG, & Aronson AR (2013). GeneRIF indexing: sentence selection based on machine learning. BMC Bioinformatics, 14, 171. doi: 10.1186/1471-2105-14-171 [DOI] [PMC free article] [PubMed] [Google Scholar]
- Koscielny G, An P, Carvalho-Silva D, Cham JA, Fumis L, Gasparyan R, … Dunham I (2017). Open Targets: a platform for therapeutic target identification and validation. Nucleic Acids Res, 45(D1), D985–d994. doi: 10.1093/nar/gkw1055 [DOI] [PMC free article] [PubMed] [Google Scholar]
- Lin Y, Mehta S, Kucuk-McGinty H, Turner JP, Vidovic D, Forlin M, … Schurer SC (2017). Drug target ontology to classify and integrate drug discovery data. J Biomed Semantics, 8(1), 50. doi: 10.1186/s13326-017-0161-x [DOI] [PMC free article] [PubMed] [Google Scholar]
- Nguyen DT, Mathias S, Bologa C, Brunak S, Fernandez N, Gaulton A, … Guha R (2017). Pharos: Collating protein information to shed light on the druggable genome. Nucleic Acids Res, 45(D1), D995–d1002. doi: 10.1093/nar/gkw1072 [DOI] [PMC free article] [PubMed] [Google Scholar]
- Oprea TI (2019). Exploring the dark genome: implications for precision medicine. Mammalian Genome, 30(7–8), 192–200. doi: 10.1007/s00335-019-09809-0 [DOI] [PMC free article] [PubMed] [Google Scholar]
- Oprea TI, Bologa CG, Brunak S, Campbell A, Gan GN, Gaulton A, … Zahoranszky-Kohalmi G (2018). Unexplored therapeutic opportunities in the human genome. Nat Rev Drug Discov, 17(5), 317–332. doi: 10.1038/nrd.2018.14 [DOI] [PMC free article] [PubMed] [Google Scholar]
- Oprea TI, Jan L, Johnson GL, Roth BL, Ma’ayan A, Schurer S, … McManus MT (2018). Far away from the lamppost. PLoS Biol, 16(12), e3000067. doi: 10.1371/journal.pbio.3000067 [DOI] [PMC free article] [PubMed] [Google Scholar]
- Pletscher-Frankild S, Palleja A, Tsafou K, Binder JX, & Jensen LJ (2015). DISEASES: text mining and data integration of disease-gene associations. Methods, 74, 83–89. doi: 10.1016/j.ymeth.2014.11.020 [DOI] [PubMed] [Google Scholar]
- Rebhan M, Chalifa-Caspi V, Prilusky J, & Lancet D (1997). GeneCards: integrating information about genes, proteins and diseases. Trends Genet, 13(4), 163. doi: 10.1016/s0168-9525(97)01103-7 [DOI] [PubMed] [Google Scholar]
- Rodgers G, Austin C, Anderson J, Pawlyk A, Colvis C, Margolis R, & Baker J (2018). Glimmers in illuminating the druggable genome. Nat Rev Drug Discov, 17(5), 301–302. doi: 10.1038/nrd.2017.252 [DOI] [PMC free article] [PubMed] [Google Scholar]
- Rouillard AD, Gundersen GW, Fernandez NF, Wang Z, Monteiro CD, McDermott MG, & Ma’ayan A (2016). The harmonizome: a collection of processed datasets gathered to serve and mine knowledge about genes and proteins. Database (Oxford), 2016. doi: 10.1093/database/baw100 [DOI] [PMC free article] [PubMed] [Google Scholar]
- Szklarczyk D, Gable AL, Lyon D, Junge A, Wyder S, Huerta-Cepas J, … Mering CV (2019). STRING v11: protein-protein association networks with increased coverage, supporting functional discovery in genome-wide experimental datasets. Nucleic Acids Res, 47(D1), D607–d613. doi: 10.1093/nar/gky1131 [DOI] [PMC free article] [PubMed] [Google Scholar]
- Wu V, Yeerna H, Nohata N, Chiou J, Harismendy O, Raimondi F, … Gutkind JS (2019). Illuminating the Onco-GPCRome: Novel G protein-coupled receptor-driven oncocrine networks and targets for cancer immunotherapy. J Biol Chem, 294(29), 11062–11086. doi: 10.1074/jbc.REV119.005601 [DOI] [PMC free article] [PubMed] [Google Scholar]


