

1.
To the Editor,
Asthma is a heterogeneous disease encompassing several distinct sub‐phenotypes with different etiologies and treatment responses, 1 but we are lacking markers to differentiate patient subgroups.
MicroRNAs (miRNAs) can regulate gene expression post‐transcriptionally. Due to their high stability in body fluids, their easy detection, and their functional relevance in asthma, we and others have proposed extracellular miRNAs in noninvasive clinical samples as biomarkers for asthma. 2 , 3 Yet, extracellular miRNA profiles can be confounded by unspecific release of miRNAs from dying cells. Transfer of miRNAs by extracellular vesicles (EVs) is, however, supposedly a selective communication mechanism, 4 and EV‐miRNA levels have been shown to be altered in bronchoalveolar lavage (BAL) fluid of patients with asthma. 5 In this pilot study, we profiled the EV‐miRNA signature in plasma of patients with mild‐to‐moderate (AM) or severe eosinophilic asthma (AS) (as defined by ERS/ATS guidelines 6 ) and healthy control (HC) subjects (Tables S1 and S2).
Therefore, we isolated small EVs (EVs) (<200 nm) by size exclusion chromatography (SEC) (qEV, Izon Bioscience) from 1 mL plasma of 45 adult subjects with AM (n = 15) or AS (n = 14), and HC (n = 16) (Table S1). All study participants were enrolled in the all age asthma (ALLIANCE) cohort, a multi‐center longitudinal asthma patient cohort of the German Center for Lung Research (DZL). 7
SEC‐isolated particles were confirmed to be <200 nm by nanoparticle tracking analysis (NTA) (ZetaView PMX 110, Particle Metrix) and were equal in concentration and size distribution across groups (Figure 1A). The median particle concentration isolated from 1 mL of plasma was 8.6 × 10⁹ particles/mL (interquartile range [IQR]: 4.5 × 10⁹‐1.4 × 10¹⁰) for HC, 1.2 × 10¹⁰ particles/mL (IQR: 6.6 × 10⁹‐2.8 × 10¹⁰) for AM, and 1.0 × 10¹⁰ particles/mL (IQR: 3.9 × 10⁹‐3.6 × 10¹⁰) for AS. Furthermore, SEC fractions 7‐9 used for sequencing were without protein contamination (Figure 1B) and expressed different amounts of typical small EV markers CD63, CD81, and/or CD9 (Figure S1).
FIGURE 1.
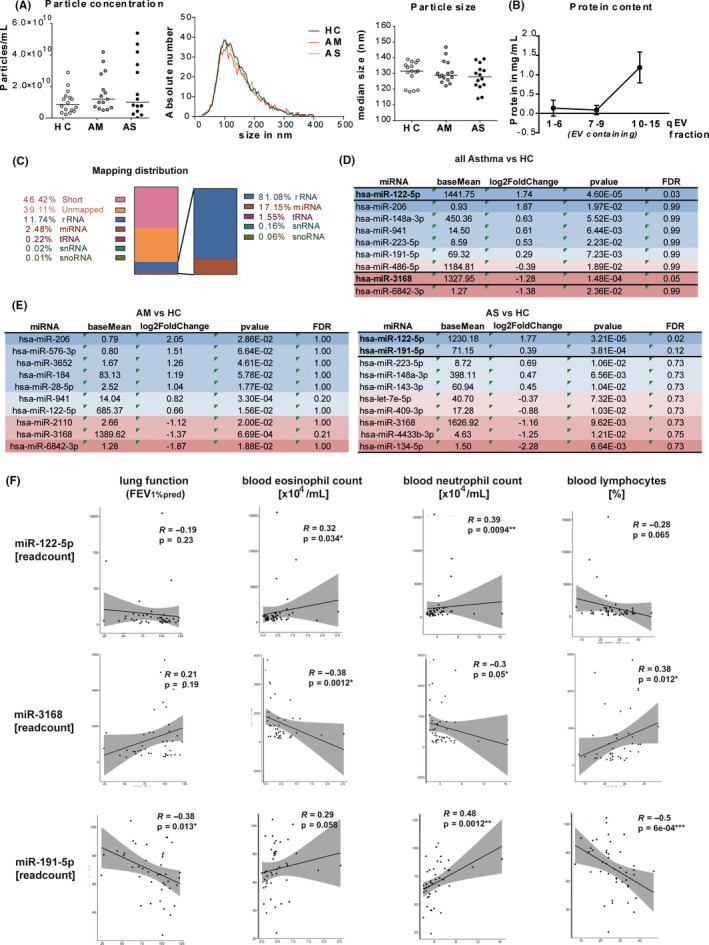
small RNA sequencing from plasma EVs. A, EV concentration (left panel), size distribution, and median size (right panels) in plasma EV isolations from healthy controls (HC, n = 16), mild‐to‐moderate (AM, n = 15), or severe asthma (AS, n = 14) assessed by nanoparticle tracking analysis (lines represent median). B, Protein content of qEV fractions in mg/mL, assessed by microBCA (n = 45 per fraction, mean ± SD). C, Sequencing distribution of small RNA classes in %, with relative distribution within mapped reads (right) (D and E) 10 top‐regulated miRNAs (sorted by log2 fold change) in asthma patients vs HC (D) and AM vs HC (left) and AS vs HC (right) (E); FDR = false discovery rate. F, Spearman's correlations of miR‐122‐5p (upper panels), miR‐3168 (middle panels), and miR‐191‐5p (lower panels) read counts with clinical characteristics of all included subjects (n = 45), and each graph depicts correlation co‐efficient R and P‐value
EV‐RNA was isolated (miRNeasy Micro Kit; Qiagen) and subjected to RNA sequencing (RNA‐seq) (HiSeq 2500, Illumina) of small RNAs (below 35 nt) according to Ref.8 While all samples achieved high Phred scores (>30) indicating excellent sequencing quality (Figure S2A), 46.42% of reads were short or unmapped (39.11%) (Figure 1C). From all mapped reads, 17.15% were classified as miRNAs, while 81.08% were ribosomal RNAs. In total, we detected 139 distinct EV miRNAs with ≥10 reads (AM: 115; AS: 114; HC: 128) (Figure S2B, Tables S3‐S5), and 35 of which had read counts ≥ 50. Unsupervised clustering and principal component analysis did not separate the different groups (Figure S2C, D), indicating that there is no difference between asthma patients and healthy controls based on total EV‐miRNA expression. However, miR‐122‐5p was significantly increased in all patients with asthma (log2 fold change (log2FC) = 1.74, false discovery rate (FDR) = 0.03) and in AS (log2FC = 1.77, FDR = 0.02) compared with healthy controls, while miR‐3168 was decreased (log2FC = −1.28; FDR = 0.05) (Figure 1D). In AS, we found similar trend for miR‐191‐5p (log2FC = 0.39, FDR = 0.12) (Figure 1E).
In a bivariate analysis, miR‐191‐5p normalized read counts correlated negatively with FEV1%pred (Spearman's R = −.38; P = .013) and lymphocyte percentage in blood (R = −.5; P = .0006) (Figure 1F). We found a positive correlation with blood neutrophil (R = .48; P = .0012) counts and a similar trend for blood eosinophil counts (R = .29; P = .058). miR‐3168 read counts correlated significantly with blood eosinophils (R = −.28, P = .012), neutrophils (R = −.3, P = .05), and lymphocytes (R = .38, P = .012). Read counts of miR‐122‐5p positively correlated with both eosinophil (R = .32; P = .034) and neutrophil (R = .39; P = .0094) counts in blood, and trendwise with blood lymphocytes (R = −.28; P = .065) (Figure 1F). We do acknowledge that some correlation coefficients are quite low (R < .3) which could be due to the small sample size and needs to be confirmed in larger future studies.
Next, we isolated EVs from additional plasma samples of the same subjects and 10 new subjects per group (Figure 2A), and found a strong trend for an increase of miR‐122‐5p (FC = 1.84; P = .07) in severe asthma, and in all asthma subjects (FC = 1.96; P = .09) (Figure 2A) by RT‐qPCR, confirming the sequencing results. miR‐191‐5p did not differ significantly among the groups, and miR‐3168 was not detectable by RT‐qPCR. Of note, in a pilot approach both miRNAs could also be detected in EVs isolated from sputum supernatant samples of four healthy control and ten asthma subjects, and we have a first hint that they are increased in asthma compared with healthy controls (miR‐122‐5p: FC = 2.90; P = .014; miR‐191‐5p: FC = 2.69, P = .014) (Figure 2B).
FIGURE 2.
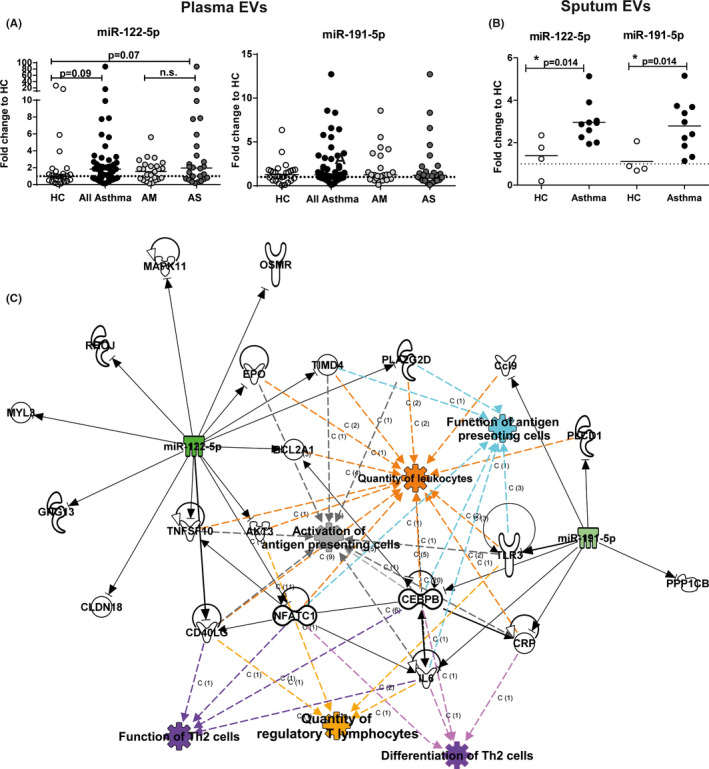
EV‐miRNA from plasma correlates with clinical characteristics of asthma. A and B, RT‐qPCR for miR‐122‐5p and miR‐191‐5p normalized to miR‐21 levels (reference) in (A) plasma EVs from healthy controls (HC, n = 26), all asthma (n = 51), mild‐to‐moderate (AM, n = 25) or severe asthma (AS, n = 26), or (B) sputum supernatant EVs from healthy controls (HC, n = 4) and patients with asthma (n = 10). All Mann–Whitney U to HC or AM. *P ≤ .05, **P ≤ .01, ***P ≤ .001. Graphs depict fold changes to healthy controls with lines indicating the median. (C) Ingenuity pathway analysis showing association of miR‐122‐5p and miR‐191‐5p with quantity of leukocytes, function of antigen‐presenting cells, activation of antigen‐presenting cells, function of Th2 cells, quantity of regulatory T lymphocytes, and differentiation of Th2 cells
Ingenuity Pathway Analysis (IPA) of predicted targets of miR‐122‐5p and miR‐191‐5p revealed a concise network, containing the biological functions quantity of leukocytes, function of antigen‐presenting cells, activation of antigen‐presenting cells, function of Th2 cells, quantity of regulatory T lymphocytes, and differentiation of Th2 cells (Figure 2C). This is a first hint that miR‐122‐5p (and potentially miR‐191‐5p) could influence immune cell function upon uptake. This could systemically perpetuate the asthmatic phenotype and should be confirmed in larger studies, where also the specificity for asthma vs a general immune reaction should be assessed.
The relatively low number of significantly altered miRNAs here might be due to the isolation of highly pure EVs by SEC. This is in line with previous reports, 8 but SEC isolation is superior to other methods in separating EVs from contaminating proteins. 9 Further, we have here focused on eosinophilic asthma of different severities, hampering comparisons of different asthma sub‐phenotypes. This will require considerably larger patient numbers and was thus beyond the scope of this study.
In summary, in relatively well‐controlled asthma the total miRNA expression in plasma EVs is not different to controls. miR‐122‐5p is increased in plasma and sputum supernatant EVs derived from patients with (severe) asthma, and this miRNA correlated with immune cell types in the blood. Combined with the IPA‐predicted role in lymphocyte differentiation and function, it is intriguing to speculate that this miRNA can sub‐differentiate different forms of asthma, such as neutrophilic from eosinophilic asthma. This should be investigated in larger asthma cohort studies with a broad spectrum of clinically well‐defined phenotypes and different treatment regimen also including steroid‐naïve patients.
CONFLICT OF INTEREST
This study was supported by an unrestricted grant (Next Generation Award) from Bencard Allergie GmbH to SB, which did not influence the content of the manuscript or the conclusions drawn. The authors declare no further conflict of interest relating to this manuscript.
AUTHOR CONTRIBUTIONS
TB, HW, A‐MK, FP, BW, OF E.vM., KFR, GH, and MVK designed and conducted the clinical study including patient recruitment and processing of plasma samples. DB, MWP, J.B, S.K‐E., and SB performed experiments and critically analyzed the data. IRK performed the bivariate analysis with clinical data. SB had primary responsibility for the experimental study design and writing of the manuscript. All authors have contributed to discussion of the data and writing of the manuscript, and approved the final version.
Funding information
This study was supported by an unrestricted grant (Next Generation Award; Bencard Allergie GmbH) to SB The general costs of patient recruitment and study procedures are covered by unrestricted grants of the German Federal Ministry of Education and Research (BMBF) as part of the funding of the German Center for Lung Research (DZL) (for further details please see Ref. 7).
ETHICAL APPROVAL
The study was approved by the local ethics committee of the Medical School Luebeck, Schleswig‐Holstein (Germany, Az. 12‐215), and is registered at clinicaltrials.gov (Identifier: NCT02419274). All participants gave their written informed consent.
REFERENCES
- 1. Wenzel SE. Asthma phenotypes: the evolution from clinical to molecular approaches. Nat Med. 2012;18:716‐725. [DOI] [PubMed] [Google Scholar]
- 2. Heffler E, Allegra A, Pioggia G, Picardi G, Musolino C, Gangemi S. MicroRNA profiling in asthma: potential biomarkers and therapeutic targets. Am J Respir Cell Mol Biol. 2017;57:642‐650. [DOI] [PubMed] [Google Scholar]
- 3. Milger K, Götschke J, Krause L, et al. Identification of a plasma miRNA biomarker signature for allergic asthma: a translational approach. Allergy. 2017;72(12):1962‐1971. [DOI] [PubMed] [Google Scholar]
- 4. Valadi H, Ekström K, Bossios A, Sjöstrand M, Lee JJ, Lötvall JO. Exosome‐mediated transfer of mRNAs and microRNAs is a novel mechanism of genetic exchange between cells. Nat Cell Biol. 2007;9:654‐659. [DOI] [PubMed] [Google Scholar]
- 5. Levänen B, Bhakta NR, Torregrosa Paredes P, et al. Altered microRNA profiles in bronchoalveolar lavage fluid exosomes in asthmatic patients. J Allergy Clin Immunol. 2013;131(3):894‐903. [DOI] [PMC free article] [PubMed] [Google Scholar]
- 6. Chung KF, Wenzel SE, Brozek JL, et al. International ERS/ATS guidelines on definition, evaluation and treatment of severe asthma. Eur Respir J. 2014;43:343‐373. [DOI] [PubMed] [Google Scholar]
- 7. Fuchs O, Bahmer T, Weckmann M, et al. The all age asthma cohort (ALLIANCE) ‐ from early beginnings to chronic disease: a longitudinal cohort study. BMC Pulm Med. 2018;18:140. [DOI] [PMC free article] [PubMed] [Google Scholar]
- 8. Buschmann D, Kirchner B, Hermann S, et al. Evaluation of serum extracellular vesicle isolation methods for profiling miRNAs by next‐generation sequencing. J Extracell Vesicles 2018;7:1481321. [DOI] [PMC free article] [PubMed] [Google Scholar]
- 9. Stranska R, Gysbrechts L, Wouters J, et al. Comparison of membrane affinity‐based method with size‐exclusion chromatography for isolation of exosome‐like vesicles from human plasma. J Transl Med. 2018;16:1. [DOI] [PMC free article] [PubMed] [Google Scholar]
Supporting information
Appendix S1
ACKNOWLEDGMENTS
The authors thank all included patients for their contribution. Furthermore, we thank Regine Wieland, Petra Hundack‐Winter, Susann Prange, Vera Veith, and Lukas Hundack for their excellent support in patient recruitment and study logistics.
Thomas Bahmer and Susanne Krauss‐Etschmann contributed equally to this study.
Associated Data
This section collects any data citations, data availability statements, or supplementary materials included in this article.
Supplementary Materials
Appendix S1