Figure 5.

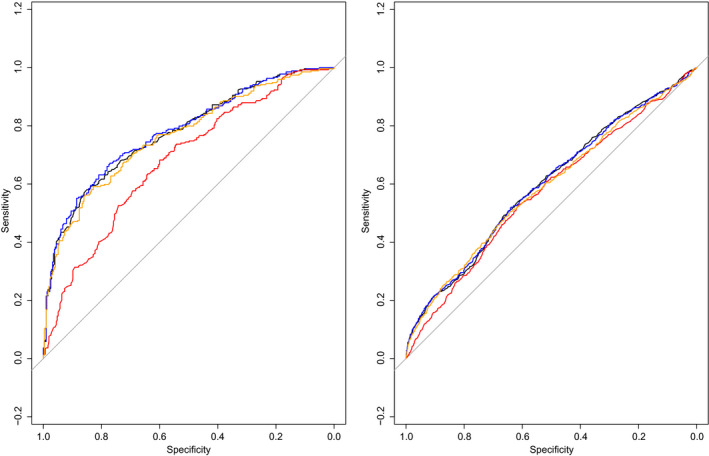
ROC curves in subgroups according to EFW centile for the prediction of adverse perinatal outcome of UA (black), MCA (red), CPR (orange) and UA PI plus CPR combined (blue) for: EFW centile <10 (n = 589) and EFW centile ≥10 (n = 3995).

ROC curves in subgroups according to EFW centile for the prediction of adverse perinatal outcome of UA (black), MCA (red), CPR (orange) and UA PI plus CPR combined (blue) for: EFW centile <10 (n = 589) and EFW centile ≥10 (n = 3995).