

Abstract
Relacorilant is a selective modulator of the glucocorticoid receptor in development for the treatment of several serious diseases. The widely used cocktail method was employed to assess relacorilant's effect on various cytochrome P450 (CYP) drug metabolizing enzymes in vitro and in vivo. Inhibition of CYP1A2, CYP2C9, CYP2C19, CYP2D6, CYP2B6, CYP2C8, CYP3A4, and CYP3A5 as well as induction of CYP1A2, CYP2B6, and CYP3A4 were assessed in vitro (relacorilant concentrations up to 10 µM). A clinical study in healthy subjects (n = 27) evaluated the inhibition of CYP3A4, CYP2C8, and CYP2C9 in vivo by administering single doses of probe CYP substrates (midazolam, pioglitazone, and tolbutamide) alone and in combination with relacorilant (350 mg). Pharmacokinetic sampling was conducted, and safety was assessed throughout the study. Pharmacokinetic parameters were evaluated using 90% confidence intervals of the geometric least squares mean ratios of test (probe substrate with relacorilant) vs reference (probe substrate alone) using boundaries of 80% to 125%. In vitro, relacorilant inhibited CYP3A4, CYP2C8, and CYP2C9 but did not meaningfully affect the activity of the other CYP enzymes evaluated. Consistent with the in vitro data, relacorilant was shown to be a strong CYP3A inhibitor in vivo (>8‐fold increase in midazolam area under the concentration versus time curve from time zero to the last quantifiable concentration and area under the concentration versus time curve from time zero extrapolated to infinity). Coadministration of relacorilant with drugs highly dependent on CYP3A for clearance is expected to increase the concentrations of these drugs. Importantly, clinical evaluation of relacorilant showed no inhibition of CYP2C8 or CYP2C9 in vivo. Accordingly, drugs that are substrates of only CYP2C8 and/or CYP2C9 can be coadministered with relacorilant without dose adjustment.
Keywords: clinical, cytochrome P450, drug‐drug interactions, GR modulator, pharmacokinetics, relacorilant
Relacorilant (CORT125134) 1 is a selective modulator of the glucocorticoid receptor (GR) that is currently in development for the treatment of several serious diseases, including endogenous Cushing syndrome and various cancers. Endogenous Cushing syndrome is a rare disorder that results from overproduction of the glucocorticoid hormone cortisol. It is most commonly caused by an adrenocorticotropic hormone–secreting pituitary tumor (Cushing disease). Other forms of Cushing syndrome result from autonomous production of cortisol from adrenal cortical tumors or overproduction of adrenocorticotropic hormone from nonpituitary tumors. 2 , 3 Cortisol acts throughout the body and is the endogenous ligand for the GR, which is expressed in almost every tissue. Relacorilant exerts its effects by competing with binding of cortisol to GR. Another GR antagonist, mifepristone, is approved for treatment of adult patients with endogenous Cushing syndrome who have type 2 diabetes mellitus or glucose intolerance and have failed surgery or are not candidates for surgery. 4 Unlike mifepristone, relacorilant has no affinity for the progesterone receptor and thus does not cause antiprogesterone effects such as the endometrial thickening or irregular vaginal bleeding seen with mifepristone (chemical structures of relacorilant and mifepristone are provided for informational purposes in Figure S1). The symptoms of Cushing syndrome are many, varied, and include glucose intolerance, hypertension, muscle weakness, skin thinning, weight gain, abnormal fat distribution, and psychiatric disturbances. Patients with Cushing syndrome frequently take a variety of medications to manage their various symptoms.
Relacorilant is also being investigated in combination with other medicines for the treatment of selected cancers, as GR has been shown to be highly expressed in several solid tumor types, including pancreatic, ovarian, and triple‐negative breast cancer 5 , 6 and involved in chemotherapy resistance. Stimulation of GR has been shown to reduce chemotherapy sensitivity and antagonism of GR has been shown to enhance chemotherapy sensitivity. 7 , 8 Preclinical studies in multiple tumor types have shown that GR antagonists can enhance the efficacy of chemotherapy. 7 , 8 , 9 , 10 , 11 Based on very promising results obtained in a clinical study investigating the combination of relacorilant and nab‐paclitaxel in patients with solid tumors, 12 the combination of relacorilant with nab‐paclitaxel is currently under investigation in patients with ovarian cancer and patients with pancreatic cancer.
Since relacorilant, once approved, will frequently be administered with other drugs in the treatment of Cushing syndrome and/or cancer, it is important to characterize the potential for relacorilant to cause drug‐drug interactions (DDIs). In patients with Cushing syndrome or adrenal cancer, doses up to 400 mg/day of relacorilant are being evaluated, whereas most cancer patients are being given relacorilant doses up to 150 mg/day in combination with nab‐paclitaxel. In vitro assays to measure the ability of relacorilant to inhibit the 8 major cytochrome P450 (CYP) isoforms (CYP1A2, CYP2B6, CYP2C8, CYP2C9, CYP2C19, CYP2D6, CYP3A4, and CYP3A5) indicated that relacorilant is a potent inhibitor of CYP2C8 and a moderate inhibitor of CYP2C9 and CYP3A4. 1 No induction of CYP1A2, CYP2B6, or CYP3A4 was noted in an in vitro assay conducted in human hepatocytes. 1 In this article, we describe the in vitro results and the subsequent in vivo findings of a clinical study undertaken to evaluate the potential for relacorilant to cause CYP‐mediated DDIs (CORT125134‐126, NCT03457597).
Methods
The protocol and informed consent form for the phase 1 clinical trial presented in this report were reviewed and approved by an institutional review board (IRB) before any subjects were consented or screened and written informed consent was obtained for all subjects before study enrollment (Advarra IRB [formerly Chesapeake IRB], Cincinnati, Ohio). The phase 1 clinical trial presented in this report was conducted at Celerion, Inc. (Tempe, Arizona) and registered at clinicaltrials.gov (NCT03457597). The in vitro relacorilant CYP inhibition and induction assessments were previously presented in brief. 1 Further detailed in vitro methods, previously unreported, are presented herein.
In Vitro CYP Inhibition Assays: CYP2B6, CYP2C8, and CYP3A5
In vitro CYP inhibition assays were conducted as described by Weaver et al. 13 CYP isoforms CYP2B6, CYP2C8, and CYP3A5, heterologously expressed in Escherichia coli, were obtained from Cypex and mixed to produce a 3‐CYP mix. The final concentration of the 3‐CYP mix was 18 pmol/mL for CYP2B6, 1 pmol/mL for CYP2C8, and 5 pmol/mL for CYP3A5. Relacorilant (final concentration range, 0.032‐10 µM, 1% dimethyl sulfoxide) or a cocktail of control CYP inhibitors consisting of ticlopidine (CYP2B6 inhibitor, 0.0032‐1 µM), quercetin (CYP2C8 inhibitor, 0.032‐10 µM), and ketoconazole (CYP3A5 inhibitor, 0.064‐20 µM) was added to reaction tubes in a 96‐well plate format. The CYP mix and a CYP substrate cocktail comprising bupropion (CYP2B6 substrate, 1 µM), amodiaquine (CYP2C8 substrate, 76 µM), and midazolam (CYP3A5 substrate, 2.5 µM) were added and the tubes warmed for 3 minutes while mixing on a BioShake IQ (37°C, 1500 rpm [3 × g]; QInstruments, Jena, Germany). Each substrate was used at a concentration close to its metabolic rate constant as recommended by US Food and Drug Administration (FDA) guidance. 14 Nicotinamide adenine dinucleotide phosphate (final concentration 1 mM) was added, and the mixture was incubated for 10 minutes. All reactions were performed in duplicate at 37°C and in 0.1 M phosphate buffer (pH 7.4). The final protein concentration was 0.06 mg/mL. Methanol containing an internal standard (1 µM tolbutamide) was then added to all samples, and these were mixed and placed at –20°C for ≥1 hour to quench the reaction and allow protein to precipitate. All samples were centrifuged (2500 × g, 20 minutes, 4°C). The supernatants were transferred to a fresh 96‐well plate, compatible with an autosampler. The plate was sealed with a preslit silicone mat and the metabolites were analyzed by liquid chromatography–tandem mass spectrometry (MS/MS).
In Vitro CYP Inhibition Assays: CYP1A2, CYP2C9, CYP2C19, CYP2D6, and CYP3A4
The assay was conducted as described above using a 5‐CYP mix containing each CYP at a final concentration of 32.5 pmol/mL. The substrate cocktail contained tacrine (CYP1A2 substrate, 0.5 µM), diclofenac (CYP2C9 substrate, 2 µM), (S)mephenytoin (CYP2C19 substrate, 40 µM), bufuralol (CYP2D6 substrate, 10 µM) and midazolam (CYP3A4 substrate, 2.5 µM). Each substrate was used at a concentration close to its metabolic rate constant as recommended by FDA guidance. 14 The CYP inhibitor cocktail comprised α‐naphthoflavone (CYP1A2, 0.0032‐1 µM), sulfaphenazole (CYP2C9, 0.032‐10 µM), tranylcypromine (CYP2C19, 0.32‐100 µM), quinidine (CYP2D6, 0.0032‐1 µM), and ketoconazole (CYP3A4, 0.00095‐0.1 µM).
Half maximal inhibitory concentration (IC50) values from CYP inhibition assays were calculated from the slope and y‐axis intercept of a pseudo‐Hill plot.
In Vitro CYP Induction Assays: CYP1A2, CYP2B6, and CYP3A4
Cryopreserved human hepatocytes (0.72 × 10⁵ per well) from 3 healthy donors were incubated with 7 concentrations of relacorilant (0.01‐10 µM) or an appropriate positive control for 48 hours at 37°C. The final concentration of dimethyl sulfoxide in the assay was 0.5%. Omeprazole (50 µM) was used as the positive control for CYP1A2, phenobarbital (1000 µM) was used to induce CYP2B6 and CYP3A4, and rifampin (10 µM) was used for CYP2B6 and CYP3A4. CYP messenger RNA levels were determined by real‐time quantitative polymerase chain reaction using specific probes with TaqMan chemistry. The samples for quantitative polymerase chain reaction analyses were prepared from total RNA extracted from the hepatocytes according to the Purelink Pro 96 RNA purification kit (Invitrogen, Thermo Scientific Inc., Waltham, Massachusetts) and complementary DNA (cDNA) generated by the High‐Capacity cDNA Reverse Transcription Kit (Applied Biosystems, Thermo Scientific Inc.). The resulting cDNA was diluted 5‐fold with sterile‐filtered water. Target genes CYP1A2, CYP2B6, and CYP3A4 as well as reference genes glyceraldehyde 3‐phosphate dehydrogenase and β2‐microglobulin, were run as single‐plex quantitative polymerase chain reaction assays using 4 µL of sample/reaction in a final volume of 20 µL with TaqMan Fast Master mix (Thermo Scientific Inc.).
The half maximal effective concentration values for the test item and the positive control compounds were determined by fitting the data to the following equation:
| (1) |
where Bottom was set as 1.0‐fold and Y was the fold induction value at each test concentration X. No weighting scheme was applied. Fitting was performed using Prism 6.01 software (GraphPad Software Inc, La Jolla, California).
Clinical Study Population and Study Design
This was a phase 1, open‐label, fixed‐sequence crossover study (CORT125134‐126) evaluating the potential effect of relacorilant on probe substrates of various CYP drug metabolizing enzymes in healthy subjects (Celerion, Inc., Tempe, Arizona). The cocktail approach to efficiently and effectively conduct clinical DDI evaluations using concurrent administration of several CYP isoform‐selective probe drugs is common and includes examples such as the “Inje” or “Cooperstown 5 + 1” cocktails. 15 , 16 , 17 In this study, probe substrates for CYP3A (midazolam), CYP2C8 (pioglitazone), and CYP2C9 (tolbutamide) were concurrently administered. Repaglinide was not selected as the probe substrate for CYP2C8 due to the potential for relacorilant to inhibit organic anion‐transporting polypeptide 1B1, for which repaglinide is a substrate and pioglitazone is not. Probe substrates for CYP2C19 (omeprazole) and CYP2D6 (metoprolol) were also included in the study for informational purposes only. All probe substrates were selected based on their specificity toward their respective enzyme and lack of overlapping pathways with the other enzymes concurrently evaluated. Eligible subjects were of either sex. Women were postmenopausal or permanently sterilized or, if of childbearing potential, were not pregnant or lactating and agreed to use highly effective contraception with low user dependency. Major inclusion criteria included a body mass index between 18 and 32 kg/m2, inclusive; aged 18 to 65 years, inclusive; and overall good health, based on the results of medical history, physical examination, vital signs, 12‐lead electrocardiogram, and clinical laboratory findings. Subjects who had taken relacorilant in previous studies were excluded from the study. Subjects were nonsmokers and had suitable veins for multiple venipuncture/cannulation. Subjects were excluded if they had conditions that could have been aggravated by glucocorticoid antagonism (eg, asthma, any chronic inflammatory condition); a history of malabsorption syndrome or previous gastrointestinal surgery, which could have affected drug absorption or metabolism, with the exception of appendectomy and cholecystectomy; alcohol or substance abuse (at screening); estimated glomerular filtration rate <60 mL/min/1.73 m2, using the Chronic Kidney Disease Epidemiology Collaboration method; and seropositive for hepatitis B, hepatitis C, or human immunodeficiency virus. Additional major exclusion criteria included a QT interval corrected for heart rate using Fridericia's equation >450 milliseconds; hypertension based on mean of duplicate values recorded at least 2 minutes apart (supine/semirecumbent systolic blood pressure >160 mm Hg, diastolic blood pressure >100 mm Hg; or systolic blood pressure 140 to 160 mm Hg, diastolic blood pressure 90 to 100 mm Hg associated with indication for treatment [ie, evidence of end‐organ damage, diabetes, or a 10‐year cardiovascular risk, estimated using a standard calculator, eg, QRISK2‐2017 >20%]).
Twenty‐seven eligible subjects received single oral doses of midazolam hydrochloride 2.5 mg, as 1.25 mL of 2‐mg/mL syrup (day 1) and pioglitazone hydrochloride 15 mg, as one 15‐mg tablet, and tolbutamide 500 mg, as one 500‐mg tablet (day 2), either alone or in combination with relacorilant 350 mg (day 14, relacorilant with midazolam; day 15, relacorilant with pioglitazone and tolbutamide) using the cocktail approach, with once‐daily oral dosing of relacorilant 350 mg (7 × 50‐mg capsules) on days 5 to 17. Midazolam hydrochloride was manufactured by West‐Ward Pharmaceuticals Corporation (Eatontown, New Jersey; Lot No. AA2027A). Pioglitazone hydrochloride was manufactured by Lek Pharmaceuticals (Ljubljana, Slovenia; Lot No. HC8605). Tolbutamide was manufactured by Mylan Pharmaceuticals, Inc. (Morgantown, West Virginia; Lot No. 3061024). Relacorilant was manufactured by Capsugel (Morristown, New Jersey; Lot No. 3812A17). Subjects were confined to the clinical research unit from day 1 (before the start of dosing) through day 19 and returned to the clinical research unit for a final follow‐up visit approximately 2 weeks after the last dose of study drug. On day 1 (midazolam) and day 14 (midazolam with relacorilant), no food was provided until at least 4 hours after dosing. On day 2 (pioglitazone and tolbutamide) and day 15 (pioglitazone and tolbutamide with relacorilant), to prevent a potential decrease in blood glucose due to coadministration of pioglitazone and tolbutamide, subjects were given 200 mL of unsweetened apple juice 1 hour after dosing and 6 graham cracker squares (∼23 g) 2 hours after dosing, followed by lunch 4 hours after dosing. On days 5 to 13 and days 16 and 17 (relacorilant administered alone), subjects remained fasting for 2 hours after dosing, after which a standard breakfast was provided. On days 1 and 14, a single oral dose of metoprolol (100 mg, probe substrate for CYP2D6) was included, and on days 2 and 15, a single oral dose of omeprazole (20 mg, probe substrate for CYP2C19) was included. Relacorilant showed minimal inhibition of CYP2C19 and CYP2D6 in vitro, so clinical assessment of a DDI was undertaken for information only, and therefore the results obtained with these probes are not included in this report but have been made available in the Tables S1 and S2. Subjects were allowed to drink water ad libitum until 1 hour before each dose of study drug and again beginning 1 hour after dosing. Treatments were administered, under the supervision of study personnel, with 240 mL of water; when >1 treatment was administered concurrently, a single 240‐mL portion of water was given. On all dosing days, subjects fasted for a minimum of 10 hours before dosing. A standard clinic diet was provided during nonfasting periods.
Safety Assessments
Safety and tolerability were assessed by review of treatment‐emergent adverse events (TEAEs), clinical laboratory tests (hematology profile, chemistry profile, and urinalysis), 12‐lead electrocardiogram and vital signs measurements, and comprehensive physical examinations.
Pharmacokinetic Sampling
Intensive pharmacokinetic sampling was conducted on 4 occasions during the study. Following a single dose of midazolam alone (day 1) and with relacorilant (day 14), pharmacokinetic blood sampling was performed at 0 (before dosing), and 0.25, 0.5, 1, 1.5, 2, 4, 6, 8, 12, 16, and 24 hours after dosing. Following single doses of pioglitazone and tolbutamide alone (day 2) and with relacorilant (day 15), pharmacokinetic blood sampling was performed as follows: for pioglitazone at 0 (before dosing), and 0.5, 1, 1.5, 2, 2.5, 3, 4, 6, 8, 12, 18, 24, 36, 48, 60, and 72 hours after dosing; for tolbutamide at 0 (before dosing), and 0.5, 1, 2, 3, 4, 6, 8, 12, 18, 24, 36, and 48 hours after dosing. Timing of blood samples was based on the pharmacokinetic profiles of each probe drug to adequately estimate the key pharmacokinetic parameters for evaluating potential DDIs, such as the area under the concentration versus time curve (AUC), the maximum observed plasma concentration (Cmax), and the terminal elimination half‐life (t1/2). For example, an increase in the AUC and t1/2 of a probe substrate in the presence vs the absence of a coadministered drug is suggestive of a DDI resulting in decreased elimination of the probe substrate. Blood samples were collected in tubes containing K3 ethylenediaminetetraacetic acid (K3EDTA) as the anticoagulant. Tubes were kept on ice and centrifuged at 4°C to harvest plasma. Plasma samples were stored at –70°C until the bioanalysis was conducted.
Bioanalytical Procedures
The plasma concentrations of midazolam, pioglitazone, and tolbutamide and their respective metabolites were determined using validated bioanalytical liquid chromatography–MS/MS assays. All plasma samples were analyzed within an appropriate time window supported by stability data. Additionally, applicable bioanalytical interference testing was conducted to confirm the lack of interference by probe substrates in the validated bioanalytical assays.
Midazolam
Human plasma samples containing midazolam and its metabolite, 1‐hydroxy‐midazolam, their deuterated analogs as internal standards, and K3EDTA as the anticoagulant were processed using a solvent extraction procedure. The extracts were analyzed by high‐performance liquid chromatography (HPLC) using a YMC Triart PFP column. The mobile phase was nebulized using heated nitrogen in a Z‐spray source/interface set to electrospray positive ionization mode. The ionized compounds were detected using MS/MS. The calibration range was 0.200 to 100 ng/mL for midazolam and 1‐hydroxy‐midazolam. The stability of midazolam and 1‐hydroxy‐midazolam in frozen matrix was 191 days at ‐20°C. The accuracy of the method was determined by comparing the mean measured concentrations with the theoretical concentrations in the quality control (QC) samples. For midazolam and 1‐hydroxy‐midazolam QC samples, the deviation of the mean from theoretical values did not exceed ±2.00% and ±2.25%, respectively. The precision of the method was determined from the percent coefficient of variation (%CV) of the QC sample replicates at each concentration level. The %CV for midazolam and 1‐hydroxy‐midazolam QC samples ranged from 4.58% to 5.30% and 4.52% to 6.24%, respectively.
Pioglitazone
Human plasma samples containing pioglitazone and its metabolite, pioglitazone M4, their deuterated analogs as internal standards, and K3EDTA as the anticoagulant were processed using a solvent extraction procedure. The extracts were analyzed by HPLC using a Synergi Hydro‐RP column (Phenomenex, Torrance, California). The mobile phase was nebulized using heated nitrogen in a Z‐spray source/interface set to electrospray positive ionization mode. The ionized compounds were detected using MS/MS. The calibration range was from 1.00 to 1000 ng/mL for pioglitazone and 0.500 to 500 ng/mL for pioglitazone M4. The stability of pioglitazone and pioglitazone M4 in frozen matrix was 31 days at –70°C. The accuracy of the method was determined by comparing the mean measured concentrations with the theoretical concentrations in the QC samples. For pioglitazone and pioglitazone M4 QC samples, the deviation of the mean from theoretical values did not exceed ±1.38% and ±1.33%, respectively. The precision of the method was determined from the %CV of the QC sample replicates at each concentration level. The %CV for pioglitazone and pioglitazone M4 QC samples ranged from 2.25% to 10.1% and 2.17% to 10.3%, respectively.
Tolbutamide
Human plasma samples containing tolbutamide, and its metabolite, 4‐hydroxy‐tolbutamide, their deuterated analogs as internal standards, and K3EDTA as the anticoagulant were processed by a supported liquid extraction procedure. The extracts were analyzed by HPLC using a Kinetex XB‐C18 column. The mobile phase was nebulized using heated nitrogen in a Z‐spray source/interface set to electrospray negative ionization mode. The ionized compounds were detected using MS/MS. The calibration range was from 100 to 50 000 ng/mL for tolbutamide and 10.0 to 5000 ng/mL for 4‐hydroxy‐tolbutamide. The stability of tolbutamide and 4‐hydroxy‐tolbutamide in frozen matrix was 33 days at –20°C. The accuracy of the method was determined by comparing the mean measured concentrations with the theoretical concentrations in the QC samples. For tolbutamide and 4‐hydroxy‐tolbutamide QC samples, the deviation of the mean from theoretical values did not exceed ±8.00% and ±3.16%, respectively. The precision of the method was determined from the %CV of the QC sample replicates at each concentration level. The %CV for tolbutamide and hydroxy‐tolbutamide QC samples ranged from 3.32% to 4.08% and 3.58% to 4.53%, respectively.
Pharmacokinetic Analyses
Pharmacokinetic parameters of midazolam, pioglitazone, and tolbutamide were estimated with the linear up/log down trapezoidal rule using a noncompartmental analysis method (Phoenix WinNonlin Version 7.0; Certara, Princeton, New Jersey). Select, relevant pharmacokinetic parameters included AUC from time zero extrapolated to infinity (AUCinf), AUC from time zero to the last quantifiable concentration (AUClast), Cmax, time to reach Cmax (tmax), and t1/2. Pharmacokinetic parameters were not calculated for subjects with fewer than 3 consecutive postdose time points with quantifiable concentrations. Subjects for whom there were insufficient data to calculate pharmacokinetic parameters were excluded from the statistical analysis. Actual elapsed postdose times were used for the noncompartmental analysis. Plasma concentrations below the limit of quantitation before the first quantifiable concentration were set to zero to prevent overestimation of the AUC. Plasma concentrations below the limit of quantitation after the first quantifiable concentration were treated as missing so as not to bias the estimation of the terminal elimination rate constant (λz). The λz was determined using linear regressions composed of least 3 data points (default setting in Phoenix WinNonlin). The λz was not assigned if (1) the terminal elimination phase was not apparent, (2) if Cmax was one of the 3 last data points, or (3) if the R2 value was <0.8.
Statistical Analyses
A parametric analysis of variance using a mixed‐effect repeated measures model and PROC MIXED in SAS (SAS Institute, Cary, North Carolina) was fitted to the natural logarithmic transformed primary pharmacokinetic parameters for midazolam, pioglitazone, and tolbutamide (AUCinf, AUClast, and Cmax) with treatment (day) as a fixed effect and the individual subject as a random effect. For each comparison of the primary pharmacokinetic parameters, an estimate of the mean difference (test minus reference) and the corresponding 90% confidence intervals (CIs) was obtained from the model and exponentiated to provide an estimate of the ratio of geometric least squares means (GLSMs; test/reference) and corresponding 90%CI. A total sample size of 24 evaluable subjects was projected to provide ≥80% power to establish that the 90%CI of the ratio of 2 GLSMs lies within the default no effect boundary of 80% to 125%, assuming the true ratio was 1 and the within (intra) subject %CV was ≤26%, which was an estimate based on the observed range of intrasubject %CV values from clinical DDI studies reported in the literature with the relevant probe substrates. To account for potential discontinuations or withdrawals, 27 subjects were enrolled.
Results
In Vitro CYP Inhibition Assays
The potential for relacorilant to inhibit the 5 major CYP isoforms was assessed in vitro using a standard cocktail approach. The CYP1A2‐mediated metabolism of tacrine, the CYP2C9‐mediated metabolism of diclofenac, the CYP2C19‐mediated metabolism of (S)mephenytoin, the CYP2D6‐mediated metabolism of bufuralol, and the CYP3A4‐mediated metabolism of midazolam were measured in parallel with a positive control for each CYP (Table 1). Relacorilant did not relevantly affect the activity of CYP1A2, CYP2C19, or CYP2D6 in vitro but was found to moderately inhibit CYP2C9 and CYP3A4 in vitro. The IC50 for the inhibition of the metabolism of diclofenac by CYP2C9 was 2.0 µM and the IC50 for the metabolism of midazolam by CYP3A4 was 1.32 µM. Three additional CYP isoforms were assessed in a separate experiment. The potential for relacorilant to inhibit the CYP2B6‐mediated metabolism of bupropion, the CYP2C8‐mediated metabolism of amodiaquine, and/or the CYP3A5‐mediated metabolism of midazolam were measured in parallel with a positive control for each CYP (Table 2). Relacorilant did not relevantly affect the activity of CYP2B6 or CYP3A5 in vitro but was found to strongly inhibit the CYP2C8‐mediated metabolism of amodiaquine in vitro with an IC50 of 0.21 µM.
Table 1.
In Vitro Inhibition Results for CYP1A2, CYP2C9, CYP2C19, CYP2D6, and CYP3A4 With Relacorilant and Positive Controls
| CYP Isoform, Substrate, and IC50 (µM) | |||||
|---|---|---|---|---|---|
| Compound | CYP1A2 Tacrine | CYP2C9 Diclofenac | CYP2C19 (S)mephenytoin | CYP2D6 Bufuralol | CYP3A4 Midazolam |
| Relacorilant | >10 | 2.0 | 8 | 9 | 1.32 |
| a‐Naphthoflavone | 0.016 | NT | NT | NT | NT |
| Sulfaphenazole | NT | 0.45 | NT | NT | NT |
| Tranylcypromine | NT | NT | 18 | NT | NT |
| Quinidine | NT | NT | NT | 0.052 | NT |
| Ketoconazole | NT | NT | NT | NT | 0.019 |
CYP, cytochrome P450; IC50, half‐maximal inhibitory concentration; NT, not tested.
Table 2.
In Vitro Inhibition Results for CYP2B6, CYP2C8, and CYP3A5 With Relacorilant and Positive Controls
| CYP Isoform, Substrate, and IC50 (µM) | |||
|---|---|---|---|
| Compound | CYP2B6 Bupropion | CYP2C8 Amodiaquine | CYP3A5 Midazolam |
| Relacorilant | >10 | 0.21 | 4.9 |
| Ticlopidine | 0.17 | NT | NT |
| Quercetin | NT | 1.3 | NT |
| Ketoconazole | NT | NT | 0.26 |
CYP, cytochrome P450; IC50, half‐maximal inhibitory concentration; NT, not tested.
In Vitro CYP Induction Assays: CYP1A2, CYP2B6, and CYP3A4
The potential for relacorilant to induce CYP1A2, CYP2B6, and/or CYP3A4 in cryopreserved human hepatocytes from 3 human donors was measured in parallel with a positive control for each CYP (Table 3). A dose‐responsive induction of CYP1A2 was observed in all donors. No induction of CYP2B6 was observed in any donor. There was an indication for induction of CYP3A4 in one of the 3 donors, but no induction was observed in the other 2 donors. The fold induction values were all <40% of the maximum induction observed with the appropriate control inducer, which is the threshold for biologically significant induction according to the FDA and European Medicines Agency. Thus, relacorilant is not associated with a clinically relevant induction of the CYPs tested, and clinical DDI studies to evaluate the effect of CYP induction by relacorilant are not needed.
Table 3.
In Vitro Induction Results for CYP1A2, CYP2B6, and CYP3A4 Messenger RNA With Relacorilant and Positive Controls
| CYP Isoform and Fold Induction | |||
|---|---|---|---|
| Compound | CYP1A2 | CYP2B6 | CYP3A4 |
| Relacorilant a | ≤8.63 | ≤1.13 | ≤2.73 |
| Omeprazole | 24.6‐42.6 | NT | NT |
| Phenobarbital | NT | 4.19‐12.0 | 16.3‐31.8 |
| Rifampicin | NT | 3.01‐9.15 | 13.8‐29.6 |
CYP, cytochrome P450; NT, not tested
The values shown are the highest fold induction observed in any donor, at any concentration.
Clinical CYP Inhibition Studies
Subject Demographics and Disposition
Twenty‐seven subjects were enrolled in the study (23 male and 4 female; 24 White, 2 Black/African American, and 1 Native Hawaiian/Pacific Islander/Asian; 15 Hispanic or Latino and 12 Not Hispanic or Latino) with a mean age of 43.9 years (range, 24‐60 years). The mean weight at screening was 82.97 kg (range, 63.7‐111.5 kg) and the mean height was 172.5 cm (range, 150‐188 cm). The mean body mass index at screening was 27.88 kg/m2 (range, 19.3‐31.8 kg/m2) and the mean estimated glomerular filtration rate using Chronic Kidney Disease Epidemiology Collaboration was 100 mL/min (range, 70‐121 mL/min). Twenty‐six subjects completed the study and 1 subject was withdrawn (a 60‐year‐old White, Hispanic, or Latino female, see below).
Safety
Study drug treatments were generally well tolerated. The most frequently reported TEAEs during relacorilant monotherapy were headache (4 subjects, 15%), constipation (4 subjects, 15%), and dry skin (3 subjects, 11%). Overall, the most commonly reported TEAEs were somnolence (22 subjects, 81%) (attributed to midazolam), headache, and constipation (5 subjects each, 19%). One subject was withdrawn from the study on day 10 during once‐daily dosing of relacorilant due to a grade 3 adverse event of acute pancreatitis considered unrelated to study drug. No new safety findings for relacorilant or probe substrates were identified.
Pharmacokinetics
Midazolam
The midazolam alone pharmacokinetic analysis set included 27 subjects (midazolam with relacorilant set included 26 subjects). The plasma concentration–time profiles of midazolam following administration of a single dose of midazolam in the absence or presence of relacorilant are shown in Figure 1. Corresponding midazolam pharmacokinetic parameters, GLSM ratios and 90%CIs are presented in Table 4. Mean peak and total exposures (Cmax and AUCinf) of midazolam were substantially higher following midazolam in combination with relacorilant (day 14) compared to midazolam alone (day 1). Median tmax was approximately 0.5 hours following midazolam alone (day 1) and 0.75 hours following administration of midazolam in combination with relacorilant (day 14). Mean t1/2 was approximately 5 hours on day 1 and 14 hours on day 14. The statistical comparisons of midazolam primary pharmacokinetic parameters showed that the GLSM Cmax, AUClast, and AUCinf were approximately 3.1‐, 8.8‐, and 8.9‐fold higher, respectively, following administration of midazolam in combination with relacorilant (day 14) compared to midazolam alone (day 1). The exposures of the metabolite, 1‐hydroxy‐midazolam, were similarly increased following administration of midazolam in combination with relacorilant compared to midazolam alone (Table S3).
Figure 1.
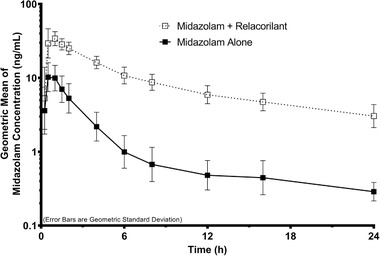
Midazolam plasma concentration–time profiles following a single oral administration of midazolam (2.5 mg) in the absence or presence of relacorilant (350 mg daily). Data shown are geometric means with error bars representing the geometric standard deviation.
Table 4.
Pharmacokinetic Parameters and Statistical Comparisons of Plasma Exposures of Probe Substrates of CYP3A4, CYP2C8, and CYP2C9
| Effect of Relacorilant on CYP3A4 | Effect of Relacorilant on CYP2C8 | Effect of Relacorilant on CYP2C9 | |||||||
|---|---|---|---|---|---|---|---|---|---|
| Midazolam Alone | Midazolam + Relacorilant | GLSM Ratio (90%CI) | Pioglitazone Alone | Pioglitazone + Relacorilant | GLSM Ratio (90%CI) | Tolbutamide Alone a | Tolbutamide + Relacorilant a | GLSM Ratio (90%CI) | |
| AUCinf (ng • h/mL) a mean (%CV; range) | 36.4 (45.7; 8.5‐90.1) b | 298 (22.6; 190–475) | 8.928 (7.747‐10.290) | 5650 (32.6; 2910–11200) | 4170 (31.1; 1750–7180) b | 0.748 (0.681‐0.822) | 615 (35.8; 299–1130) c | 576 (42.8; 486–1360) | 0.895 (0.860‐0.932) |
| AUClast (ng • h/mL) a mean (%CV; range) | 34.2 (46.6; 7.9‐86.0) | 274 (21.4; 184‐430) | 8.784 (7.627‐10.117) | 5530 (33.0; 2890‐11 200) | 4080 (30.7; 1740‐6950) | 0.747 (0.681‐0.820) | 609 (32.8; 298‐1020) | 542 (36.1; 289‐1090) | 0.891 (0.857‐0.927) |
| Cmax (ng/mL) a mean (%CV; range) | 12.7 (39.2; 3.9‐26.5) | 37.5 (21.5; 22.6‐59.0) | 3.110 (2.720‐3.556) | 525 (36.0; 102‐956) | 404 (37.7; 156‐765) | 0.778 (0.697‐0.870) | 42.8 (13.6; 33.0‐52.9) | 30.2 (24.6; 17.5‐43.9) | 0.692 (0.648‐0.740) |
| tmax (h) median (%CV; range) | 0.50 (36.1; 0.50‐1.02) | 0.75 (34.2; 0.49‐1.00) | NA | 2.00 (47.8; 0.50‐4.00) | 2.50 (53.9; 0.48‐6.01) | NA | 3.00 (39.1; 0.99‐6.03) | 4.00 (37.7; 2.00‐8.02) | NA |
| t1/2 (h) mean (%CV; range) | 5.3 (52.5; 1.7‐11.6) b | 14.1 (25.3; 6.7‐21.3) | NA | 10.4 (64.6; 4.5‐27.6) | 11.3 (65.3; 5.0‐34.3) b | NA | 7.9 (37.8; 4.3‐16.4) c | 9.3 (37.5; 5.6‐20.7) | NA |
%CV, coefficient of variation; AUCinf, area under the concentration vs time curve from time zero extrapolated to infinity; AUClast, area under the concentration vs time curve from time zero to the last quantifiable concentration; Cmax, maximum observed plasma concentration; GLSM, geometric least squares mean; NA, not applicable; t1/2 terminal elimination half‐life; tmax, time to reach maximum observed plasma concentration.
Unless otherwise specified, the pharmacokinetic analysis set was as follows: n = 27 for reference treatment (probe substrate alone); n = 26 for test treatment (probe substrate in combination with relacorilant).
For tolbutamide pharmacokinetic parameters, the AUCinf and AUClast values are presented as µg • h/mL, and the Cmax values are presented as µg/mL.
n = 25.
n = 26.
Pioglitazone
The pioglitazone pharmacokinetic analysis set included 27 subjects (pioglitazone with relacorilant set included 26 subjects). The plasma concentration–time profiles of pioglitazone following administration of a single dose of pioglitazone in the absence or presence of relacorilant are shown in Figure 2. Corresponding pioglitazone pharmacokinetic parameters, GLSM ratios, and 90%CIs are presented in Table 4. Mean peak and total exposures of pioglitazone were slightly lower following administration of pioglitazone in combination with relacorilant (day 15) compared to a pioglitazone alone (day 2). Median tmax and mean t1/2 were similar following administration of pioglitazone alone (day 2) or in combination with relacorilant (day 15). The statistical comparisons of pioglitazone primary pharmacokinetic parameters showed that the GLSM Cmax, AUClast, and AUCinf were approximately 22%, 25%, and 25% lower, respectively, following the administration of pioglitazone in combination with relacorilant (day 15) compared to pioglitazone alone (day 2). The exposures of the metabolite, pioglitazone M4, were similar (90%CIs of the GLSM ratios were within the default boundary of 80%‐125%) following the administration of pioglitazone alone or in combination with relacorilant (Table S3).
Figure 2.
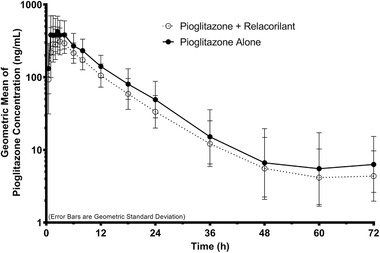
Pioglitazone plasma concentration–time profiles following a single oral administration of pioglitazone (15 mg) in the absence or presence of relacorilant (350 mg daily). Data shown are geometric means with error bars representing the geometric standard deviation.
Tolbutamide
The tolbutamide pharmacokinetic analysis set included up to 27 subjects (tolbutamide with relacorilant set included 26 subjects). The plasma concentration–time profiles of tolbutamide following administration of a single dose of tolbutamide in the absence or presence of relacorilant are shown in Figure 3. Corresponding tolbutamide pharmacokinetic parameters, GLSM ratios, and 90%CIs are presented in Table 4. Mean total exposures of tolbutamide were similar following the administration of tolbutamide alone (day 2) or in combination with relacorilant (day 15). However, mean Cmax was slightly lower following the administration of tolbutamide in combination with relacorilant (day 15) compared to a tolbutamide alone (day 2). The median tmax following the administration of tolbutamide alone (day 2) or in combination with relacorilant (day 15) was approximately 3 hours and 4 hours, respectively. The mean t1/2 following the administration of tolbutamide alone (day 2) or in combination with relacorilant (day 15) was approximately 8 hours and 9 hours, respectively. The statistical comparisons of tolbutamide primary pharmacokinetic parameters showed that the GLSM Cmax was approximately 31% lower following the administration of tolbutamide in combination with relacorilant (day 15) compared to tolbutamide alone (day 2); the 90%CIs of the GLSM ratios for AUClast and AUCinf were within the default boundary of 80% to 125%. The exposures of the metabolite, 4‐hydroxy‐tolbutamide, were similarly affected following the administration of tolbutamide in combination with relacorilant compared to tolbutamide alone (Table S3).
Figure 3.
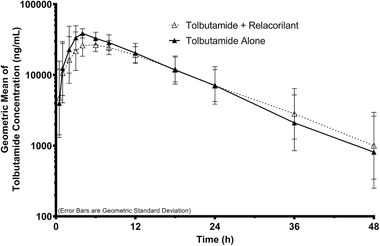
Tolbutamide plasma concentration–time profiles following a single oral administration of tolbutamide (500 mg) in the absence or presence of relacorilant (350 mg daily). Data shown are geometric means with error bars representing the geometric standard deviation.
Discussion
A comprehensive in vitro evaluation of the potential effect of relacorilant on the activity of various CYP drug‐metabolizing enzymes was undertaken to assess the need for subsequent clinical investigation to characterize the DDIs of relacorilant. As the concomitant administration of different drugs is common due to comorbidities and the need to treat different symptoms or illnesses/diseases simultaneously, understanding potentially complex DDIs is critical. The FDA has published updated guidance focusing on in vitro approaches to evaluate the interaction potential between investigational drugs with CYPs. 14 The results of in vitro assessments such as inhibition and induction studies help determine whether a clinical DDI study should be conducted. 18 Within this context, and given that relacorilant is expected to be coadministered with other medications in oncologic indications or in the treatment of Cushing syndrome, the potential for relacorilant to be a perpetrator of CYP‐mediated DDIs was evaluated both in vitro and clinically. The widely used and effective cocktail approach with specific, selected probe substrates was employed for the in vitro and in vivo assessments. The in vitro evaluation of the potential inhibitory effect of relacorilant on various CYPs showed that relacorilant does not meaningfully affect the activity of CYP2B6, CYP3A5, CYP1A2, CYP2C19, and CYP2D6. It was also shown that relacorilant did not meaningfully induce CYP1A2, CYP2B6, or CYP3A4. However, in vitro assessment of relacorilant suggested the potential for clinically relevant DDIs with substrates of CYP3A4, CYP2C8, and/or CYP2C9 due to inhibition of these enzymes by relacorilant. Based on these in vitro data, a dedicated phase 1 clinical study in healthy subjects was conducted to evaluate the effect of relacorilant on probe substrates of CYP3A (midazolam), CYP2C8 (pioglitazone), and CYP2C9 (tolbutamide). Consistent with the in vitro data, relacorilant was shown to be a strong CYP3A inhibitor in vivo. Consequently, administration of relacorilant with a drug whose metabolism is largely or solely mediated by CYP3A is expected to result in increased plasma concentrations of that drug.
Interestingly, and unlike the in vitro results, clinical evaluation of relacorilant showed no inhibition of CYP2C8 and CYP2C9 in vivo. Hence, drugs that are substrates of only CYP2C8 and/or CYP2C9 can be used in combination with relacorilant without dose adjustment. This finding for relacorilant is in contrast to the results observed with the GR antagonist mifepristone, which inhibits both CYP2C8 and CYP2C9 in vivo. Therefore, relacorilant should provide patients with Cushing syndrome an alternative treatment with less DDI liability, once approved. Additionally, this finding is particularly important in oncology, as relacorilant is currently under clinical investigation in combination with nab‐paclitaxel in patients with ovarian cancer and in patients with pancreatic cancer. The elimination of nab‐paclitaxel is primarily through hepatic metabolism and the metabolism of nab‐paclitaxel is catalyzed by both CYP3A and CYP2C8. Strong inhibition of both the CYP3A and CYP2C8 pathways concurrently could result in substantial increases in nab‐paclitaxel plasma concentrations, potentially necessitating major dose modification. Since, in vivo, relacorilant only inhibits CYP3A4 and not CYP2C8, the elimination of nab‐paclitaxel is not prevented and can still be mediated by the CYP2C8 pathway. A clinical crossover evaluation of nab‐paclitaxel alone and in combination with relacorilant in patients with solid tumors (CORT125134‐550, NCT02762981) showed only modest increases in nab‐paclitaxel exposures when coadministered with relacorilant as compared with nab‐paclitaxel alone. 12 Thus, nab‐paclitaxel can be coadministered with relacorilant with only a small decrease in dose level (ie, 80 mg/m2 with relacorilant vs 100‐125 mg/m2 alone).
Conclusions
In summary, as demonstrated by the >8‐fold increase in midazolam overall exposure (AUC) in the presence of relacorilant vs midazolam alone, relacorilant was shown to be a strong CYP3A inhibitor in vivo, consistent with previous in vitro data. Administration of relacorilant with a drug whose metabolism is largely or solely mediated by CYP3A is expected to result in increased plasma concentrations of that drug. Although relacorilant was shown to inhibit CYP2C8 and CYP2C9 in vitro, a subsequent clinical evaluation in a dedicated Phase 1 study in healthy subjects demonstrated a lack of inhibitory effect of relacorilant on CYP2C8 and CYP2C9 in vivo. Accordingly, drugs that are substrates of only CYP2C8 and/or CYP2C9 can be used in combination with relacorilant without dose adjustment.
Conflicts of Interest
J.M.C. and H.J.H. are employees of Corcept Therapeutics. K.M.D. is an employee of Jade Consultants (Cambridge) Ltd and a consultant/advisor for Corcept Therapeutics, KaNDy, and Xoc.
Funding
The in vitro and clinical studies reported in this article were funded by Corcept Therapeutics.
Data Sharing Statement
A high‐level summary of the clinical results will be posted to clinicaltrials.gov. In vitro and raw in vivo data will not be shared.
Supporting information
Supplementary Figure S1: Chemical Structures of Relacorilant and Mifepristone.
Supplementary information
Supplementary information
Supplementary information
Supplementary information
Acknowledgments
The authors thank Xenogesis, UK, for conducting the in vitro CYP inhibition assays and Admescope Ltd., Finland, for conducting the CYP induction assays. The authors also thank Celerion, Inc. USA, for conducting the clinical DDI study and TrialWise, USA, for their services in supporting the clinical study. Terry E. O'Reilly, MD, CPI, was the principal investigator undertaking the clinical study reported. Editorial support was provided by Tina K. Schlafly, PhD, of Corcept Therapeutics.
Fellows of the American College of Clinical Pharmacology: None
References
- 1. Hunt HJ, Belanoff JK, Walters I, et al. Identification of the clinical candidate (R)‐(1‐(4‐fluorophenyl)‐6‐((1‐methyl‐1H‐pyrazol‐4‐yl)sulfonyl)‐4,4a,5,6,7,8‐hexahydro‐1H‐pyrazolo[3,4‐g]isoquinolin‐4a‐yl)(4‐(trifluoromethyl)pyridin‐2‐yl)methanone (CORT125134): a selective glucocorticoid receptor (GR) antagonist. J Med Chem. 2017;60(8):3405‐3421. [DOI] [PubMed] [Google Scholar]
- 2. Lindholme J, Juul S, Joergensen J, et al. Incidence and late prognosis of Cushing's syndrome: a population‐based study. Clin Endocrinol Metab. 2001;86(1):117‐123. [DOI] [PubMed] [Google Scholar]
- 3. Steffensen C, Bak AM, Zoylner Rubeck K, Jorgensen JOL. Epidemiology of Cushing's syndrome. Neuroendocrinology 2010;92(Suppl. 1):1‐5. [DOI] [PubMed] [Google Scholar]
- 4. Korlym® (mifepristone) [prescribing information]. Menlo Park, CA: Corcept Therapeutics; 2019.
- 5. Block TS, Murphy TI, Munster PN, Nguyen DP, Lynch FJ. Glucocorticoid receptor expression in 20 solid tumor types using immunohistochemistry assay. Cancer Manag Res. 2017;9:65‐72. [DOI] [PMC free article] [PubMed] [Google Scholar]
- 6. Baker GM, Murphy T, Block T, Nguyen D, Lynch FJ. Development and validation of an immunohistochemistry assay to assess glucocorticoid receptor expression for clinical trials of mifepristone in breast cancer. Cancer Manag Res. 2015;7:361‐368. [DOI] [PMC free article] [PubMed] [Google Scholar]
- 7. Skor MN, Wonder EL, Kocherginsky M, et al. Glucocorticoid receptor antagonism as a novel therapy for triple‐negative breast cancer. Clin Cancer Res. 2013;19(22):6163‐6172. [DOI] [PMC free article] [PubMed] [Google Scholar]
- 8. Isikbay M. Otto K, Kregel S, et al. Glucocorticoid receptor activity contributes to resistance to androgen‐targeted therapy in prostate cancer. Horm Cancer 2014;5(2):72‐89. [DOI] [PMC free article] [PubMed] [Google Scholar]
- 9. Zhang C, Marme A, Wenger T et al. Glucocorticoid‐mediated inhibition of chemotherapy in ovarian carcinomas. Int J Oncol. 2006;28(2):551‐558. [PubMed] [Google Scholar]
- 10. Stringer‐Reasor EM, Baker GM, Skor MN, et al. Glucocorticoid receptor activation inhibits chemotherapy‐induced cell death in high‐grade serous ovarian carcinoma. Gynecol Oncol. 2015;138(3):656‐662. [DOI] [PMC free article] [PubMed] [Google Scholar]
- 11. Pan D, Kocherginsky M, Conzen SD. Activation of the glucocorticoid receptor is associated with poor prognosis in estrogen receptor‐negative breast cancer. Cancer Res. 2011;71(20):6360‐6370. [DOI] [PMC free article] [PubMed] [Google Scholar]
- 12. Munster PN, Sachdev JC, Fleming GF, Block TS, Peacock Shepherd S. A Phase 1/2 study of relacorilant + nab‐paclitaxel in patients (pts) with solid tumors: the dose‐finding phase. J Clin Oncol. 2018;36(15_suppl):2554‐2554. [Google Scholar]
- 13. Weaver R, Graham KS, Beattie IG, Riley RJ. Cytochrome P450 inhibition using recombinant proteins and mass spectrometry/multiple reaction monitoring technology in a cassette incubation. Drug Met Disp. 2003;31(7):955‐966. [DOI] [PubMed] [Google Scholar]
- 14. U.S. Department of Health and Human Services. FDA Center for Drug Evaluation and Research (CDER). In Vitro Drug Interaction Studies—Cytochrome P450 Enzyme‐ and Transporter‐Mediated Drug Interactions. Guidance for industry. https://www.fda.gov/regulatory-information/search-fda-guidance-documents/vitro-drug-interaction-studies-cytochrome-p450-enzyme-and-transporter-mediated-drug-interactions. Published January 2020. Accessed August 20, 2020.
- 15. Ryu JY, Song IS, Sunwoo YE, et al. Development of the “Inje Cocktail” for high‐throughput evaluation of five human cytochrome P450 isoforms in vivo. Clin Pharmacol Ther. 2007;82(5):531‐40. [DOI] [PubMed] [Google Scholar]
- 16. Chainuvati S, Nafziger AN, Leeder JS, et al. Combined phenotypic assessment of CYP1A2, CYP2C9, CYP2C19, CYP2D6, CYP3A, NAT2 and XO with the Cooperstown 5+1 Cocktail. Clin Pharmacol Ther. 2003;74(5):437‐47. [DOI] [PubMed] [Google Scholar]
- 17. Tomalik‐Scharte D, Jetter A, Kinzig‐Schippers M, et al. Effect of propiverine on cytochrome P450 enzymes: a cocktail interaction study in healthy volunteers. Drug Metab Dispos. 2005;33:1859‐66. [DOI] [PubMed] [Google Scholar]
- 18. U.S. Department of Health and Human Services. FDA Center for Drug Evaluation and Research (CDER). Clinical Drug Interaction Studies—Cytochrome P450 Enzyme‐ and Transporter-Mediated Drug Interactions. Guidance for industry. https://www.fda.gov/regulatory-information/search-fda-guidance-documents/clinical-drug-interaction-studies-cytochrome-p450-enzyme-and-transporter-mediated-drug-interactions. Published January 2020. Accessed August 20, 2020.
Associated Data
This section collects any data citations, data availability statements, or supplementary materials included in this article.
Supplementary Materials
Supplementary Figure S1: Chemical Structures of Relacorilant and Mifepristone.
Supplementary information
Supplementary information
Supplementary information
Supplementary information