

Abstract
The number of patients with advanced heart failure receiving left ventricular assist device (LVAD) implantation has increased dramatically over the last decade. There are limited data available about the nationwide trends of complications leading to readmissions following implantation of contemporary devices. Patients undergoing LVAD implantation from January 2013 to December 2013 were identified using International Classification of Diseases, 9th Revision, Clinical Modification (ICD-9-CM) code 37.66 from the healthcare cost and utilization project’s (HCUP) National Readmission Database (NRD). The top causes of unplanned 30-day readmission after LVAD implantation were determined. Survey logistic regression was used to analyze the significant predictors of readmission. In 2013, there were 2,235 patients with an LVAD implantation. Of them, 665 (29.7%) had at least one unplanned readmission within 30 days, out of which 289 (43.4%) occurred within 10 days post discharge. Implant complications (14.9%), congestive heart failure (11.7%) and gastrointestinal bleeding (8.4%) were the top 3 diagnoses for the first readmission and accounted for more than a third of all readmissions. Significant predictors of readmissions included a prolonged LOS during the index admission, Medicare insurance, and discharge to short term facility. In conclusion, despite increased experience with LVADs, unplanned readmissions within 30 days of implantation remain significantly high.
Keywords: Advanced heart failure, Left Ventricular Assist Device, Quality and Outcomes, 30-day readmissions
Introduction
Implantation of left ventricular assist devices (LVADs) as a bridge to transplant or destination therapy has substantially improved outcomes in patients with end-stage heart failure. Mortality has decreased with 1 year survival rates improving from 52% to 80% and 2-year survival rates from 23% to 70%.1,2 As mortality decreases, the focus of care of patients with LVADs has shifted from improving survival to minimizing complications and improving the quality of life. Unplanned readmissions lead to an increase in healthcare costs, resource utilization and a worse quality of life for patients.3,4 Data regarding unplanned readmissions in patients with LVADs is mainly derived from single institutional studies which might not be generalizable to other centers and these gaps pose challenges to designing interventions.5–7 By utilizing a large nationally representative all-payer database of hospitalizations and readmissions, we aimed to describe the national epidemiology of readmissions in patients with LVADs.
Methods:
Our study population was extracted from the National Readmissions Database (NRD) from the State Inpatient Databases (SID) of the Healthcare Cost and Utilizations Project (HCUP), developed through a Federal-State-Industry partnership sponsored by the Agency for Healthcare Research and Quality.8 The NRD is a powerful database that includes data from approximately 15 million discharges each year from 21 geographically dispersed states and constructed using reliable, verified patient linkage numbers in the SID that could be used to track the patient across hospitals. These data account for half of the non-institutionalized U.S. hospitalizations and can be weighted for nationally representative estimates. As our analysis was done on publicly available, de-identified data, the study was considered to be institutional review board exempt.
The NRD was queried using the International Classification of Disease, 9th Revisions, Clinical Modification (ICD-9-CM) procedure code 37.66 to identify admissions in patients who had LVAD implantations. To identify only LVADs placed for long-term therapy, we excluded patients with primary procedure code of orthotropic heart transplantation (37.5, 37.51 or 33.6 in the primary procedure field), those undergoing biventricular assist device (BiVAD) implantation (code 37.52 in any procedure field), and those undergoing percutaneous or other invasive short-term mechanical circulatory support (MCS) placement (codes 37.68, 37.60, 37.62, or 37.65 in any procedure field).9
We excluded admissions for patients who were younger than 18 years. We also excluded admissions related to pregnancy and chemotherapy, as these were likely planned admissions and readmissions. Admissions where the patient was readmitted the same day were considered a continuation of index admission, and therefore excluded from the readmission count. Lastly, we excluded admissions for patients who died during the index admission, those with missing discharge disposition and those with index admissions in December 2013 (since they lacked 30 days for accrual of readmissions). Please refer to supplementary table 1 for the list of codes used to define variables. While both unweighted and weighted numbers are displayed in study flow diagram (supplementary figure 1), only weighted numbers were used in our analysis.
Index hospitalizations were defined as admissions who had a LVAD implantation performed, while a readmission was defined as any admission within 30 days of a prior admission after excluding those that were flagged as elective. Please refer to supplementary table 2 for the frequency of patients and number of readmissions by readmission category. While a patient could have multiple readmissions, our predictive model was reflective of the odds for first readmission. While multiple readmissions may be correlated, we performed all our analysis at the admission level, since in a previous analysis modeling accounting for correlations at the patient level was not superior to modeling under the assumption that multiple admissions per patient were independent.10 Primary diagnosis of index admission and readmissions were grouped according to Clinical Classification Software (CCS) codes, which allowed for more clinically meaningful comparisons.11 The top CCS diagnoses were evaluated to determine cause specific readmissions, however, comparisons between groups and multivariate analysis were done on all index hospitalizations.
Patient demographics (age, gender, comorbidities, median household income category for patient’s zip code) and index admission characteristics (hospital size, hospital type, private vs. government control, primary payer, discharge disposition, and length of stay [LOS]) were included in our predictive model. Primary payer was divided into Medicare, Medicaid, private insurance, self-pay, or no charge; while discharge disposition was divided into routine or self-care, short-term hospital nursing facility, home health care. We utilized the All Patient Refined - Diagnosis Related Group (APR-DRG) score to account for the severity of illness.12 Hospital bed size categories (small, medium, and large) are based on hospital beds, and are specific to the hospital’s location and teaching status.13 Hospital information was obtained from the American Hospital Association (AHA) Annual Survey of Hospitals.14
Patient comorbidities were identified using the NRD defined comorbidity measures, and categorized using the CCS classification system which groups ICD-9-CM codes into mutually exclusive categories, the number of CCS categories serve as an indicator of comorbidity burden.15 Other co-morbidities included history of myocardial infarction, stroke, pneumonia and Chronic Obstructive Pulmonary Disease.
Descriptive statistics were utilized to compare patient, admission, and hospital characteristics between index admission with and without readmissions. We used Student’s T-test for normally distributed continuous variables, chi-square for categorical variables, and Wilcoxon Rank-Sum test for non-normally distributed continuous variables. Survey logistic regression was used to assess the relationship between potential predictors for readmissions and the odds of at least one 30-day unplanned readmission. This analysis was chosen given the NRD data which involves nested, weighted observations that is inherently stratified in clusters to produce national estimates.16 All significant levels were 2-sided with a P value of <0.05 considered to be statistically significant. Analyses were primarily done using SAS 9.2 (SAS Institute Inc.).
Results:
During 2013, 2,235 patients had an LVAD placement. Of them, 665 (29.7%) had at least one unplanned 30-day readmission. Out of the 665 readmissions, 289 (43.4%) occurred within 10 days post discharge. The top causes for readmissions were implant complications (14.9%), congestive heart failure (11.7%), gastrointestinal bleed (8.4%), abnormal coagulation profile (7.9%), fluid and electrolyte disorder (8%), paroxysmal ventricular tachycardia (6.1%), acute cerebrovascular disease (4.3%) and postoperative infections (3.2%). (Figure 1) These 8 diagnoses together accounted for two-thirds of all unplanned 30-day readmissions. Implant complications consisted of mechanical complications including pump thrombosis and driveline fractures (55.1%), LVAD related infections (28.3%) and others (16.6%).
Figure 1:
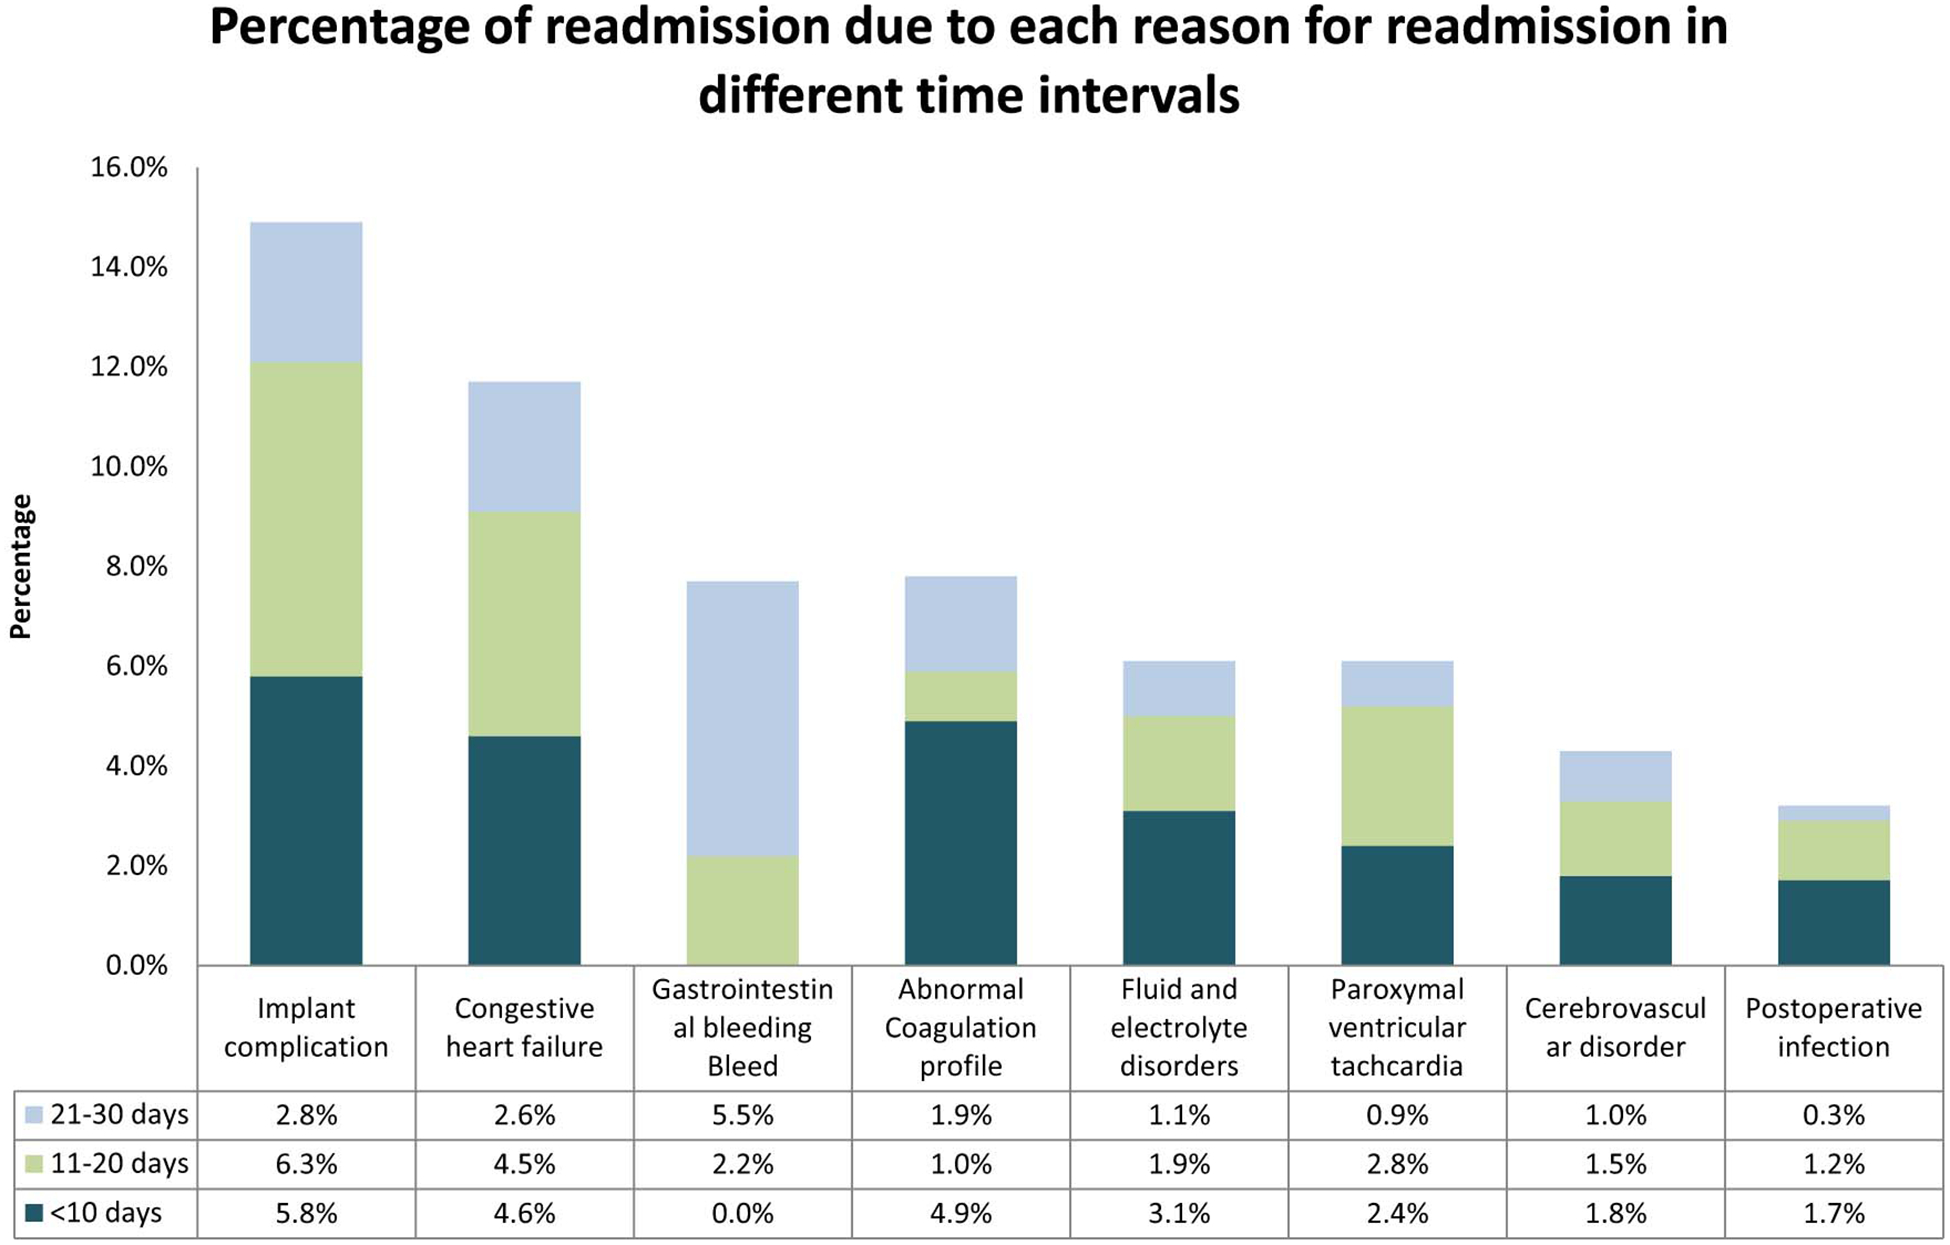
Bar chart demonstrating the percentage of readmissions due to each reason for readmission in different time intervals after discharge from index hospitalization for LVAD implantation in 2013.
Reasons for readmission differed depending on if they were within 10 days of discharge or after 20 days of discharge. Within the first 10 days implant complications (5.4%), congestive heart failure (4.6%), abnormal coagulation profiles (4.91%) were the top three causes for readmissions. Whereas gastrointestinal bleed (5.5%), implant complications (2.8%) and congestive heart failure (2.6%) were the top reasons for readmission after 20 days of discharge. (Figure 1)
Patients with readmissions were more likely to be older with age 50–64 years (49.3% vs. 43.8%, P= 0.03), more likely to have comorbidities such as peripheral vascular disease (15% vs. 7.3%, P<0.001), and abnormal coagulation profile (36.9% vs. 30.5%, P=0.003). Notable differences in socio-demographic and admission characteristics between patients with and without readmissions included more likely with median household income category between 26–50th percentile (30.2% vs. 26.3%, P=0.02), 51–75th percentile (24.1% vs. 22.5%, P=0.02), patients with non-elective admissions (64.2 % vs. 58.03%, P=0.005), with extreme loss of function on APRDRG severity scale (91.34% vs. 90.19%, P=0.04), longer LOS (median 31.24 vs. 24.52 days, P<0.001), to have Medicare insurance (58.97% vs. 42.07%, P<0.001), to be discharged with home health care (52.42% vs 50.04%, <0.001) and discharged to nursing facility (15.46% vest 11.3%, P<0.001). Additionally, patients with readmissions were more likely to be admitted to large bed size hospitals (93.84% vs. 90.51%, P<0.001) and large metropolitan hospitals (82.48% vs. 75.06, P=0.0001). (Table 1)
Table 1:
Baseline demographic, index admission and hospital characteristics of patients undergoing LVAD implantation in 2013 stratified by their 30-day unplanned readmission status.
| READMISSIONS | |||
|---|---|---|---|
| VARIABLE | NO N=1570(%) | YES N=665(%) | P-Value |
| Age (years) | |||
| Median (Inter quartile range) | 57.14 (47.73 – 64.80) | 58.83 (51.30 – 64.76) | 0.03 |
| 18–34 | 132 (8.45 %) | 46 (6.93%) | |
| 35–49 | 309 (19.71%) | 104 (15.69%) | |
| 50–64 | 687 (43.76%) | 328 (49.27%) | |
| >65 | 441 (28.08%) | 187 (28.11%) | |
| Men | 1246 (79.35%) | 513 (77.03%) | 0.22 |
| Women | 324 (20.65%) | 153 (22.97%) | |
| Old Myocardial Infarction | 276 (17.57%) | 115 (17.27%) | 0.87 |
| Stroke | 55 (3.52%) | 12 (1.82%) | 0.03 |
| Pneumonia | 195 (12.4%) | 64 (9.57%) | 0.06 |
| COPD | 185 (11.76%) | 91 (13.68%) | 0.21 |
| Diabetes Mellitus | 422 (26.86%) | 149 (22.41%) | 0.03 |
| Perivascular diseases | 115 (7.33%) | 100 (15.04%) | <.0001 |
| Hypertension with Complications | 697 (44.39%) | 300 (45.01%) | 0.78 |
| Electrolytes | 983 (62.63%) | 436 (65.59%) | 0.18 |
| Coagulation disorder | 478 (30.45%) | 245 (36.89%) | 0.003 |
| Obesity* | 305 (19.41%) | 136 (20.45%) | 0.57 |
| Median household income category for patient’s zip code†, (percentile) | |||
| 0–25th | 449 (28.58%) | 163 (24.47%) | 0.02 |
| 26–50th | 413 (26.27%) | 201 (30.22%) | |
| 51–75th | 354 (22.53%) | 161 (24.14%) | |
| 76–100th | 321 (20.47%) | 136 (20.44%) | |
| Admission Source‡ | |||
| Non-Emergency Department | 1347 (85.76%) | 554 (83.28%) | 0.13 |
| Emergency Department | 224 (14.24%) | 111 (16.72%) | |
| Admission Type | 0.005 | ||
| Non-Elective | 911 (58.03%) | 427 (64.2%) | |
| Elective | 648 (41.26%) | 229 (34.45%) | |
| APRDRG Severity Scale§ | 0.04 | ||
| Minor loss of function | 0 | 2 (0.32%) | |
| Moderate loss of function | 7 (0.43%) | 0 | |
| Major loss of function | 147 (9.38%) | 56 (8.34%) | |
| Extreme loss of function | 1416 (90.19%) | 608 (91.34%) | |
| Length of Stay (days) | |||
| Median Inter Quartile Range (days) | 24.52 (17.05 – 35.33) | 31.24 (20.42 – 45.83) | |
| <2 | 552 (35.18%) | 160 (24.01%) | |
| 3–4 | 466 (29.7%) | 156 (23.39%) | |
| 5–6 | 251 (15.97%) | 144 (21.7%) | |
| >=7 | 301 (19.15%) | 206 (30.91%) | |
| Primary Payer type | <.0001 | ||
| Medicare | 661 (42.07%) | 392 (58.97%) | |
| Medicaid | 197 (12.55%) | 60 (8.97%) | |
| Private | 587 (37.39%) | 185 (27.79%) | |
| Self pay or No Charge or Others | 97 (6.19%) | 17 (2.59%) | |
| Discharge Disposition | <.0001 | ||
| Routine | 554 (35.26%) | 205 (30.8%) | |
| Short term Hospital | 53 (3.4%) | 2 (0.32%) | |
| Nursing Facility | 177 (11.3%) | 103 (15.46%) | |
| Home Health Care | 786 (50.04%) | 356 (53.42%) | |
| Cost of Hospitalization in USD, Median (Inter Quartile Range) | 174089 (141838 – 222290) | 194501 (155942 – 248088) | 0.002 |
| Hospital bed size∥ | 0.001 | ||
| Small | 41 (2.6%) | 3 (0.4%) | |
| Medium | 108 (6.89%) | 38 (5.76%) | |
| Large | 1421 (90.51%) | 624 (93.84%) | |
| Hospital Type# | 0.17 | ||
| Metropolitan non-teaching | 23 (1.49%) | 5 (0.78%) | |
| Metropolitan teaching | 1547 (98.51%) | 660 (99.22%) | |
| Hospital Control¶ | 0.98 | ||
| Government, Nonfederal | 174 (11.08%) | 74 (11.05%) | |
| Private | 1396 (88.92%) | 592 (88.95%) | |
| Hospital urban-rural designation | 0.0001 | ||
| Large metropolitan | 1179 (75.06%) | 549 (82.48%) | |
| Small metropolitan | 392 (24.94%) | 117 (17.52%) | |
Obesity was defined using ICD-9-CM diagnoses and the Diagnosis Related Group (DRG) in effect on the discharge date.
This represents a quartile classification of the estimated median household income of residents in the patient’s ZIP Code. These values are derived from ZIP Code-demographic data obtained from Claritas. The quartiles are identified by values of 1 to 4, indicating the poorest to wealthiest populations.
HCUP criteria for evidence of ED services includes: 1)Emergency department revenue code of 450–459 on record; 2) Positive emergency department charge, when revenue center codes are not available; 3) Emergency department CPT code of 99281–99285 reported on record; 4) Condition Code of P7 (NUBC preferred coding for public reporting as of July 1, 2010); 5) Point of origin of ED (NUBC preferred coding from October 1, 2007 to June 30, 2010); 6) Admission source of ED (NUBC preferred coding prior to October 1, 2007).
The All Patient Refined Diagnosis Related Groups (APR-DRGs) are assigned using software developed by 3M Health Information Systems.
Bed size categories are based on hospital beds, and are specific to the hospital’s location and teaching status. Bed size assesses the number of short-term acute beds in a hospital. Hospital information was obtained from the AHA Annual Survey of Hospitals.
The hospital’s teaching status was obtained from the AHA Annual Survey of Hospitals. A hospital is considered to be a teaching hospital if it has an AMA-approved residency program, is a member of the Council of Teaching Hospitals (COTH) or has a ratio of full-time equivalent interns and residents to beds of .25 or higher. The metropolitan categorization is a simplified adaptation of the 2003 version of the Urban Influence Codes (UIC) and includes both large and small metropolitan areas.
The hospital’s ownership/control category was obtained from the AHA Annual Survey of Hospitals and includes categories for government nonfederal (public), private {not-for-profit (voluntary and private investor-owned (proprietary)}. Hospitals in different ownership/control categories tend to have different missions and different responses to government regulations and policies.
Frequencies (%) in the columns may not sum to 100% since there might be missing data
Adjusted demographic variables associated with increased odds of readmission included age 50–64 (aOR: 1.69; 95% CI 1.06–2.68; P=0.02), LOS ≥41 days (aOR: 2.78; 95% CI 1.54–5.02; P<0.001), patients with Medicare (aOR: 2.36; 95% CI 1.21–4.63; P<0.001) and being discharged from medium sized hospital (aOR: 5.24; 95% CI 1.55–17.70; P=0.008) and large hospital (aOR 5.48; 95% CI 2.37 – 13.07; P=0.003). However, discharge to a short term nursing home was associated with lower odds of readmission (aOR: 0.19; 95% CI 0.02–0.61; P<0.01). Interestingly, stroke (aOR: 0.36; 95% CI 0.18–0.71; p=0.003) and pneumonia (aOR: 0.50; 95% CI 0.26–0.93;p=0.03) during the index hospitalization were associated with lower odds of unplanned readmissions. (Table 2)
Table 2:
Predictors of 30-day unplanned readmissions after LVAD implantation in 2013.
| VARIABLE | Adjusted OR (95% CI) | P-value |
|---|---|---|
| Age (years) | ||
| 18–34 | 1.46 (057 – 3.71) | 0.41 |
| 35–49 | 1.41 (0.73 – 2.73) | 0.30 |
| 50–64 | 1.69 (1.06– 2.68) | 0.02 |
| ≥65 | Referent | |
| Men | Referent | |
| Women | 1.10 (0.71 – 1.74) | 0.65 |
| Stroke | 0.36 (0.18 – 0.71) | 0.0030 |
| Pneumonia | 0.50 (0.26 – 0.93) | 0.03 |
| Diabetes Mellitus | 0.69 (0.46 – 1.04) | 0.07 |
| Perivascular diseases | 2.15 (0.93 – 4.980 | 0.07 |
| Coagulation disorder | 1.42 (0.90 – 2.330 | 0.13 |
| Old Myocardial Infarction | 1.18 (0.68 – 2.06) | 0.54 |
| Hypertension with Complications | 1.1 (0.67 – 1.77) | 0.71 |
| Electrolytes | 0.96 (0.65 – 1.43) | 0.85 |
| Obesity* | 1.09 (0.72 – 1.65) | 0.68 |
| COPD | 1.006 (0.64 – 1.74) | 0.81 |
| Median household income category for patient’s zip code† (percentile) | ||
| 0–25th | Referent | |
| 26–50th | 1.25 (0.72 – 2.16) | 0.42 |
| 51–75th | 1.29 (0.69–2.40) | 0.42 |
| 76–100th | 1.38 (0.72–2.64) | 0.33 |
| INDEX ADMISSION CHARACTERISTICS | ||
| Admission Source‡ | ||
| Non-Emergency Department | 1.04 (0.62–1.75) | 0.89 |
| Emergency Department | Referent | |
| Admission Type | ||
| Non-Elective | 1.16 (0.70–1.92) | 0.55 |
| Elective | Referent | |
| APRDRG Severity Scale§ | ||
| Moderate or Major loss of function | Referent | |
| Extreme loss of function | 0.60 (0.32 – 1.10 | 0.09 |
| Length of Stay (Days) | ||
| <20 | Referent | |
| 21–30 | 1.17 (0.71–1.94) | 0.53 |
| 31–40 | 1.80 (0.94–3.44) | 0.07 |
| >=41 | 2.78 (1.54–5.02) | 0.001 |
| Primary Payer type | ||
| Medicare | 2.36 (1.21 – 4.63) | 0.01 |
| Medicaid | Referent | |
| Private | 1.08 (0.57 – 2.02) | 0.81 |
| Self pay or No Charge or Others | 0.81 (0.27 – 2.42) | 0.68 |
| Discharge Disposition | ||
| Routine | Referent | |
| Short term Hospital | 0.19 (0.02 – 0.61) | 0.01 |
| Nursing Facility | 1.37 (0.86 – 2.20) | 0.18 |
| Home Health Care | 1.02 (0.72 – 1.43) | 0.91 |
| HOSPITAL CHARACTERISTICS | ||
| Hospital bed size∥ | ||
| Small | Referent | |
| Medium | 5.24 (1.55 – 17.70) | 0.008 |
| Large | 5.48 (2.37 – 13.07) | 0.003 |
| Hospital Type# | ||
| Metropolitan non-teaching | 0.70 (0.41 – 1.18) | 0.18 |
| Metropolitan teaching | Referent | |
| Hospital Control¶ | ||
| Government, Nonfederal | Referent | |
| Private | 1.01 (0.48 – 2.15) | 0.97 |
| Hospital urban-rural designation | ||
| Large metropolitan (serving at least 1 million residents) | Referent | |
| Small metropolitan (<1 million residents) | 0.79 (0.42 – 1.50) | 0.46 |
Obesity was defined using ICD-9-CM diagnoses and the Diagnosis Related Group (DRG) in effect on the discharge date.
This represents a quartile classification of the estimated median household income of residents in the patient’s ZIP Code. These values are derived from ZIP Code-demographic data obtained from Claritas. The quartiles are identified by values of 1 to 4, indicating the poorest to wealthiest populations.
HCUP criteria for evidence of ED services includes: 1)Emergency department revenue code of 450–459 on record; 2) Positive emergency department charge, when revenue center codes are not available; 3) Emergency department CPT code of 99281–99285 reported on record; 4) Condition Code of P7 (NUBC preferred coding for public reporting as of July 1, 2010); 5) Point of origin of ED (NUBC preferred coding from October 1, 2007 to June 30, 2010); 6) Admission source of ED (NUBC preferred coding prior to October 1, 2007).
The All Patient Refined Diagnosis Related Groups (APR-DRGs) are assigned using software developed by 3M Health Information Systems.
Bed size categories are based on hospital beds, and are specific to the hospital’s location and teaching status. Bed size assesses the number of short-term acute beds in a hospital. Hospital information was obtained from the AHA Annual Survey of Hospitals.
The hospital’s teaching status was obtained from the AHA Annual Survey of Hospitals. A hospital is considered to be a teaching hospital if it has an AMA-approved residency program, is a member of the Council of Teaching Hospitals (COTH) or has a ratio of full-time equivalent interns and residents to beds of .25 or higher. The metropolitan categorization is a simplified adaptation of the 2003 version of the Urban Influence Codes (UIC) and includes both large and small metropolitan areas.
The hospital’s ownership/control category was obtained from the AHA Annual Survey of Hospitals and includes categories for government nonfederal (public), private {not-for-profit (voluntary and private investor-owned (proprietary)}. Hospitals in different ownership/control categories tend to have different missions and different responses to government regulations and policies.
Frequencies (%) in the columns may not sum to 100% since there might be missing data
Discussion:
We report the national 30-day unplanned readmission rate and its causes and predictors after LVAD implantation using a nationally representative database. We found that the national 30-day unplanned readmission rate was 29.7% of which 43.4% occurred in the first 10 days post discharge. The most common causes for 30-day unplanned readmissions were implant related complications, congestive heart failure, and gastrointestinal bleeding. 30-day readmissions due to implant complication and congestive heart failure were more common in the first 10 days while GI bleeding was more common after. Finally, prolonged LOS during the index admission, Medicare status, and discharge to short term hospitals were among the significant predictors of readmissions.
The strength of our analysis is that we captured >80% of the LVADs implanted nationally in 2013 using the NRD. While other national databases capture VAD implantations, the NRD by virtue of Please provide links to these registries. being a nationally representative database of all-payer hospital readmissions in the United States is not limited by patient consent and chart abstraction is better equipped to provide a more in-depth view of the national readmission landscape. This is likely one of the highest readmission rates compared to any other patient group and highlights the need for efforts to minimize the complications that follow device implantation. Interestingly, approximately one-half of all readmissions were within the first 10 days confirming the trends observed with single center studies.5,6
Other studied report an adverse event rate in the first 12 months after LVAD implantation of 30 events per 100 patient-months for continuous flow devices from 2012 to 2014.2 Our study provides a closer look at the complications within 30-days of LVAD implantation. Implant complications which included mechanical complications and infections were the most common reason for readmissions. Recent advances in device engineering by use of magnetically levitated centrifugal pumps are promising in reducing the incidence of pump thrombosis.17–19 However, these trials of centrifugal flow devices were disappointing in reducing the rates of right heart failure and bleeding complications as compared to axial flow pumps. Our analysis which captured both axial and centrifugal flow pumps implanted in 2013, also demonstrates a high burden of congestive heart failure (which likely represents right heart failure) and gastrointestinal bleeding in the first 30-days. Right heart failure occurring after LVAD implantation confers a worse prognosis and may require inotropic, pulmonary vasodilator or mechanical support for treatment.20,21 Acquired von Willebrand syndrome develops in patients with continuous flow devices (both axial and centrifugal) and contributes to the bleeding complications.22,23 Thrombin-induced angiopoietin 2 levels have been shown to be elevated in the continuous flow LVAD patients causing increased angiogenesis associated with increased risk of bleeding.24 This has the potential to serve as a novel therapeutic target for reducing bleeding complications. We believe that problems with hemocompatibility continue to pose challenges in VAD engineering and the optimum patient selection strategy to minimize right heart failure after LVAD implantation remains challenging. Further improvements in these areas are required to minimize post-implantation complications and readmission rates.
Hospital LOS > 6 weeks has been associated with high readmission rates in patients with LVAD which is confirmed in our analysis.4 Although, we found that discharge to short-term hospitals was associated with lower odds of readmission when compared to patients discharged home, there were only 2 patients with 30-day unplanned readmissions after discharge to short term hospitals. Discharge to nursing facility was not a predictor of 30-day readmissions. Longer LOS may contribute to an increase in the number of patients who were discharged to home and a decrease in the number who were discharged to skilled nursing facilities.
Our study found that smaller hospitals had lower odds of readmission after implantation, this may be due to the higher out of hospital mortality rate in low volume hospitals.25 We also note that Medicare and age of 50–64 was a predictor for mortality. We believe that patients <64 who have Medicare presumably had longer-term illness and therefore represent a sicker population. There was a significantly higher prevalence of stroke and pneumonia in patients without readmissions and therefore these variables emerged albeit counter-intuitively as negative predictors of readmission in our analysis.
There has been great debate about the cost-effectiveness of LVAD.26 The cost of medical treatment of CHF for 1 year was $93,362 whereas the inpatient-only cost of LVADs for a 1-year duration was more than two times that amount at $230,009.1,27,28 While a detailed discussion of cost-effectiveness of LVAD is beyond the scope of our study, we believe readmissions are an important factor that may drive up the total healthcare costs related to LVADs and may represent an attractive target for mitigating healthcare expenditure. While LVADs are not currently on the list of diagnoses penalized by the Centers for Medicare and Medicaid Services (CMS) for excessive readmissions, greater scrutiny of readmissions after LVAD implantation by payers may occur in the future.29,30
Our study has certain limitations. First, as the NRD is an administrative database, the classification of diagnosis is done using diagnosis codes, and therefore we may have misclassified some admissions. Also, since we used ICD- 9- CM codes to define our cohort it is not possible to distinguish between bridge to transplant and destination therapy or the INTERMACS class at time of implant. Moreover, using NRD data, we cannot identify the type and specifications of the LVAD model implanted and unable to compare the outcomes between axial and centrifugal flow pumps. Furthermore, we used the CCS schema to classify diagnosis into clinically meaningful categories, and thus the misclassification may not be clinically relevant. As the NRD is a deidentified database, it lacks the granularity of data that may be useful in achieving a better understanding of the reasons for readmissions. However, as the NRD is a large nationally representative database, we believe our results are broadly applicable to the patients with LVAD including those who have private insurance.
In conclusion, this is the first study reporting the national 30-day unplanned readmission rates after LVAD implantation and its causes and predictors for all payers and the uninsured of all ages. With an increase in the number patients receiving LVADs, readmissions pose a significant burden on the healthcare system. With a significant push to reduce readmissions from payers, there has been a greater emphasis on improving patient selection, providing a multidisciplinary approach and streamlining the transition of care patients with LVADs. Despite these efforts, complications after LVAD implantation are common and further steps in improving VAD engineering and optimizing patient selection are important to improve outcomes in patients living with LVADs.
Supplementary Material
Footnotes
Publisher's Disclaimer: This is a PDF file of an unedited manuscript that has been accepted for publication. As a service to our customers we are providing this early version of the manuscript. The manuscript will undergo copyediting, typesetting, and review of the resulting proof before it is published in its final citable form. Please note that during the production process errors may be discovered which could affect the content, and all legal disclaimers that apply to the journal pertain.
Conflicts of Interest Disclosure:
All authors have approved the final article. Dr. Desai is supported by grant K12 HS023000–01 from the Agency for Healthcare Research and Quality. Dr. Desai receives research funding from the Centers for Medicare & Medicaid Services to develop and maintain performance measures that are used for public reporting and support from Johnson & Johnson and Medtronic, through Yale University, to develop methods of clinical trial data sharing.
References:
- 1.Rose EA, Gelijns AC, Moskowitz AJ, Heitjan DF, Stevenson LW, Dembitsky W, Long JW, Ascheim DD, Tierney AR, Levitan RG, Watson JT, Meier P, Ronan NS, Shapiro PA, Lazar RM, Miller LW, Gupta L, Frazier OH, Desvigne-Nickens P, Oz MC, Poirier VL; Long-Term Use of a Left Ventricular Assist Device for End-Stage Heart Failure. N Engl J Med 2001;345(20):1435–1443. doi: 10.1056/NEJMoa012175. [DOI] [PubMed] [Google Scholar]
- 2.Kirklin JK, Naftel DC, Pagani FD, Kormos RL, Stevenson LW, Blume ED, Myers SL, Miller MA, Baldwin JT, Young JB; Seventh INTERMACS annual report: 15,000 patients and counting. J Heart Lung Transplant 2015;34(12):1495–1504. doi: 10.1016/j.healun.2015.10.003. [DOI] [PubMed] [Google Scholar]
- 3.Lampropulos JF, Kim N, Wang Y, X Desai MM, Barreto-Filho JA, Dodson JA, Dries DL, Mangi AA, Krumholz HM; Trends in left ventricular assist device use and outcomes among Medicare beneficiaries, 2004–2011. Open Heart 2014;1(1). doi: 10.1136/openhrt-2014-000109. [DOI] [PMC free article] [PubMed] [Google Scholar]
- 4.Dunlay SM, Haas LR, Herrin J, Schilz SR, Stulak JM, Kushwaha SS, Shah ND; Use of Post-acute Care Services and Readmissions After Left Ventricular Assist Device Implantation in Privately Insured Patients. J Card Fail 2015;21(10):816–823. doi: 10.1016/j.cardfail.2015.06.012. [DOI] [PMC free article] [PubMed] [Google Scholar]
- 5.Hasin T, Marmor Y, Kremers W, Opilsky Y, Severson CJ, Schirger JA, Boilson BA, Clavell AL, Rodeheffer RJ, Frantz RP, Edwards BS, Pereira NL, Stulak JM, Joyce L, Daly R, Park SJ, Kushwaha SS; Readmissions After Implantation of Axial Flow Left Ventricular Assist Device. J Am Coll Cardiol 2013;61(2):153–163. doi: 10.1016/j.jacc.2012.09.041. [DOI] [PubMed] [Google Scholar]
- 6.Tsiouris A, Paone G, Nemeh HW, Brewer RJ, Morgan JA; Factors determining post-operative readmissions after left ventricular assist device implantation. J Heart Lung Transplant 2014;33(10):1041–1047. doi: 10.1016/j.healun.2014.05.009. [DOI] [PubMed] [Google Scholar]
- 7.Smedira NG, Hoercher KJ, Lima B, Mountis MM, Starling RC, Thuita L, Schmuhl DM, Blackstone EH; Unplanned hospital readmissions after HeartMate II implantation: frequency, risk factors, and impact on resource use and survival. JACC Heart Fail 2013;1(1):31–39. doi: 10.1016/j.jchf.2012.11.001. [DOI] [PubMed] [Google Scholar]
- 8.NRD Overview. Healthcare Cost and Utilization Project (HCUP). December 2015. Agency for Healthcare Research and Quality, Rockville, MD: www.hcup-us.ahrq.gov/nrdoverview.jsp. Accessed October 2, 2016. [PubMed] [Google Scholar]
- 9.Shah N, Chothani A, Agarwal V, Deshmukh A, Patel N, Garg J, Badheka A, Martinez M, Islam N, Freudenberger R; Impact of Annual Hospital Volume on Outcomes after Left Ventricular Assist Device (LVAD) Implantation in the Contemporary Era. J Card Fail 2016;22(3):232–237. doi: 10.1016/j.cardfail.2015.10.016. [DOI] [PubMed] [Google Scholar]
- 10.Tong L, Erdmann C, Daldalian M, Li J, Esposito T; Comparison of predictive modeling approaches for 30-day all-cause non-elective readmission risk. BMC Med Res Methodol 2016;16:26. doi: 10.1186/s12874-016-0128-0. [DOI] [PMC free article] [PubMed] [Google Scholar]
- 11.HCUP CCS. Healthcare Cost and Utilization Project (HCUP). May 2016. Agency for Healthcare Research and Quality, Rockville, MD: www.hcup-us.ahrq.gov/toolssoftware/ccs/ccs.jsp. Accessed October 3, 2016. [PubMed] [Google Scholar]
- 12.Baram D, Daroowalla F, Garcia R, Zhang G, Chen JJ, Healy E, Riaz SA, Richman P; Use of the All Patient Refined-Diagnosis Related Group (APR-DRG) Risk of Mortality Score as a Severity Adjustor in the Medical ICU. Clin Med Circ Respir Pulm Med 2008;2:19–25. [DOI] [PMC free article] [PubMed] [Google Scholar]
- 13.Healthcare Cost and Utilization Project (HCUP) NIS Notes. https://www.hcup-us.ahrq.gov/db/vars/hosp_bedsize/nisnote.jsp. Accessed January 31, 2017. [Google Scholar]
- 14.Hospital Database | Learn about the AHA Hospital Database & the AHA Annual Survey | AHA Data Online. https://www.ahadataviewer.com/about/hospital-database/. Accessed January 31, 2017. [Google Scholar]
- 15.Friedman B, Jiang HJ, Elixhauser A, Segal A; Hospital inpatient costs for adults with multiple chronic conditions. Med Care Res Rev MCRR 2006;63(3):327–346. doi: 10.1177/1077558706287042. [DOI] [PubMed] [Google Scholar]
- 16.Rader KA, Lipsitz SR, Fitzmaurice GM, Harrington DP, Parzen M, Sinha D; Bias-corrected estimates for logistic regression models for complex surveys with application to the United States’ Nationwide Inpatient Sample. Stat Methods Med Res 2017;26(5):2257–2269. doi: 10.1177/0962280215596550. [DOI] [PMC free article] [PubMed] [Google Scholar]
- 17.Starling RC, Moazami N, Silvestry SC, Ewald G, Rogers JG, Milano CA, Rame JE, Acker MA, Blackstone EH, Ehrlinger J, Thuita L, Mountis MM, Soltesz EG, Lytle BW, Smedira NG; Unexpected abrupt increase in left ventricular assist device thrombosis. N Engl J Med 2014;370(1):33–40. doi: 10.1056/NEJMoa1313385. [DOI] [PubMed] [Google Scholar]
- 18.Mehra MR, Naka Y, Uriel N, Goldstein DJ, Cleveland JC Jr, Colombo PC, Walsh MN, Milano CA, Patel CB, Jorde UP, Pagani FD, Aaronson KD, Dean DA, McCants K, Itoh A, Ewald GA, Horstmanshof D, Long JW, Salerno C; A Fully Magnetically Levitated Circulatory Pump for Advanced Heart Failure. N Engl J Med 2017;376(5):440–450. doi: 10.1056/NEJMoa1610426. [DOI] [PubMed] [Google Scholar]
- 19.Rogers JG, Pagani FD, Tatooles AJ, hat G, Slaughter MS, Birks EJ, Boyce SW, Najjar SS, Jeevanandam V, Anderson AS, Gregoric ID, Mallidi H, Leadley K, Aaronson KD, Frazier OH, Milano CA; Intrapericardial Left Ventricular Assist Device for Advanced Heart Failure. N Engl J Med 2017;376(5):451–460. doi: 10.1056/NEJMoa1602954. [DOI] [PubMed] [Google Scholar]
- 20.Dang NC, Topkara VK, Mercando M, Kay J, Kruger KH, Aboodi MS, Oz MC, Naka Y; Right heart failure after left ventricular assist device implantation in patients with chronic congestive heart failure. J Heart Lung Transplant 2006;25(1):1–6. doi: 10.1016/j.healun.2005.07.008. [DOI] [PubMed] [Google Scholar]
- 21.Kalogeropoulos AP, Kelkar A, Weinberger JF, Morris AA, Georgiopoulou VV, Markham DW, Butler J, Vega JD, Smith AL; Validation of clinical scores for right ventricular failure prediction after implantation of continuous-flow left ventricular assist devices. J Heart Lung Transplant 2015;34(12):1595–1603. doi: 10.1016/j.healun.2015.05.005. [DOI] [PubMed] [Google Scholar]
- 22.Meyer AL, Malehsa D, Budde U, Bara C, Haverich A, Strueber M; Acquired von Willebrand syndrome in patients with a centrifugal or axial continuous flow left ventricular assist device. JACC Heart Fail 2014;2(2):141–145. doi: 10.1016/j.jchf.2013.10.008. [DOI] [PubMed] [Google Scholar]
- 23.Uriel N, Pak S-W, Jorde UP, Jude B, Susen S, Vincentelli A, Ennezat PV, Cappleman S, Naka Y, Mancini D; Acquired von Willebrand syndrome after continuous-flow mechanical device support contributes to a high prevalence of bleeding during long-term support and at the time of transplantation. J Am Coll Cardiol 2010;56(15):1207–1213. doi: 10.1016/j.jacc.2010.05.016. [DOI] [PubMed] [Google Scholar]
- 24.Tabit CE, Chen P, Kim GH, Fedson SE, Sayer G, Coplan MJ, Jeevanandam V, Uriel N, Liao JK; Elevated Angiopoietin-2 Level in Patients With Continuous-Flow Left Ventricular Assist Devices Leads to Altered Angiogenesis and Is Associated With Higher Nonsurgical Bleeding. Circulation 2016;134(2):141–152. doi: 10.1161/CIRCULATIONAHA.115.019692. [DOI] [PMC free article] [PubMed] [Google Scholar]
- 25.Khazanie P, Hammill BG, Patel CB, Eapen ZJ, Peterson ED, Rogers JG, Milano CA, Curtis LH, Hernandez AF; Trends in the use and outcomes of ventricular assist devices among medicare beneficiaries, 2006 through 2011. J Am Coll Cardiol 2014;63(14):1395–1404. doi: 10.1016/j.jacc.2013.12.020. [DOI] [PMC free article] [PubMed] [Google Scholar]
- 26.Miller LW, Guglin M, Rogers J; Cost of Ventricular Assist Devices. Circulation 2013;127(6):743–748. doi: 10.1161/CIRCULATIONAHA.112.139824. [DOI] [PubMed] [Google Scholar]
- 27.Russo MJ, Gelijns AC, Stevenson LW, Sampat B, Aaronson KD, Renlund DG, Ascheim DD, Hong KN, Oz MC, Moskowitz AJ, Rose EA, Miller LW; The cost of medical management in advanced heart failure during the final two years of life. J Card Fail. 2008;14(8):651–658. doi: 10.1016/j.cardfail.2008.06.005. [DOI] [PubMed] [Google Scholar]
- 28.Williams ML, Trivedi JR, McCants KC, Prabhu SD, Birks EJ, Oliver L, Slaughter MS; Heart transplant vs left ventricular assist device in heart transplant-eligible patients. Ann Thorac Surg. 2011;91(5):1330–1333. doi: 10.1016/j.athoracsur.2011.01.062. [DOI] [PubMed] [Google Scholar]
- 29.Decision Memo for Ventricular Assist Devices for Bridge-to-Transplant and Destination Therapy (CAG-00432R). https://www.cms.gov/medicare-coverage-database/details/nca-decision-memo.aspx?NCAId=268.
- 30.Centers for Medicare and Medicaid Services. Reamissions reductin program (HRRP). https://www.cms.gov/medicare/medicare-fee-for-servicepayment/acuteinpatientpps/readmissions-reduction-program.html.
Associated Data
This section collects any data citations, data availability statements, or supplementary materials included in this article.