

Abstract

The present study describes the strategic doping of Fe metal ions into a BiOI microstructure using ex situ and in situ processes to synthesize a Fe–BiOI microstructure and their effect on photocatalytic degradation of tetracycline (TC). The data suggested that in situ Fe–BiOI (Fe–BiOI-In) has superior performance compared to ex situ Fe–BiOI (Fe–BiOI-Ex) due to the uniform dispersion of Fe within the Fe–BiOI material. Calculated bandgaps ∼1.8, ∼1.5, and 2.4 eV were observed for BiOI (without Fe), Fe–BiOI-In, and Fe–BiOI-Ex, respectively. Interestingly, Fe incorporation within BiOI might decrease the bandgap in Fe–BiOI-In due to the uniform distribution of metal ions, whereas increasing the bandgap in Fe–BiOI-Ex attributed to nonuniform distribution or agglomeration of metal ions. The uniform dispersion of Fe within Fe–BiOI modulates electronic properties as well as increases the exposure of Fe ions with TC, thereby higher degradation efficiency of TC. The in situ Fe–BiOI material shows 67 and 100% degradation of TC at 10 and 1 mg/L, respectively. The TC degradation was also found to be pH-dependent; when increasing the pH value up to 10, 94% degradation was achieved at 10 mg/L within 60 min of solar irradiation. The analysis was also performed over BiOI, which proves that Fe has a profound effect on TC degradation as Fe(II) tends to trigger oxidation–reduction by utilizing the chelate formation tendency of TC. Therefore, the prepared Fe–BiOI-In has the potential ability to degrade pharmaceutical compounds, especially, TC from wastewater.
Introduction
Water crisis is one of the largest problems throughout the world which creates a serious threat to global health and economic development as well as the sustainable development of human beings. The supply of nonpolluted water globally is one of the great challenges with the escalating demand as a mounting population. Usually, water crisis is mainly due to the various contaminants such as heavy metal ions, pharmaceuticals, polyphenols, and dyes, and so forth.1−3 The contamination of pharmaceutical antibiotic compounds such as ampicillin, ciprofloxacin, tetracycline (TC), oxytetracycline, salicylic acid, and so forth is of major concern due to their extensive use in medical treatment. TC is the second largest produced antibiotic, which has been extensively used in human and animal treatments against bacterial infection. Usually, around less than 100 ng/L TC was found in aquatic samples, whereas more than 100 ng/L was found in wastewater samples. However, due to the poor metabolization rate and incomplete utilization in the human body, it can enter the ecosystem in its active form, thereby easily developing antibiotic resistance. Also, antibiotic residues in the environment result in chronic and acute toxicity in humans and animals.3−9 Therefore, it is necessary to remove the residual of TC antibiotics from the ecological system. To treat water crisis-related issues, advancement in available technologies for the complete degradation of contaminants from the aqueous environment is needed to fulfill the future requirement.
In this perspective, photocatalysts have caught considerable attention over the last decades due to the utilization of enriching source of solar energy for contamination degradation, together with the development of an efficient photocatalyst. Several traditional semiconductor photocatalysts, such as TiO2, CdS, C3N4, and ZnO-based photocatalysts and so forth, are broadly used to remove pharmaceutical compounds from water. However, due to their extended electronic bandgaps, these photocatalysts are not suitable to absorb a wide range of the electromagnetic spectrum, resulting in a complex degradation process.10−14 In this context, bismuth oxyhalide (BiOX, X = Cl, Br, and I)-based photocatalysts have a low tunable bandgap due to their suitable crystal structure, favorable for utilizing as a high-efficiency photocatalyst for degradation of several organic contaminants. In the family of BiOX, a photocatalyst based on BiOI has the bandgap value ranging from 1.72 to 1.9 eV which can utilize a wide range of the electromagnetic spectrum. Despite several advantages, BiOI has several disadvantages such as low quantum yield, less photo-oxidation capability, and fast recombination rate, limiting its application as a photocatalyst.15−22 Therefore, there is a need to improve BiOI in terms of complete utilization of the photocatalytic property. To overcome these issues, several strategies such as designing a heterostructure including several types of metallic and nonmetallic semiconductors have been synthesized to advance the photocatalytic response in terms of preventing the recombination rate as well as increasing the quantum yield.
To stabilize the aforementioned strategies within the BiOI microstructure, the photocatalytic performance can be improved. In this context, different metal modifications might improve the electronic structure in terms of photon absorption ability and recombination rate, thereby reducing the bandgap energy (Eg) value of BiOI. Numerous metal ions such as Fe3O4, CeO2, Er, Pb, Au, Ag, In, and Zn-doped BiOI have been synthesized for the photocatalytic degradation of contaminants.23−28 Moreover, the incorporation of metal ions might decrease/increase the bandgap value that depends on the metal and dispersion or agglomeration of metal ions within the BiOI. Most of the metal-doped BiOI have been synthesized by using the simple dipping (ex situ) process; for example, Malathi et al.29 synthesized the α-FeOOH/BiOI nanocomposite for the degradation of rhodamine B. Fe doping was performed by the wet impregnation method or ex situ process.29 However, nonuniform dispersion, leach out ability, and agglomeration of metal ions onto the surface of BiOI might decrease the degradation efficiency and could not provide significant variation in the bandgap value. The in situ doping approach was also used by some authors to enhance degradation efficiency. Here are some literature studies discussing the step doping approach and their effect on the degradation of a pollutant; for example, Rao et al.25 synthesized Zn-doped BiOI microspheres using a one-step solvothermal process. The synthesized microsphere was further applied for photo-oxidative removal of NO. The author stated that enhanced photodegradation efficiency was due to metal doping which regulates crystal growth in the desired direction subsequently creating oxygen defect which inhibits recombination and subsequently enhances photodegradation efficiency.25 Song et al.23 synthesized Er3+-doped BiOI0.5Cl0.5 utilizing a one-step solvothermal method over Ni foam. Herein, the author utilized the one-step doping approach which subsequently alters the electronic structure of BiOI0.5Cl0.5 by creating oxygen defects due to metal doping which results in higher photocatalytic performance toward Acid Red.23 The above-mentioned literature justifies that the one step metal doping approach is supposed to be an effective one to enhance photodegradation performance. The changes in the bandgap might be depending on various factors like doping strategy and metal ions. However, relatively few changes in the bandgap are still a concern. Therefore, there is a need to justify a metal doping strategy that resolves or enhances such issues associated with a simple doping approach followed by enhancing degradation efficiency.
In this context, our present study focuses on the synthesis of Fe–BiOI using a strategic doping approach for photocatalyst degradation of TC. The Fe–BiOI-based photocatalyst was synthesized by two different synthesis routes such as ex situ and in situ doping of Fe metal ions followed by analyzing the TC degradation performance for both methods. The novelty of the present study is Fe in situ incorporation within the BiOI microstructure that has several advantages such as (1) uniform dispersion of metal ions within the microstructure, (2) preventing agglomeration of metal ions, (3) decreasing the bandgap of BiOI, (4) insignificant metal leaching that protects the environment, and (5) creation of oxygen defects, thereby improved the photocatalytic degradation of TC. Therefore, the present study defines the best possibility of metal doping for the degradation of pharmaceutical compounds especially TC.
Results and Discussion
SEM and EDX Analysis
Figure 1 shows the scanning electron microscopy (SEM) images of Fe–BiOI-In and Fe–BiOI-Ex microsphere samples. Figure 1a,a′ shows the lower and higher magnification images of Fe–BiOI-In. As observed from the SEM image, a porous and spherical microsphere was observed with interconnected nanosheets (Figure 1a). The higher magnification SEM images of Fe–BiOI-In show the well-packed thick nanosheets that are connected with other nanosheets to produce the structure of a microsphere with large pores (Figure 1a′). The porous structure and well-packed nanosheet walls of the Fe–BiOI-In microsphere might improve the exposure as well as degradation efficiency of TC. Figure 1b,b′ shows lower and higher magnification SEM images of the Fe–BiOI-Ex microsphere sample. As observed from the SEM images, nonporous or blocked pores and spherical microspheres were observed with interconnected thin nanosheets (Figure 1b). The SEM images of Fe–BiOI-Ex microspheres (higher magnification) show the nonporous microsphere (Figure 1b′). Moreover, thin nanosheets of Fe–BiOI-Ex microspheres were observed compared with that of the Fe–BiOI-In microsphere. The thin nanosheets of the Fe–BiOI-Ex microspheres might increase the surface area of the materials, as discussed later in the manuscript. The different metal ion doping strategy might be controlling the growth direction of the crystal that controls the thickness of the nanosheets.28,30 The porous structure of the Fe–BiOI-In microsphere becomes nonporous in the Fe–BiOI-Ex microsphere sample due to the agglomeration of Fe metal ions or nonuniform distribution of metal ions. Interestingly, different doping approaches of Fe metal ions might alter the structure of the microsphere in terms of pores. The nonporous or blocked pores due to the agglomeration of Fe metal ions or nonuniform distribution of metal ions within the Fe–BiOI-Ex microspheres that might decrease the exposure and degradation efficiency of the TC, as discussed later in the manuscript.
Figure 1.

SEM images, (a,a′), Fe–BiOI-In, and (b,b′), Fe–BiOI-ex situ.
Figure 2 shows the elemental mapping and energy-dispersive X-ray (EDX) spectra of Fe–BiOI-In and Fe–BiOI-Ex samples. Figure 2a shows the elemental mapping of the Fe–BiOI-In sample. As observed from the analysis, the presence of Fe metal ions confirms that the Fe is incorporated within the BiOI microsphere. The elemental mapping of the Fe–BiOI-In sample showed the uniform distribution of Fe metal ions within the BiOI microsphere. Figure 2b,c shows the EDX spectra of Fe–BiOI-In and Fe–BiOI-Ex samples. The presence of Fe metal ions in both samples confirms the Fe metal ions incorporated within BiOI by using both strategic doping approaches. Interestingly, higher metal loading around 0.8% (w/w) Fe elements was observed in the Fe–BiOI-Ex sample, whereas approximately half [0.4% (w/w)] Fe elements were observed in the Fe–BiOI-In sample. The higher loading of Fe on to the surface of BiOI due to the agglomeration of metal ions blocks the pores, whereas the low loading of Fe due to the uniform distribution of metal ions maintains the porous structure of the BiOI microsphere, which is confirmed from the SEM images. It is important to mention here that there are significant changes in the Fe and O contents in the Fe–BiOI-In and Fe–BiOI-Ex samples. During the ex situ process, the Fe metal blocks the pores of the Fe–BiOI surface which is also confirmed from the SEM images. Therefore, the high content of Fe and O was observed in the Fe–BiOI-Ex samples.
Figure 2.

Elemental mapping and EDX of Fe–BiOI (a) Elemental mapping of Fe–BiOI-In, (b) EDX of Fe–BiOI-In, and (c) Fe–BiOI-Ex samples.
XRD Analysis
The crystallinity and crystal size of the synthesized Fe–BiOI-In and Fe–BiOI-Ex microsphere samples were determined from the XRD spectra. Figure 3 shows the XRD spectra of the Fe–BiOI-In and Fe–BiOI-Ex microsphere samples. As observed from the spectra, characteristic peaks of Fe–BiOI-In were observed at 2θ angles of 29.72, 31.61, 45.54, and 55.16. These characteristics peaks which belong to the (102), (110), (200), and (212) crystallographic planes, respectively, are well-matched to the tetragonal BiOI (JCPDS no. 73-2062).31,32 Also, three characteristic peaks of Fe at 45.46, 66.34, and 84.03 correspond to the three crystal planes (011), (002), and (112), respectively, and are well-matched with the α-Fe2O3 structure and had no significant effect on the BiOI microsphere crystal. However, Fe–BiOI-Ex shows characteristic peaks at 2θ angles of 33.31, 47.83, 59.54, and 69.96. These characteristics peaks belong to the (011), (002), (112), and (022) crystallographic planes of the cubic BiOI crystal, respectively. Also, three characteristic peaks of Fe at 41.07, 54.31, and 78.20 correspond to the three crystal planes (111), (002), and (022), respectively, which are well-matched with the γ-Fe2O3 structure, whereas the γ-Fe2O3 phase of Fe during ex situ doping significantly changed the BiOI crystal structure from the tetragonal to cubic phase of the composite magnetic material γ-Fe2O3/BiOI from the standard BiOI tetragonal phase structure (ICDD 98-015-9354). The crystal structure of BiOI changed on changing the doping approach of metal salts from ex situ to in situ. During the metal doping process, the metal is incorporated into the crystal structure of the BiOI microsphere. Also, the dopant metal will affect the structure by expanding or contracting it which subsequently changes the symmetry.33 Moreover, phase changes of BiOI might be affected by photocatalytic degradation efficiency of contaminants. Interestingly, α-Fe3O4 is the most stable iron oxide at ambient conditions that aided being advantageous to the adsorbed contaminants on the surface of BiOI, thereby improving photocatalytic degradation efficiency,34−36 which is discussed later in the manuscript.
Figure 3.

XRD spectra of Fe–BiOI-In and Fe–BiOI-Ex samples.
BET Surface Area and Pore Size Distribution
Figure 4 shows the pore size distribution (PSD) of the Fe–BiOI-In and Fe–BiOI-Ex samples. Table 1 shows the BET surface area and PSD of the Fe–BiOI-In and Fe–BiOI-Ex samples. The BET surface areas of Fe–BiOI-In and Fe–BiOI-Ex were calculated ∼8 and 15 m2 g–1, respectively. The smaller BET surface area of Fe–BiOI-In due to the uniform distribution of Fe metal ions within BiOI blocks micro- and mesoporosity of the materials, whereas the highest surface area of Fe–BiOI-Ex due to the nonuniform doping or agglomeration of metal ions on the surface of BiOI blocks only the macroporosity of the sample. The thin nanosheets of the Fe–BiOI-Ex sample might increase the surface area, which is confirmed from SEM analysis. The BET surface area mainly depends on the micro- and mesoporosity of the materials. The total pore volume was larger for Fe–BiOI-In (0.05 cm3/g) which was supposed to be the formation of large pores or macropores which creates mesoporosity over the microsphere surface. On the other hand, for Fe–BiOI-Ex, the total pore volume of (0.013 cm3/g) was observed which is smaller than that of the Fe–BiOI-In sample attributed to the agglomeration of metal ions on the surface of BiOI. The PSD was calculated using the BJH method for mesopores (2–40 nm) and density functional theory for micropores (<2 nm). The pore diameter for Fe–BiOI-In (1.8 nm) was also found to be larger than Fe–BiOI-Ex (1.6 nm) which confirms the larger pore formation over the microsphere surface due to uniformly doped metal particles which were deeply embedded over inside the microsphere surface, which is also confirmed by the SEM analysis discussed earlier in the manuscript. The large macroporous structure of Fe–BiOI-In leads to exposure of TC that improved the photocatalytic degradation efficiency, as discussed later in the manuscript.
Figure 4.
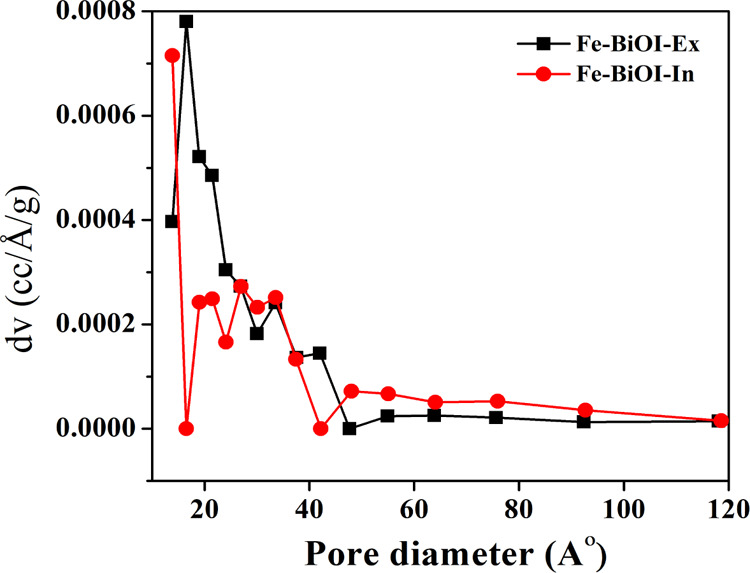
PSD of Fe–BiOI-In and Fe–BiOI-Ex microsphere samples.
Table 1. BET Surface Area and Pore Size Distribution Analysis.
| material | SSA (m2/g) | total pore volume (cm3g–1) | pore diameter (nm) | degradation efficiency (%) |
|---|---|---|---|---|
| Fe–BiOI-In | 8 | 0.051 | 1.8 | 67 |
| Fe–BiOI-Ex | 15 | 0.013 | 1.6 | 49 |
FTIR Analysis
Figure 5 shows the FT-IR spectra to determine the surface functional group of the Fe–BiOI-In microsphere sample. The characteristic absorption peaks of Fe–BiOI-In were observed at 528, 1375, and 1650 cm–1. The peak at 528 cm–1 is associated with the Bi–O stretching mode, while the absorption peaks at 1375 cm–1 could be assigned as the asymmetry and symmetric stretching vibration peaks for the Bi–I band. Additionally, Fe doping was also observed through some characteristics peaks at 631 and 527 cm–1 which are due to the Fe–O stretching vibration which confirms the doping of Fe over the BiOI microsphere. Similar characteristic peaks were also observed in Fe–BiOI-Ex samples; data did not produce due to brevity. The FT-IR analysis confirms that Fe–BiOI-In was successfully synthesized, which was earlier confirmed from the elemental mapping, EDX analysis, and XRD analysis, discussed earlier in the manuscript.
Figure 5.

FT-IR spectra of the Fe–BiOI-In microsphere sample.
Band Gap Value
Table 2 shows the bandgap energy and percentage degradation efficiency of different materials such as BiOI, Fe–BiOI-In, and Fe–BiOI-Ex samples. The bandgaps of BiOI, Fe–BiOI-In, and Fe–BiOI-Ex microspheres were calculated to be approximately 1.8, 1.5, and 2.4 eV, respectively. The variation in the bandgap might be attributed to the changes in crystallinity, phase changes, and structural changes due to the incorporation of metal ions by using different doping approaches. Interestingly, the incorporation of the metal ions might decrease or increase the bandgap value that depends on the different doping approaches such as in situ and ex situ doping processes. Fe–BiOI-In has a smaller bandgap value attributed to the uniform distribution of metal ions within the microsphere, whereas a higher bandgap value is attributed to agglomeration or nonuniform distribution of metal ions within the BiOI microsphere. The decrement of the band gap in Fe–BiOI-In might enhance the electronic structure in terms of photon absorption ability and recombination rate. Several studies also suggested that the bandgap value increases upon increasing the metal ion concentration by using a simple doping process (ex situ process) due to the agglomeration of metal ions.29,37 The data suggested that the low bandgap has high degradation efficiency (Table 2). Therefore, the in situ metal doping process might be beneficial in terms of decreasing the bandgap value and improving the electronic structures of the materials, thereby resulting in high photocatalytic efficiency.
Table 2. Different Materials of the Bandgap Value and Its Effect on Degradation Efficiency of TC.
| materials | band gap (eV) | percentage of degradation |
|---|---|---|
| BiOI | 1.8 | 22.68 |
| Fe–BiOI-In | 1.4 | 67.53 |
| Fe–BiOI-Ex | 2.4 | 50.26 |
Photocatalytic Performance
The photocatalytic performance of the Fe–BiOI-In and Fe–BiOI-Ex samples was determined against TC degradation at different conditions at an initial concentration of 10 mg/L. The effect of various operating conditions such as reaction time (0–60 min) and initial pH on the photocatalytic degradation efficiency of TC was also determined. Figure 6a shows that photocatalytic degradation (%) of TC using BiOI, Fe–BiOI-In, and Fe–BiOI-Ex samples at different time intervals (0–60 min). As observed from the figure, the photocatalytic degradation (%) increased with increasing time. A higher degradation of TC ∼ 67% was observed in the Fe–BiOI-In sample, whereas a low degradation of TC ∼ 50 and 22% was observed in Fe–BiOI-Ex and BiOI samples, respectively. The higher degradation (%) of TC in the Fe–BiOI-In sample is due to the uniform Fe metal ion distribution within the BiOI microsphere, whereas low degradation (%) of TC in the Fe–BiOI-Ex sample is attributed to nonuniform distribution or agglomeration of Fe metal ions that block the pores of the BiOI surface and phase changes, which is confirmed from the SEM images and XRD analysis. On the other hand, BiOI (without Fe metal) shows the lowest degradation ability which confirms that the Fe metal increases the photocatalytic degradation of TC. It is important to mention here that metal ion doping controlled the thickness of nanosheets as well as stimulated the formation of oxygen vacancy.25,38,39 The uniform distribution of metal ions within BiOI (Fe–BiOI-In) might be beneficial for the formation of oxygen vacancy, thereby resulting in high degradation (%) of TC.
Figure 6.

Photocatalytic degradation of TC using different BiOI microspheres. (a) Photocatalytic degradation (%) of TC using BiOI, Fe–BiOI-In, and Fe–BiOI-Ex, (b) UV-spectra of TC degradation using Fe–BiOI-In, (c) photocatalytic degradation (%) of TC using Fe–BiOI-In at different concentrations (1, 5, 10, and 20 ppm), and (d) degradation as a function of time.
Figure 6b shows the UV–visible light spectra of TC under different times of irradiation in the presence of the Fe–BiOI-In material. As observed from the figure, photocatalytic degradation of TC increased on increasing the irradiation time up to 40 min. After 40 min of irradiation time, photocatalytic degradation becomes almost stable and reaches a maximum degradation value of ∼99% within 60 min.
Figure 6c shows the photocatalytic degradation (%) of TC using Fe–BiOI-In samples at different concentrations (1, 5, 10, and 20 ppm). As observed from the figure, 100% photocatalytic degradation was observed at a lower concentration (1 ppm) by using Fe–BiOI-In within 20 min of irradiation time. Upon increasing the concentration up to 20 ppm, the TC degradation efficiency decreases to 44.7%. 100% degradation was achieved at a lower concentration due to the availability of the active sites on the surface of Fe–BiOI-In that increases the generation OH radicals, thereby resulting in high degradation efficiency.
Figure 6d shows the decrease of the dimensionless concentration (C/C0) of TC using Fe–BiOI-In as a function of reaction time. As observed from the figure, the degradation of TC increased with the time of light exposition. The degradation efficiency was higher at lower concentrations indicating the unavailability of the photocatalyst surface for the generation of hydroxyl radicals at a higher concentration which reduces the overall degradation. It has been indicated that Fe–BiOI-In photocatalyst efficiency depends on several factors: (1) the formation of nanostructures or nanosheets on the Fe–BiOI-In surface, (2) porous microstructure and large pore volume, and (3) uniform doping of Fe metal ions within the BiOI microstructure. The optical property of Fe–BiOI-In was evaluated using UV–visible diffuse reflectance spectra, and the calculated bandgap of Fe–BiOI-In was ∼1.5 eV, which is lower than the Fe–BiOI-Ex material. The lower bandgap value of Fe–BiOI-In aided being advantageous to improve photocatalytic degradation of TC. Moreover, Fe doping within Fe–BiOI-In induces the formation of oxygen vacancy defect, which also improved photocatalytic degradation of TC.
Effect of pH on TC Degradation
The pH study was performed to evaluate the mechanism of TC degradation as this is one of the most important parameters. To check the effect of pH on TC degradation, different pH (2, 6, and 10) was used with 10 ppm of initial TC concentration and the same catalytic dose of 400 mg/L. Figure 7 shows the photocatalytic degradation (%) efficiency of TC using the Fe–BiOI-In material at different pH conditions. As observed from the figure, photocatalytic degradation (%) efficiency of TC decreases with the decreasing pH value from 10 to 2. The maximum degradation (∼94%) was achieved at pH 10; on further decreasing the pH value to 6 and 2, the photocatalytic degradation decreases from 67 to 41%, respectively. The photocatalytic degradation of TC depends on the speciation of TC and Fe–BiOI-In materials. TC exists as positive, neutral, and negatively charged, at three main pKa values of 3.3, 7.7, and 9.7 respectively.40 The degradation of TC increased as the pH of the solution varied from 2 to 10, and maximum degradation occurred in pH 10. The pHpzc of Fe–BiOI is mainly due to Fe loading over the BiOI microstructure, and Fe is mainly found in the form of positive species as pH increased upto 10. At pH 10, Fe was mainly found in the form of positive species where degradation occurred by adsorption of TC which is probably related to electrostatic interaction between the positively surface of Fe–BiOI-In and more number of negatively charged TC molecules.
Figure 7.

Photocatalytic degradation (%) of TC using the Fe-BioI-In microsphere at different pH.
In another explanation of TC degradation, the mechanism can be explained with the generation of OH radicals using Fe–BiOI-In. The BiOI framework contains Fe metal particles in the form of Fe(II) and Fe(III); these Fe particles can activate •OH and •O2 under visible light irradiation by initializing Fenton reaction which further proceeds to the degradation of TC. According to the proposed mechanism, VB and CB potentials for BiOI are 2.42 and 0.45 eV from where photoexcited electrons transferred to the CB of Fe to react with oxygen species and formed superoxide radicals. Next, positive hole transfer from the VB of Fe to the VB of BiOI takes place to produce hydroxyl radicals (•OH). These generated radicals will further degrade TC. Therefore, it can be concluded that BiOI actively participates in the photodegradation process; hence, it acts like an active composite in photodegradation of TC.29
Generally, Fe3+ can turn into Fe2+and Fe4+ions by trapping photogenerated electrons and holes, respectively. Furthermore, the Fe2+and Fe4+ions have half-filled 3d5 orbitals and more unstable than the Fe3+ ions. Therefore, Fe2+ ions can be oxidized to Fe3+ ions by transferring electrons and the adsorbed O2 molecule on the surface of a Fe–BiOI-In. The adsorbed O2 molecule is reduced to form superoxide radicals (O2), which can degrade TC. Similarly, Fe4+ions are also reduced to Fe3+ ions by releasing electrons, while the hydroxyl groups on the surface of Fe–BiOI-In can translate into hydroxyl radicals (•OH). Thus, the active species (h*, OH, and O2) can join in the oxidation of TC and finally produce CO2, H2O, and so forth.40−45 Therefore, the synthesized Fe–BiOI-In has been the potential ability for the photocatalytic degradation of TC.
Photostability and Recyclability
To study the stability, the synthesized Fe–BiOI-In based photocatalyst material against TC degradation was retrieved and washed with water and ethanol and then dried in an oven at 60 °C to further utilize in the photocatalyst experiments. Figure 8 shows the photostability and recyclability of the Fe–BiOI-In-based photocatalyst material. As observed from the figure, no significant changes were observed in the degradation (%) of TC up to five cycles. 60% degradation after four cycles or fifth cycle is attributed to the synthesized Fe–BiOI-In microsphere that has high stability and can be reused up to five cycles, which is important in photocatalytic application.
Figure 8.

Photo-stability and recyclability of the Fe–BiOI-In based photocatalyst material.
Conclusions
In this study, efficient Fe–BiOI microspheres were facile synthesized through two different approaches namely in situ and ex situ processes. The synthesized both types of Fe-doped BiOI microspheres were applied for comparative analysis of TC degradation. It was observed that the Fe–BiOI-In synthesized microsphere consists of a perfect porous structure and, also, the degradation efficiency was higher compared to the Fe–BiOI-Ex microsphere. The SEM images confirm that Fe–BiOI-In or in situ metal doping leads to the uniform distribution of Fe metal particles within the BiOI microsphere while the Fe–BiOI-Ex or ex situ doping process leads to agglomeration and leaching during TC degradation resulting in the generation of secondary pollutants during photocatalytic degradation. The maximum degradation using Fe–BiOI-In was 100% at 1 ppm of TC concentration while 67% was achieved using 10 ppm. Moreover, Fe–BiOI-Ex shows 50% degradation using 10 ppm of TC concentration. Additionally, the proposed TC degradation is based on the active species (h*, OH, and O2) that can join in the oxidation of TC and finally produce CO2, H2O, and so forth. Therefore, strategic doping approaches, especially, the in situ doping process, might be a promising alternative for the photocatalytic degradation of organic pollutants.
Experimental Section
Chemicals
Bismuth nitrate pentahydrate [Bi(NO3)3·5H2O], potassium iodide (KI), ethylene glycol [(CH2OH)2], TC, and Ferric chloride (FeCl3) were purchased from Sigma-Aldrich, Chile. All chemicals and reagents used in the present study were of high purity and analytical grade. All test samples were prepared in Milli-Q water.
Synthesis of Fe–BiOI Microspheres
The Fe–BiOI microspheres were synthesized using a facile solvothermal process. Initially, 1 mM Bi(NO3)3·5H2O and 1 mM of KI were dissolved in 40 mL of (CH2OH)2 solution, separately and continuously stirred to prepare homogenous solutions. Next, a homogenous solution of KI was added drop by drop into the Bi(NO3)3·5H2O solution and stirred up to 30 min. After 30 min of stirring, 0.5 g of FeCl3 powder was added and continuously stirred for the next 30 min to produce homogenous suspension of FeCl3–Bi(NO3)3·5H2O-KI. The homogenous suspension of FeCl3–Bi(NO3)3·5H2O-KI was transferred into a Teflon lined autoclave reactor (100 mL capacity) and heated at 145 °C for 18 h to produce Fe–BiOI-in situ microspheres. The synthesized Fe–BiOI-in situ microspheres were washed several times with ethanol and water separately to remove excess or nonadhered KI and Fe from BiOI microspheres. After washing, samples were kept at 60 °C for 12 h.
For the comparison purpose, some other samples like BiOI (without Fe) and Fe–BiOI ex situ microspheres were also prepared using similar processes. For the synthesis of Fe–BiOI ex situ microspheres, 0.5 g of FeCl3 powder was dissolved in 20 mL of Milli-Q water to produce a homogenous solution. 3 g of BiOI microspheres was mixed into a homogenous solution of FeCl3 and kept for 24 h at room temperature (∼20 °C). After the incubation period, the sample was dried at 60 °C for 24 h. The dried Fe–BiOI ex situ sample was washed twice with water and again dried for 24 h. All dried BiOI microsphere samples were stored in amber vials for further analysis. For the reference purpose, Fe–BiOI-in situ and Fe–BiOI-ex situ-based microspheres were named Fe–BiOI-In and BiOI-Ex, respectively. Scheme 1 shows the graphical illustration of the synthesis of the Fe–BiOI-In microsphere.
Scheme 1. Graphical Illustration of the Synthesis of the Fe–BiOI-In Microsphere.

Photocatalytic Degradation of TC
The photocatalytic degradation of TC was performed using a solar simulator under xenon lamp irradiation (VIPHID 6000 k, 12 W). A borosilicate glass photocatalytic reactor was filled with 250 mL of a different concentration (1, 5, 10, and 20 ppm) of TC solution. Next, BiOI-In and BiOI-Ex-based microsphere samples (photocatalyst) were added into a separate reactor. The suspension was kept thoroughly stirred in the dark until the adsorption–desorption equilibrium was achieved. Different doses of the photocatalyst were tested, from 200 to 600 mg/L, and all experiments were performed at a standardized 400 mg/L dose. Similarly, the pH value of the suspension varied with pH ranges (2–10). The temperature of the photocatalytic reactor was maintained at room temperature by recirculating tap water through the reactor jacket and continuously stirring during entire experiments. Samples of 5 mL were taken from the reactor at 0, 5, 10, 15, 20, 30, 40, 50, and 60 min and filtered using a 0.22 μm syringe filter. The samples were kept in the dark for 30 min before photocatalytic degradation. The analysis was performed with a UV–visible spectrophotometer (Thermo Scientific evolution 220) in the wavelength range of 200 to 800 nm.
Material Characterization
The surface structures of the BiOI-In and BiOI-Ex-based microsphere samples were characterized by using different analytical techniques such as field emission SEM (Fe-SEM) equipped with EDX, XRD, diffuse reflectance UV–vis spectroscopy (DRS), Fourier transform infrared (FT-IR) spectroscopy, and BET surface area analysis. The surface morphology of the samples was characterized by using SEM (MIRA3-, TESCAN, A.S., Brno, Czech Republic). The metal composition of the samples was observed by using EDX (Oxford, Inc., Germany). EDX mapping was performed to confirm the uniform distribution of the Fe metal in the Fe–BiOI-In sample. The XRD pattern of the samples was determined to obtain the crystal pattern and crystalline size of the samples. The Cu Kα radiation (k = 1.54178 Å) at a scan rate of 5 °C per min was used for the XRD patterns. The bandgap of the samples was calculated by DRS, using a UV–vis spectrophotometer, equipped with an integrating sphere (Thermo Scientific evolution 220). The BET surface area analysis (multipoint) was measured from N2 adsorption/desorption isotherms using the Autosorb-1Quantachrome Instrument. The presence of various surface functional groups on BiOI-In and BiOI-Ex-based microsphere samples was determined using FTIR (Bruker, Germany). The bandgap calculated using the Kubelka and Munk process from DRS.
Acknowledgments
The authors acknowledge the financial support of CONICYT through the FONDECYT project no. 3190515 and 319581.
The authors declare no competing financial interest.
References
- Talreja N.; Kumar D.; Verma N. Removal of hexavalent chromium from water using Fe-grown carbon nanofibers containing porous carbon microbeads. J. Water Process. Eng. 2014, 3, 34–45. 10.1016/j.jwpe.2014.08.001. [DOI] [Google Scholar]
- Kumar V.; Talreja N.; Deva D.; Sankararamakrishnan N.; Sharma A.; Verma N. Development of bi-metal doped micro- and nano multi-functional polymeric adsorbents for the removal of fluoride and arsenic(V) from wastewater. Desalination 2011, 282, 27–38. 10.1016/j.desal.2011.05.013. [DOI] [Google Scholar]
- Talreja N.; Verma N.; Kumar D. Carbon Bead-Supported Ethylene Diamine-Functionalized Carbon Nanofibers: An Efficient Adsorbent for Salicylic Acid. Clean: Soil, Air, Water 2016, 44, 1461–1470. 10.1002/clen.201500722. [DOI] [Google Scholar]
- Wang D.; Jia F.; Wang H.; Chen F.; Fang Y.; Dong W.; Zeng G.; Li X.; Yang Q.; Yuan X. Simultaneously efficient adsorption and photocatalytic degradation of tetracycline by Fe-based MOFs. J. Colloid Interface Sci. 2018, 519, 273–284. 10.1016/j.jcis.2018.02.067. [DOI] [PubMed] [Google Scholar]
- Hao R.; Xiao X.; Zuo X.; Nan J.; Zhang W. Efficient adsorption and visible-light photocatalytic degradation of tetracycline hydrochloride using mesoporous BiOI microspheres. J. Hazard. Mater. 2012, 209–210, 137–145. 10.1016/j.jhazmat.2012.01.006. [DOI] [PubMed] [Google Scholar]
- Cao H.-L.; Cai F.-Y.; Yu K.; Zhang Y.-Q.; Lü J.; Cao R. Photocatalytic Degradation of Tetracycline Antibiotics over CdS/Nitrogen-Doped–Carbon Composites Derived from in Situ Carbonization of Metal–Organic Frameworks. ACS Sustain. Chem. Eng. 2019, 7, 10847–10854. 10.1021/acssuschemeng.9b01685. [DOI] [Google Scholar]
- Wu S.; Hu H.; Lin Y.; Zhang J.; Hu Y. H. Visible light photocatalytic degradation of tetracycline over TiO2. Chem. Eng. J. 2020, 382, 122842. 10.1016/j.cej.2019.122842. [DOI] [Google Scholar]
- Zhou C.; Lai C.; Xu P.; Zeng G.; Huang D.; Li Z.; Zhang C.; Cheng M.; Hu L.; Wan J.; Chen F.; Xiong W.; Deng R. Rational Design of Carbon-Doped Carbon Nitride/Bi12O17Cl2 Composites: A Promising Candidate Photocatalyst for Boosting Visible-Light-Driven Photocatalytic Degradation of Tetracycline. ACS Sustain. Chem. Eng. 2018, 6, 6941–6949. 10.1021/acssuschemeng.8b00782. [DOI] [Google Scholar]
- Lu Z.-Y.; Ma Y.-L.; Zhang J.-T.; Fan N.-S.; Huang B.-C.; Jin R.-C. A critical review of antibiotic removal strategies: Performance and mechanisms. J. Water Process. Eng. 2020, 38, 101681. 10.1016/j.jwpe.2020.101681. [DOI] [Google Scholar]
- Li G.; Wang Y.; Mao L. Recent progress in highly efficient Ag-based visible-light photocatalysts. RSC Adv. 2014, 4, 53649–53661. 10.1039/c4ra08044k. [DOI] [Google Scholar]
- Zhao X.; Zhang G.; Zhang Z. TiO2-based catalysts for photocatalytic reduction of aqueous oxyanions: State-of-the-art and future prospects. Environ. Int. 2020, 136, 105453. 10.1016/j.envint.2019.105453. [DOI] [PubMed] [Google Scholar]
- Bahnemann D. Photocatalytic water treatment: solar energy applications. Sol. Energy 2004, 77, 445–459. 10.1016/j.solener.2004.03.031. [DOI] [Google Scholar]
- Wang J.; Zhang G.; Li J.; Wang K. Novel Three-Dimensional Flowerlike BiOBr/Bi2SiO5 p–n Heterostructured Nanocomposite for Degradation of Tetracycline: Enhanced Visible Light Photocatalytic Activity and Mechanism. ACS Sustain. Chem. Eng. 2018, 6, 14221–14229. 10.1021/acssuschemeng.8b02869. [DOI] [Google Scholar]
- Chen F.; Huang H.; Zeng C.; Du X.; Zhang Y. Achieving Enhanced UV and Visible Light Photocatalytic Activity for Ternary Ag/AgBr/BiOIO3: Decomposition for Diverse Industrial Contaminants with Distinct Mechanisms and Complete Mineralization Ability. ACS Sustain. Chem. Eng. 2017, 5, 7777–7791. 10.1021/acssuschemeng.7b01259. [DOI] [Google Scholar]
- Xiong J.; Song P.; Di J.; Li H. Bismuth-rich bismuth oxyhalides: a new opportunity to trigger high-efficiency photocatalysis. J. Mater. Chem. A 2020, 8, 21434–21454. 10.1039/d0ta06044e. [DOI] [Google Scholar]
- Liu W.-W.; Peng R.-F. Recent advances of bismuth oxychloride photocatalytic material: Property, preparation and performance enhancement. J. Electron. Sci. Technol. 2020, 18, 100020. 10.1016/j.jnlest.2020.100020. [DOI] [Google Scholar]
- Wang Z.; Chu Z.; Dong C.; Wang Z.; Yao S.; Gao H.; Liu Z.; Liu Y.; Yang B.; Zhang H. Ultrathin BiOX (X = Cl, Br, I) Nanosheets with Exposed {001} Facets for Photocatalysis. ACS Appl. Nano Mater. 2020, 3, 1981–1991. 10.1021/acsanm.0c00022. [DOI] [Google Scholar]
- Chang X.; Huang J.; Cheng C.; Sui Q.; Sha W.; Ji G.; Deng S.; Yu G. BiOX (X=Cl, Br, I) photocatalysts prepared using NaBiO3 as the Bi source: Characterization and catalytic performance. Catal. Commun. 2010, 11, 460–464. 10.1016/j.catcom.2009.11.023. [DOI] [Google Scholar]
- Arthur R. B.; Ahern J. C.; Patterson H. H. Application of BiOX Photocatalysts in Remediation of Persistent Organic Pollutants. Catalysts 2018, 8, 604. 10.3390/catal8120604. [DOI] [Google Scholar]
- Nava-Núñez M. Y.; Jimenez-Relinque E.; Grande M.; Martínez-de la Cruz A.; Castellote M. Photocatalytic BiOX Mortars under Visible Light Irradiation: Compatibility, NOx Efficiency and Nitrate Selectivity. Catalysts 2020, 10, 226. 10.3390/catal10020226. [DOI] [Google Scholar]
- Jin X.; Ye L.; Xie H.; Chen G. Bismuth-rich bismuth oxyhalides for environmental and energy photocatalysis. Coord. Chem. Rev. 2017, 349, 84–101. 10.1016/j.ccr.2017.08.010. [DOI] [Google Scholar]
- Wang N.; Li X.; Yang Y.; Zhou Z.; Shang Y.; Zhuang X. Photocatalytic degradation of sulfonamides by Bi2O3-TiO2/PAC ternary composite: Mechanism, degradation pathway. J. Water Process. Eng. 2020, 36, 101335. 10.1016/j.jwpe.2020.101335. [DOI] [Google Scholar]
- Song Y.; Li H.; Li N.; Chen D.; Xu Q.; Li H.; He J.; Lu J. One-step synthesis of Er3+-doped BiOI0.5Cl0.5 supported on Ni foam with enhanced photocatalytic degradation under visible light. Sol. Energy 2019, 182, 420–428. 10.1016/j.solener.2019.02.046. [DOI] [Google Scholar]
- Suzuki H.; Kunioku H.; Higashi M.; Tomita O.; Kato D.; Kageyama H.; Abe R. Lead Bismuth Oxyhalides PbBiO2X (X = Cl, Br) as Visible-Light-Responsive Photocatalysts for Water Oxidation: Role of Lone-Pair Electrons in Valence Band Engineering. Chem. Mater. 2018, 30, 5862–5869. 10.1021/acs.chemmater.8b01385. [DOI] [Google Scholar]
- Rao F.; Zhu G.; Hojamberdiev M.; Zhang W.; Li S.; Gao J.; Zhang F.; Huang Y.; Huang Y. Uniform Zn2+-Doped BiOI Microspheres Assembled by Ultrathin Nanosheets with Tunable Oxygen Vacancies for Super-Stable Removal of NO. J. Phys. Chem. C 2019, 123, 16268–16280. 10.1021/acs.jpcc.9b03961. [DOI] [Google Scholar]
- Song J.; Yu J.; Sun G.; Si Y.; Ding B. Visible-light-driven, hierarchically heterostructured, and flexible silver/bismuth oxyiodide/titania nanofibrous membranes for highly efficient water disinfection. J. Colloid Interface Sci. 2019, 555, 636–646. 10.1016/j.jcis.2019.08.017. [DOI] [PubMed] [Google Scholar]
- Zhang Q.; Huang Y.; Peng S.; Zhang Y.; Shen Z.; Cao J.-j.; Ho W.; Lee S. C.; Pui D. Y. H. Perovskite LaFeO3-SrTiO3 composite for synergistically enhanced NO removal under visible light excitation. Appl. Catal., B 2017, 204, 346–357. 10.1016/j.apcatb.2016.11.052. [DOI] [Google Scholar]
- Li H.; Yang Z.; Zhang J.; Huang Y.; Ji H.; Tong Y. Indium doped BiOI nanosheets: Preparation, characterization and photocatalytic degradation activity. Appl. Surf. Sci. 2017, 423, 1188–1197. 10.1016/j.apsusc.2017.06.301. [DOI] [Google Scholar]
- Malathi A.; Arunachalam P.; Madhavan J.; Al-Mayouf A. M.; Ghanem M. A. Rod-on-flake α-FeOOH/BiOI nanocomposite: Facile synthesis, characterization and enhanced photocatalytic performance. Colloids Surf., A 2018, 537, 435–445. 10.1016/j.colsurfa.2017.10.036. [DOI] [Google Scholar]
- Shi X.; Wang P.; Li W.; Bai Y.; Xie H.; Zhou Y.; Ye L. Change in photocatalytic NO removal mechanisms of ultrathin BiOBr/BiOI via NO3– adsorption. Appl. Catal., B 2019, 243, 322–329. 10.1016/j.apcatb.2018.10.037. [DOI] [Google Scholar]
- Qin X.; Cheng H.; Wang W.; Huang B.; Zhang X.; Dai Y. Three dimensional BiOX (X=Cl, Br and I) hierarchical architectures: facile ionic liquid-assisted solvothermal synthesis and photocatalysis towards organic dye degradation. Mater. Lett. 2013, 100, 285–288. 10.1016/j.matlet.2013.03.045. [DOI] [Google Scholar]
- Shen F.; Zhou L.; Shi J.; Xing M.; Zhang J. Preparation and characterization of SiO2/BiOX (X = Cl, Br, I) films with high visible-light activity. RSC Adv. 2015, 5, 4918–4925. 10.1039/c4ra10227d. [DOI] [Google Scholar]
- Yang Y.; Li K.; Li H. Doping Effects on the Crystal Structure and Electrochemical Performance of LiFePO4/C. Int. J. Appl. Ceram. Technol. 2015, 12, 163–168. 10.1111/ijac.12139. [DOI] [Google Scholar]
- Sun M.; Senthil R. A.; Pan J.; Osman S.; Khan A. A Facile Synthesis of Visible-Light Driven Rod-on-Rod like α-FeOOH/α-AgVO3 Nanocomposite as Greatly Enhanced Photocatalyst for Degradation of Rhodamine B. Catalysts 2018, 8, 392. 10.3390/catal8090392. [DOI] [Google Scholar]
- Zhang Z.; Wang N.; Zhu L.; Lv H.; Dong X.; Chai H.; Tang H. Synergistic effect between Fe and Bi2O3 on enhanced mechanochemical treatment of decabromodiphenyl ether. J. Environ. Chem. Eng. 2017, 5, 915–923. 10.1016/j.jece.2017.01.008. [DOI] [Google Scholar]
- Zheng Y.; Li C.; Meng X.; Zhang Z. A conjugated composite of α-Fe2O3 and BiOBr with enhanced visible-light-induced photocatalytic activity. J. Mol. Catal. A: Chem. 2016, 421, 16–28. 10.1016/j.molcata.2016.05.004. [DOI] [Google Scholar]
- Tang W.; Zhang Y.; Guo H.; Liu Y. Heterogeneous activation of peroxymonosulfate for bisphenol AF degradation with BiOI0.5Cl0.5. RSC Adv. 2019, 9, 14060–14071. 10.1039/c9ra01687b. [DOI] [PMC free article] [PubMed] [Google Scholar]
- Jamali-Sheini F.; Cheraghizade M.; Yousefi R. Electrochemically synthesis and optoelectronic properties of Pb- and Zn-doped nanostructured SnSe films. Appl. Surf. Sci. 2018, 443, 345–353. 10.1016/j.apsusc.2018.03.011. [DOI] [Google Scholar]
- Lu C.; Wang J.; Xu F.; Wang A.; Meng D. Zn-doped SnO2 hierarchical structures formed by a hydrothermal route with remarkably enhanced photocatalytic performance. Ceram. Int. 2018, 44, 15145–15152. 10.1016/j.ceramint.2018.05.151. [DOI] [Google Scholar]
- Zhu X.-D.; Wang Y.-J.; Sun R.-J.; Zhou D.-M. Photocatalytic degradation of tetracycline in aqueous solution by nanosized TiO2. Chemosphere 2013, 92, 925–932. 10.1016/j.chemosphere.2013.02.066. [DOI] [PubMed] [Google Scholar]
- He Y.; Dong W.; Li X.; Wang D.; Yang Q.; Deng P.; Huang J. Modified MIL-100(Fe) for enhanced photocatalytic degradation of tetracycline under visible-light irradiation. J. Colloid Interface Sci. 2020, 574, 364–376. 10.1016/j.jcis.2020.04.075. [DOI] [PubMed] [Google Scholar]
- Niu J.; Zhang Z.; Dai P.; Yao B.; Yu X.; Zhang Q.; Yang R. Facile synthesis of γ-Fe2O3/BiOI microflowers with enhanced visible light photocatalytic activity. Mater. Des. 2018, 150, 29–39. 10.1016/j.matdes.2018.04.001. [DOI] [Google Scholar]
- Zhong X.; Zhang K.-X.; Wu D.; Ye X.-Y.; Huang W.; Zhou B.-X. Enhanced photocatalytic degradation of levofloxacin by Fe-doped BiOCl nanosheets under LED light irradiation. Chem. Eng. J. 2020, 383, 123148. 10.1016/j.cej.2019.123148. [DOI] [Google Scholar]
- Wang M.; Gao J.; Zhu G.; Li N.; Zhu R.; Wei X.; Liu P.; Guo Q. One-step solvothermal synthesis of Fe-doped BiOI film with enhanced photocatalytic performance. RSC Adv. 2016, 6, 106615–106624. 10.1039/c6ra21350b. [DOI] [Google Scholar]
- Li X.; Zeng Z.; Zeng G.; Wang D.; Xiao R.; Wang Y.; Zhou C.; Yi H.; Ye S.; Yang Y.; Xiong W. A “bottle-around-ship” like method synthesized yolk-shell Ag3PO4@MIL-53(Fe) Z-scheme photocatalysts for enhanced tetracycline removal. J. Colloid Interface Sci. 2020, 561, 501–511. 10.1016/j.jcis.2019.11.025. [DOI] [PubMed] [Google Scholar]