Abstract
Carbendazim, a very common contamination to the traditional Chinese medicines (TCMs), has posed serious threat to the environment and human health. However, sensitive and selective detection of carbendazim (MBC) in the TCMs is a big challenge for their complex chemical constituents. In this work, a 0D/1D nanohybrid was developed by anchoring 1T-phased MoS2 quantum dots (QDs) over multiwall carbon nanotubes (MWCNTs) via a facile assembly method. High-resolution transmission electron microscopy (HRTEM), Raman spectroscopy, X-ray photoelectron spectroscopy, and thermogravimetric analysis (TGA) together with EIS reveal that the 1T-phased QDs can anchor over MWCNTs via van der Waals forces, and the anchoring improves the nanohybrid surface area and conductivity. Therefore, the electrochemical sensor fabricated based on the MoS2 QDs@MWCNT nanohybrid shows excellent catalytic activity to MBC oxidation. Under optimized conditions, the sensor presents a linear voltammetry response to MBC concentration from 0.04 to 1.00 μmol·L–1, a low detection limit of 2.6 × 10⁻⁸ mol·L–1, as well as high selectivity, good reproducibility, and long-term stability. Moreover, the sensor has been successfully employed to determine MBC in two typical TCMs and the obtained recoveries are in good accordance with the results achieved by HPLC, showing that the constructed sensor plate holds great practical application in MBC analysis with complex matrix.
Introduction
Traditional Chinese medicines (TCMs), a treasure of human beings, have been employed to prevent and treat diseases in China for centuries. They gain ever-growing attention around the world in recent years due to their fascinating theory and long historical clinical practice. With the increasing worldwide acceptance, TCMs not only play an increasing role in global health but also contribute to other sectors including food supplements1 and food flavoring agents,2 which cause an expansion of the global TCM market. To sustain the high yield of TCM production, various pesticides such as insecticide, herbicide, and fungicide have been extensively applied during the planting process, which results in great concerns for the safety of TCMs.3−5
Carbendazim (MBC), one of the broad-spectrum benzimidazole fungicides, is especially used to control multiple kinds of fungi diseases in a variety of TCMs owing to its high efficiency and low cost.6 According to a previous report, more than 85% of TCMs were contaminated by carbendazim.7 Even worse, MBC is responsible for many diseases including germ cell apoptosis, infertility, and embryo deformity.8,9 In addition, MBC was identified by the European Commission and the US Environmental Protection Agency as a chemical substance affecting hormone secretion and potential human carcinogens,10,11 and thus it has been completely banned in agricultural cultivations in these areas. But the abuse of MBC still existed in some countries. Therefore, it is important to screen the trace amount of MBC in traditional Chinese medicines with a high accuracy. However, highly sensitive and selective detection of carbendazim in TCMs is challenging for the complex matrices of TCMs.12
During the last decades, various analytical approaches including high-performance liquid chromatography (HPLC),13 liquid chromatography–mass spectrometry (LC-MS),14−16 UV–vis spectrophotometry,17 and surface-enhanced Raman scattering (SERS)18,19 have been explored for monitoring the trace amount of MBC. The above-mentioned techniques can provide relatively high sensitivity, but require time-consuming sample separation process, highly trained operators, and expensive instruments, which limit these methods for in-site rapid detection. Recently, electrochemical sensors have attracted widespread attention in the detection of agriculture residues with advantages such as high portability, easy operation, and high efficiency.20−25 For the electrochemical sensor, the functional nanomaterial used to modify the surface of the working electrode is the key factor to achieve a high detection performance.26−30 Among various nanomaterials, molybdenum disulfide (MoS2) has been evidenced to be effective in the development of advanced electrochemical sensors owing to its unique structure and prominent electrocatalytic activity.31,32 Compared to the nanosheet counterpart, MoS2 quantum dots (QDs) possess a higher surface area with more unsaturated terminal atoms, which are helpful in electrochemical reactions.33 Therefore, MoS2 QDs show a more interesting prospective as sensor materials. For example, MoS2 QD-based sensors show a wide detection range (0.01–5.57 mM) and a low detection limit (1.90 μM) in the detection of H2O2.34 However, MoS2 QDs are randomly accumulated, resulting in a decrease of electronic catalytic activity.35 Hybridization with other conductive components such as carbon nanotubes36 and graphene37 is an effective method to improve their electrochemical catalytic performance.
Based on the aforementioned considerations, a 0D/1D nanohybrid MoS2 QDs@MWCNT was fabricated by integrating metallic 1T-phased MoS2 QDs with carboxylated multiwall carbon nanotubes via a facile ultrasonic-assisted assembly method. The 0D/1D nanohybrid was first used to modify glassy carbon electrode (GCE) to construct an MBC sensor. The as-prepared sensor showed high performance for the detection of MBC. Furthermore, the sensor was successfully employed to quantitatively determine the MBC in two typical TCMs, and satisfactory recoveries comparable to the results of the HPLC method were achieved.
Results and Discussion
Physical Characterization
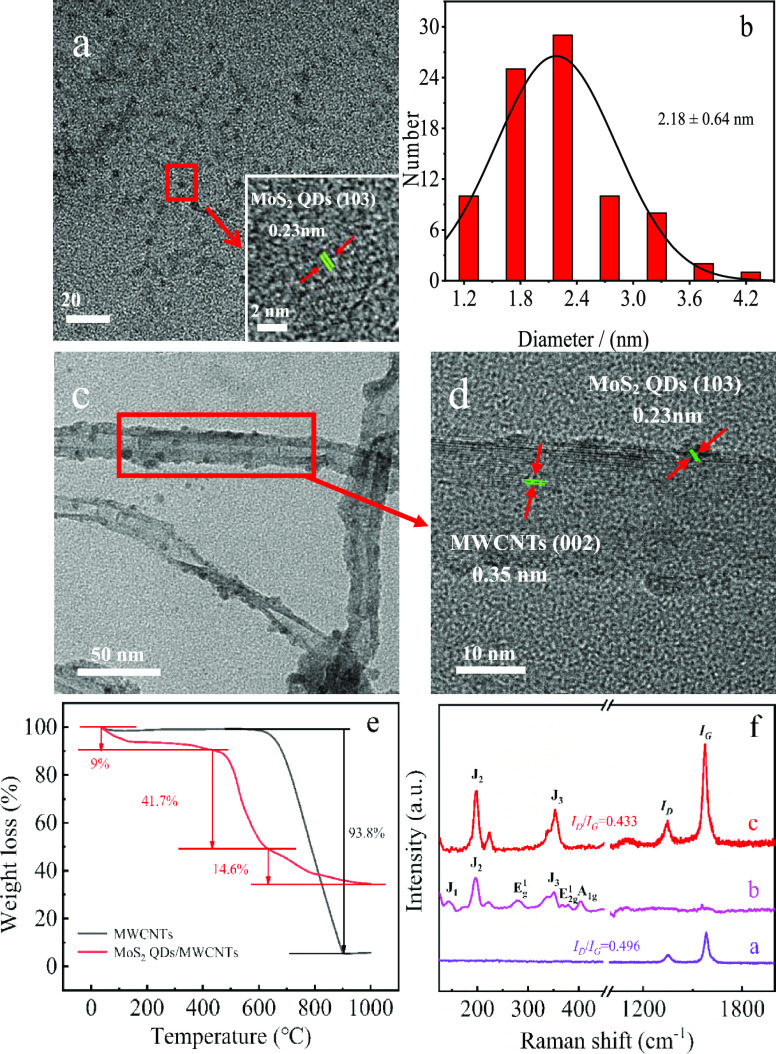
HRTEM was employed to characterize the size and microstructure of obtained samples. Obviously, MoS2 QDs have uniform size with an average diameter of about 2.18 ± 0.64 nm (Figure 1a,b). A highly paralleled and ordered lattice fringe with a d-spacing of 0.25 nm can be indexed to the (103) faces of MoS2 crystals (Figure 1a, inset).38 No common (002) lattice plane of crystalline MoS2 was observed as MoS2 QDs contain very few layers.39Figure 1c presents the typical TEM images of MoS2 QDs@MWCNTs, which is observed that the MoS2 QDs are successfully anchored on the outer surface of MWCNTs with uniform size. The successful anchoring is due to the strong van der Waals forces occurred between MoS2 QDs and the MWCNT surface.40Figure 1d shows that MoS2 QDs keep the initial crystal structure after the nanohybrid preparation process. Figure 1e shows the TG analysis of MoS2 QDs and MoS2 QDs@MWCNTs. The MWCNTs exhibit one mass loss stage at the initial temperature of about 617 °C, corresponding to the calcination of MWCNTs. As for the MoS2 QDs@MWCNTs, the early weight loss is attributed to water evaporation followed by the calcination of MWCNTs at the onset temperature of about 500 °C. The onset temperature of MWCNT calcination in the MoS2 QDs@MWCNTs sample is about 100 °C lower than that of the MWCNT sample, showing that the MWCNTs get more individualized after anchoring of MoS2,41 in good accordance with the TEM results (Figure 1c). Evidently, the well-dispersed MWCNTs and the MoS2 QDs lead to enhanced surface area of MoS2 QDs@MWCNTs, which will be further proved by the chronocoulometry technique in the Electrochemical Characterization section. Moreover, the total weight loss ratio of MoS2 QDs@MWCNTs is about 65.23%, lower than that of MWCNTs sample, further evidencing that MoS2 QDs were successfully anchored on the MWCNT surface via the simple ultrasonication assembly method. In Figure 1f (curve a), the MWCNTs have two characteristic bands, namely, D band at 1347 cm–1 and G band at 1576 cm–1.42 The G band is related to the E2g modes that represents the movement in opposite directions of two neighboring carbon atoms in a graphite sheet. The D band corresponds to the disorder present in the MWCNTs.43 The ID/IG band intensity ratio in MWCNTs is 0.496, which then decreases to 0.433 after anchoring of MoS2 QDs, showing that the defect sites are reduced, which is possibly because the defect sites of MWCNTs were masked by the MoS2 QDs. As for the MoS2 QDs (curve b), six peaks centered at 144, 198, 280, 353, 379, and 402 cm–1 are detected. The peaks at 144, 198, and 336 cm–1 can be allocated to the J1, J2, and J3 modes of S–Mo–S bonds in 1T-phase MoS2, respectively, while the other three peaks at 280, 379, and 402 cm–1 are ascribed to the Eg1, E2g, and A1g modes from 2H-phase MoS2, respectively.44,45 The existence of 1T-phase structure endows MoS2 QDs with metallic properties that can facilitate the charge transfer kinetics for its high-conductivity nature, thus leading to a dramatic enhancement in the catalytic activity.46 In addition, the thickness of MoS2 QDs can also be estimated by the difference value between E2g1 and A1g modes.47 The difference value is 24 cm–1 in this case, showing that MoS2 QDs are four-layer thick. Commonly, very few layered structures of MoS2 QDs lead to the abundance of exposed catalytic edge sites, which has been proved previously via molecular modeling and simulation.48
Figure 1.
(a) HR-TEM image and the highly crystallized lattice (inset) of MoS2 QDs. (b) Histogram of particle size distribution of MoS2 QDs. HR-TEM image (c) and highly crystallized lattice (d) of MoS2 QDs@MWCNTs. (e) TG profiles of MWCNTs and MoS2 QDs/MWCNTs. (f) Raman spectra of MWCNTs (curve a), MoS2 QDs (curve b), and MoS2 QDs@MWCNTs (curve c).
X-ray photoelectron spectroscopy (XPS) was used to investigate the composition of nanohybrid and quantify the percentage of 1T phase. According to the survey spectra (Figure 2a), the Mo element and the S element are acquired in the MoS2 QDs@MWCNTs hybrid, indicating that MoS2 QDs were successfully anchored on the MWCNTs. In addition, the appearance of the C element in the nanomaterial of MoS2 QDs is attributed to the absorption of CO2 from air. The high-resolution Mo 3d spectra of the MoS2 QD and MoS2 QDs@MWCNT hybrid are shown in Figure 2b. The peaks located at 230.2 and 233.1 eV are corresponding to Mo 3d5/2 and Mo 3d3/2, indicating the Mo4+ from 2H-phase MoS2, while the peaks centered at 229.3 and 232.64 eV reveal the existence of 1T-phase MoS2. The multipeak curve fitting results reveal that the percentage of 1T phase is 54%, suggesting the metallic property and high conductivity of the obtained MoS2 QDs.49 The peak at 235.98 eV is ascribed to Mo6+, generated from the slight oxidation of Mo edges during the exfoliation process.50Figure 2c presents the high-resolution spectra of S 2p of the two samples. For the MoS2 QDs, the peaks at 161.76 eV (S 2p3/2) and 163.38 eV (S 2p1/2) represent the 1T-phase MoS2, and the peaks at 162.64 eV (S 2p3/2) and 164.2 eV (S 2p1/2) represent the 2H-phase MoS2. The curve fitting results reveal that the percentage of 1T phase is 54%, in good agreement with that of Mo 3d XPS. No S 2p signal peak was found in hybrid samples, suggesting that the S 2p peak was masked by the presence of MWCNTs, which is in accordance with a previous report.40Figure 2d shows the high-resolution spectra of O 1s of the two samples. The peaks at 533.4 and 532.2 eV are assigned to the C–O and C=O, whereas the peak at 530.7 eV is corresponding to the Mo–O bond, which are also consistent with ref (40). In a word, physical characterizations reveal that the prepared 1T-phased MoS2 QDs can anchor onto the MWCNTs via van der Waals forces and the anchoring of MoS2 QDs makes the MWCNTs more dispersed. At the same time, the MWCNTs prevent the aggregation of metallic MoS2 QDs.
Figure 2.
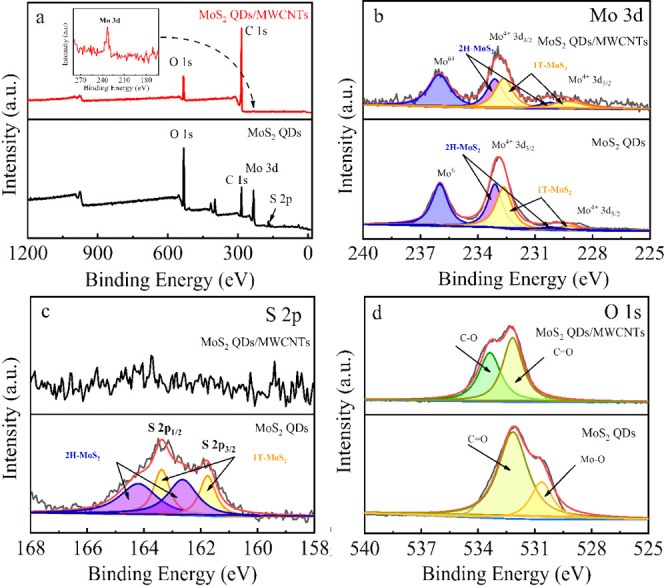
XPS survey spectra of MoS2 QDs and MoS2 QDs@MWCNTs (a); high-resolution XPS spectra of O 1s (b), Mo 3d (c), and S 2p (d) in MoS2 QDs and MoS2 QDs@MWCNTs.
Electrochemical Characterization
The electron-transfer ability of bare and modified electrodes was characterized by electrochemical impedance spectroscopy (EIS) (Figure 3a). The values of charge transfer resistance (Rct) were obtained by the typical Randle equivalent circuit considering only one time constant was detected (Figure 3b). The Rct value of the bare GCE is 177 Ω, which decreases to 129 and 51 Ω after being modified with MoS2 QDs and MWCNTs films, respectively, revealing that both MoS2 QDs and MWCNTs have better electrochemical conductivity. The high conductivity of MoS2 QDs is attributed to that the 1T-phased structure of MoS2 QDs has metallic property, as discussed in the Physical Characterization section. The Rct value decreases sharply to 14 Ω when the bare GCE was modified with the hybrid material of MoS2 QDs@MWCNTs, revealing the synergy between MoS2 QDs and MWCNTs. The effective surface area of each electrode was investigated with chronocoulometry (Figure 3c), and the results were calculated according to the plot of Q–t1/2 by the following equation
| 1 |
where A is the electrode effective area, n presents the transferred electron number, F is the faraday constant, c expresses the concentration of the [Fe(CN)6]3–/4–, D is the diffusion coefficient of the [Fe(CN)6]3–/4– solution (7.6 × 10⁻⁶ cm2/s), and Qdl and Qads present the double-layer charge and faradic charge, respectively. According to the linear regression equation of Q–t1/2 (Figure 3d), the effective areas of MoS2 QDs@MWCNTs/GCE, MoS2 QDs/GCE, MWCNTs/GCE, and bare GCE are calculated to be 0.13837, 0.07766, 0.06394, and 0.04028 cm2, respectively. The enhancement of the effective surface area of MoS2 QDs@MWCNTs/GCE can be attributed to that MWCNTs and MoS2 QDs can improve the mutual dispersion properties, as evidenced by the TEM results.
Figure 3.
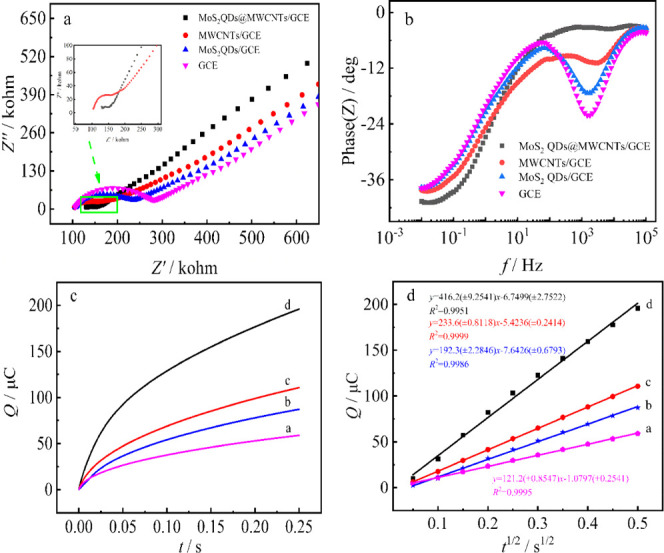
Nyquist diagrams (a) and Bode plots (b) of various electrodes in 5.0 mmol·L–1 K3[Fe(CN)6]/K4[Fe(CN)6] (1:1) containing 0.1 mol·L–1 KCl; Q–t (c) and Q–t1/2 (d) plots of bare GCE (curve a), MWCNTs/GCE (curve b), MoS2 QDs/GCE (curve c), and MoS2 QDs@MWCNTs/GCE (curve d).
Electrochemical Behavior of MBC
The electrochemical behavior of MBC at various electrodes was evaluated via CV and SWV in phosphate buffer solution (pH = 7.0; 0.1 M), as shown in Figure 4. Basically, only one well-resolved electrochemical oxidation peak is observed for various modified electrodes, showing that the oxidation process is a quasi-reversible process (Figure 4a).51 However, the electrochemical activity toward MBC oxidation varied with the modified materials (Figure 4b). The metallic MoS2 QD-modified GCE shows poor electrochemical activity compared to bare GCE, which is attributed to the heavy aggregation of QDs.35 However, the MoS2 QDs@MWCNTs/GCE shows notable electrocatalytic oxidation activity to MBC. Characterization results indicate that the enhanced oxidation activity to MBC is due, on the one hand, to the enhanced dispersion degree of both MoS2 QDs and MWCNTs generating more active surface sites and, on the other hand, to the enhanced charge transfer kinetics derived from the high-conductivity nature of metallic MoS2 QDs and MWCNTs. Also note that the background currents vary for different electrodes. Among them, the background current of MoS2 QDs@MWCNTs/GCE is the largest and that of the bare electrode is the least. In general, the background current is in correlation with the value of capacity, while the value of capacity is directly proportional to surface area because the dielectric constant ε is almost constant in the same aqueous system.52 Therefore, the largest background current for MoS2 QDs@MWCNTs/GCE among the modified electrodes is possibly attributed to the largest surface area, consistent with the surface area results.
Figure 4.
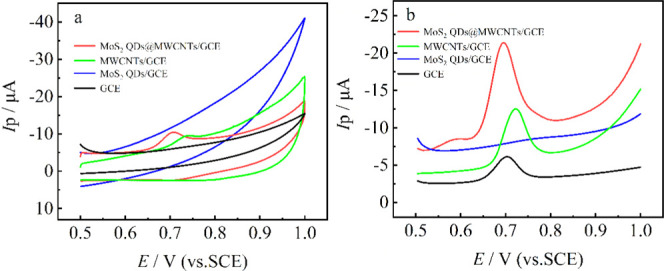
Electrochemical behaviors of 1.0 μmol·L–1 MBC at GCE, MoS2 QDs/GCE, MWCNTs/GCE, and MoS2 QDs@MWCNTs/GCE in 0.1 mol·L–1 phosphate buffer solution (pH = 7.0) characterized by CV (a) and SWV (b), respectively.
Effect of the Mass Ratio between MoS2 QDs and MWCNTs and the Amount of Hybrid Material
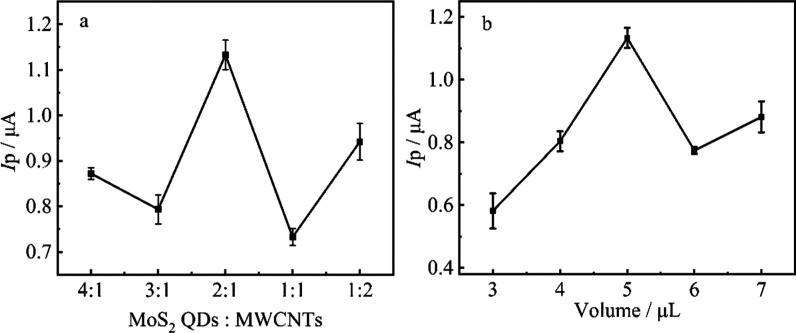
According to previous reports,53−55 the response of oxidation current peak can be significantly influenced by the modification amount of MoS2 QDs and MWCNTs. To explore the most suitable concentration ratio between MoS2 and MWCNTs, the ratio between MoS2 QDs and MWCNTs (optimized concentration for MWCNTs is 1 mg·mL–1) was explored. As shown in Figure 5a, the peak current response attains the maximum when the concentration of MoS2 QDs is 2 mg·mL–1. This means that the low concentration of MoS2 QDs was not enough to combine with MWCNTs, which cannot create enough reaction activity sites. However, the excessive MoS2 QDs may result in an overload phenomenon, leading to decreased electrode surface. Therefore, a 2:1 mass ratio between MoS2 QDs and MWCNTs was used in the following experiments.
Figure 5.
Cyclic voltammetry response of 1 μmol·L–1 MBC to (a) different ratios of MoS2 QDs and MWCNTs (MoS2 QDs:MWCNTs: 4:1, 3:1, 2:1, 1:1, 1:2) and (b) different volumes (3, 4, 5, 6, 7 μL) of nanohybrid-modified electrode under phosphate buffer solution (pH = 7.0; 0.1 M).
The influence of the amount of hybrid material on the electrode response to 1.0 μmol·L–1 MBC is shown in Figure 5b. The peak current gradually increases with the loading amount (3–5 μL), and the maximum peak current response appears at 5 μL of hybrid material, whereas the peak current decreases sharply when the loading volume of nanocomposite increases from 5 to 7 μL. This result may be attributed to the fact that the electrode surface did not get full coverage with less loading amount of nanohybrid, but too much loading volume extends the electron-transfer distance, resulting in a decrease of peak current response.56 Therefore, 5 μL of hybrid material was selected as the optimal loading volume in the subsequent experiment.
Effect of pH
CV was used to investigate the influence of pH on the electrochemical oxidation of carbendazim (1 μM) at the MoS2 QDs@MWCNTs-COOH/GCE. As shown in Figure 6a, the peak current increases gradually as the pH increases from 5.0 to 7.0 and then decreases rapidly from 7.0 to 9.0. Therefore, pH 7.0 was selected for the subsequent experiments. The variation tendency may be caused by the instability of MBC in acidic and alkaline media. As reported by Chen et al.,57 the MBC can be converted into a soluble salt in the acidic medium and undergoes decomposition in the alkaline medium, which are in contrast to the electrochemical reaction. In addition, the oxidation peak potential shifts to negative values with the increase of pH, suggesting that protons are involved in the carbendazim oxidation process. The linear correlation between oxidation potential (Epa) and pH follows the regression equation of Epa (V) = −0.0549 pH + 1.147 (R2 = 0.9930), as shown in Figure 6b. Obviously, the slope value (−0.0549) is close to the theoretical value (0.0592), showing that equal number of electrons and protons are involved in the MBC oxidation reaction.
Figure 6.
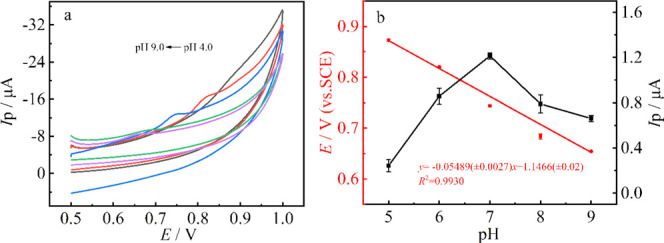
(a) Cyclic voltammetry response of 1 μmol·L–1 MBC in the pH range of 5.0–9.0 at the MoS2 QDs@MWCNTs/GCE. (b) Influence of pH on the peak.
Effect of Scan Rate
The effect of scan rate (50–450 mV·s–1) on the detection of MBC (1.0 μmol·L–1) at the MoS2 QDs@MWCNTs/GCE was investigated by CV in phosphate buffer solution (pH 7.0; 0.1 M). The peak currents increase with scan rates and can be expressed as the following linear regression equation: Ipa (μA) = −0.4938 v1/2 (mV/s)1/2 + 2.5479 (R2 = 0.9968), revealing a typical diffusion-controlled electrochemical reversible reaction process. The relationship between the peak potentials and the natural logarithm of the scan rates is shown in Figure 7d, following the equation Epa (V) = 0.0125 ln v (mV/s) + 0.7557 (R2 = 0.9856). The relationship between Ep and ln v can be expressed as the Laviron equation58
| 2 |
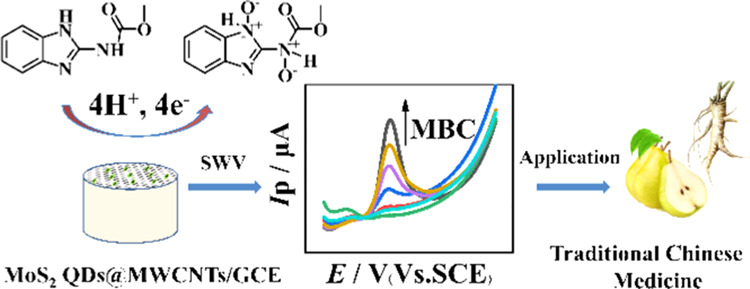
where T represents the temperature (298 K), F is the Faraday constant (96 480 C·mol–1), R is the universal gas constant (8.314 J·mol–1·K), and α and n are, respectively, the electron-transfer coefficient and electron-transfer number; n = 4 when α = 0.51. Therefore, there are four electrons and four protons involved in the electrochemical reaction of MBC. In our previous work,59 the density functional theory (DFT) calculation has revealed that the most probable sites for the oxidation of carbendazim are the nitrogen atom in the amide and the nitrogen atom in the pyridine ring because the two sites have almost equal distribution of Mulliken charges and equal heat formation for dehydrogenation. Besides, the nitrogen atom in the amide can oxidize to N+O– proceeding with two electrons and two protons.60−63 Therefore, the possible oxidation mechanism for the MBC is described as Figure 8.
Figure 7.
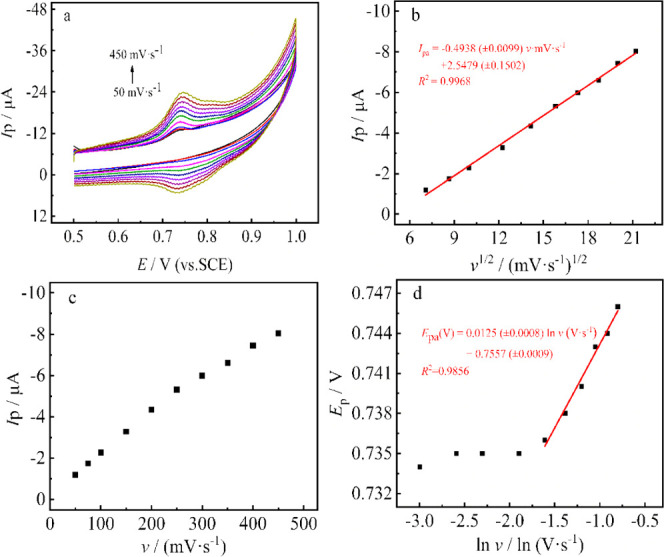
(a) Cyclic voltammograms of MoS2 QDs@MWCNTs/GCE in 0.1 M phosphate buffer solution (pH 7.0; 0.1 M) containing 1.0 μmol·L–1 MBC at scan rates of 50, 75, 100, 150, 200, 250, 300, 350, 400, and 450 mV·s–1. (b) Relationship between the peak current and the square root of the scan rate. (c) Relationship between the peak current and scan rate. (d) Relationship between redox peak potential (Ep) and the natural logarithm of scan rate (ln v).
Figure 8.
Scheme of the suggested electro-oxidation mechanism of MBC at the MoS2 QDs@MWCNTs/GCE.
Calibration Curve (SWV)
Square-wave voltammetry (SWV) was used for the determination of MBC at the MoS2 QDs@MWCNTs/GCE under optimum conditions. As shown in Figure 9a, the peak current increases linearly with the increase of MBC concentration in the range of 0.04–1.00 μmol·L–1. The linear regression equation is expressed as Ipa = −12.0171 (±0.3775) c + 0.284 (±0.0328) (R2 = 0.9951). The limit of detection (LOD) is calculated to be 0.026 μM according to the equation 3Sd/K, where K is the slope of the linear regression equation and Sd is the standard deviation of K (n = 3). Compared to other previously reported works as shown in Table 1,61,64−67 the sensor developed in this work has a good sensing performance either. Evidently, as discussed in the characterization part, the good sensing performances are attributed to the fact that the anchoring of MoS2 QDs increases the van der Waals interaction between the side wall of MWCNTs, and meanwhile, the MWCNTs provide support to the MoS2 QDs, which prevent the aggregation of MoS2 QDs, leading to the high exposed surface area of nanohybrid MoS2 QDs@MWCNTs. In addition, the conductivity of MoS2 QDs@MWCNTs gets enhanced via the hybrid process, as shown by EIS results, which contributes to the charge transfer kinetics and ultimately results in a high catalytic performance.40
Figure 9.
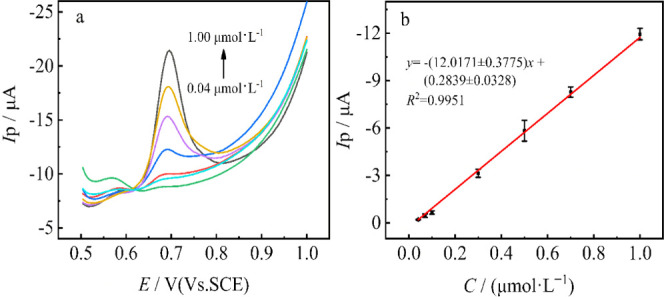
(a) SWV response of various concentrations of MBC (0.04, 0.07, 0.1 0.3, 0.5, 0.7, 1.0 μmol·L–1) at MoS2 QDs@MWCNTs/GCE in 0.1 M phosphate buffer solution (pH 7.0; 0.1 M). (b) Linear relationship between peak current and MBC concentration.
Table 1. Comparison of Different Modified Electrodes for the Determination of Carbendazim.
| modified electrode | linear range (mol·L–1) | LOD (mol·L–1) | references |
|---|---|---|---|
| GO-MWNT/GC | 1.0 × 10⁻⁸–4.0 × 10⁻⁶ | 5.0 × 10⁻⁹ | (61) |
| ZMCPEs | 1.0 × 10⁻⁷–2.35 × 10⁻⁶ | 3.5 × 10⁻⁹ | (64) |
| SiO2/MWCNT/GCE | 2.0 × 10⁻⁷–4.0 × 10⁻⁶ | 5.6 × 10⁻⁸ | (65) |
| NP-Cu/RGO/GCE | 5.0 × 10⁻⁷–3.0 × 10⁻⁵ | 9.0 × 10⁻⁸ | (66) |
| Ce-doped ZnWO4/CPE | 1.0 × 10⁻⁸–5.5 × 10⁻⁶ | 3.3 × 10⁻⁹ | (67) |
| MoS2QDs@MWCNTs/GCE | 4.0 × 10⁻⁸–1.0 × 10⁻⁶ | 2.6 × 10⁻⁸ | present work |
Practical Application
To investigate the performance of the electrochemical method in practical application, the proposed sensor and HPLC were used to detect MBC in real samples, respectively. Actual samples include two typical traditional Chinese medicines, namely, platycodon grandiflorum and pears. As shown in Table 2, 95.03–105.57% recoveries were obtained in two traditional Chinese medicine samples, in good agreement with the results obtained via HPLC, proving that the proposed sensor shows high potential for practical application in MBC screening.
Table 2. Recovery Results for the Determination of MBC in Real Samples via the Proposed Electrochemical Sensor and the Conventional HPLC (n = 3).
| SWV |
HPLC |
||||||
|---|---|---|---|---|---|---|---|
| samples | added (μmol·L–1) | found (μmol·L–1) | recovery (%) | RSD (%) | found (μmol·L–1) | recovery (%) | RSD (%) |
| platycodon grandiflorum | 0.3 | 0.30 ± 0.005 | 99.91 | 2.40 | 0.29 ± 0.003 | 95.57 | 1.18 |
| 0.7 | 0.68 ± 0.011 | 97.31 | 2.24 | 0.67 ± 0.014 | 95.04 | 2.15 | |
| 1.0 | 1.05 ± 0.010 | 105.57 | 1.33 | 0.87 ± 0.003 | 87.15 | 0.39 | |
| pears | 0.3 | 0.30 ± 0.005 | 100.53 | 2.34 | 0.29 ± 0.001 | 97.38 | 0.48 |
| 0.7 | 0.71 ± 0.009 | 102.13 | 1.62 | 0.68 ± 0.004 | 96.81 | 0.53 | |
| 1.0 | 0.99 ± 0.008 | 98.79 | 1.18 | 0.92 ± 0.034 | 91.86 | 3.68 | |
Reproducibility, Selectivity, and Long-Term Stability
The reproducibility of the proposed electrochemical sensor was evaluated by SWV using seven different modified electrodes at an MBC concentration of 0.2 μmol·L–1. The relative standard deviation (RSD) for three experiments was calculated to be 3.9%, revealing that the proposed electrode has high reproducibility in the detection of MBC. Interference experiments were performed via SWV under the optimized conditions to evaluate the selectivity of the prepared MoS2 QDs@MWCNTs/GCE for MBC detection. MgCl2, CaCl2, KCl, Pb(NO3)2, ascorbic acid (Vc), and carotene (100-fold) were added into MBC solutions, respectively. As shown in Figure 10, almost all of the responses of peak current change less than 5%, indicating that the MoS2 QDs@MWCNTs/GCE possesses a high selectivity in the detection of MBC. The long-term stability of the prepared sensor was evaluated by measuring the SWV response in 0.2 μmol·L–1 MBC under optimized conditions. Above 95% of the original response was retained after being stored in a refrigerator at 4 °C for 30 days, showing that the proposed sensor has excellent long-term stability.
Figure 10.

SWV response of 0.2 μmol·L–1 MBC in the absence and presence of 100-fold ascorbic acid, MgCl2, CaCl2, KCl, Pb(NO3)2, and carotene (n = 3) at the MoS2 QDs@MWCNTs/GCE under phosphate buffer solution (pH 7.0; 0.1 M).
Conclusions
In summary, a novel nanohybrid material of MoS2 QDs@MWCNTs was successfully fabricated via a facile sonication-assisted assembly method, and it was explored for the first time to quantitatively detect MBC in traditional Chinese medicines. The proposed sensor displayed a relatively wide linear range of 0.04–1.0 μmol·L–1 with a low detection of 0.026 μmol·L–1 owing to the synergistic effect occurred between MWCNTs and MoS2 QDs. The proposed sensor has high sensitivity and selective response on MBC against various potential interferences. Moreover, the sensor enables efficient detection of MBC in typical traditional Chinese medicines with satisfactory recoveries and low RSD, which are in good agreement with the results of HPLC.
Materials and Methods
Chemical and Reagents
Carbendazim (97%), Pb(NO3)2 (AR), carotene (AR), ascorbic acid (Vc, AR), KCl (AR), K3[Fe(CN)6] (AR), and K4[Fe(CN)6] (AR) were purchased from Aladdin Reagent Co., Ltd (Shanghai, China). MoS2 QDs and MWCNTs-COOH (outer diameter, 20–30 nm; purity, 95 wt %) were obtained from Nanjing XFNANO Materials Tech Co., Ltd (Nanjing, China) and Chengdu Organic Chemicals Co., Ltd. (Chengdu, China), respectively. CaCl2 (AR) and MgCl2 (AR) were purchased from Shanghai Titan Scientific Co., Ltd. Absolute ethanol (≥99.7%) was acquired from Damao Scientific Co. Ltd (Tianjin, China). Phosphate buffer solutions (0.1 M) with different pH values were prepared by mixing Na2HPO4 (0.1 M) and NaH2PO4 (0.1 M) stock solutions at various ratios. Unless specified otherwise, other chemicals and reagents used in this study were of analytical grade. Ultrapure water (18.2 MΩ·cm) was used in all experiments.
Apparatus
All electrochemical experiments were performed on a CHI660E electrochemical workstation (Chenhua Instrument Co. Ltd., Shanghai, China) through a classical three-electrode system, in which bare and modified glassy carbon electrode (GCE, Φ = 3 mm) was used as the working electrode, and the saturated calomel electrode (SCE) and platinum wire electrode were used as the reference electrode and counter electrode, respectively. High-resolution transmission electron microscopy (HR-TEM, FEI-G20) was used to investigate the surface morphologies of materials. X-ray photoelectron spectroscopy (XPS) was performed using an ESCLAB-250Xi X-ray photoelectron spectrometer (Thermo Fisher Company). Thermogravimetric analysis (TGA) was performed on a thermal analyzer (NETZSCH STA 449 C, Germany) at a heating rate of 10 °C·min–1 under an air atmosphere with a flow rate of 100 mL·min–1 over a temperature range of room temperature to 1000 °C. Raman spectra were recorded on a micro-Raman spectrometer (Horiba Jobin Yvon LabRAM HR800) with a 532 nm laser as the excitation source at room temperature. Chromatographic analysis was carried out on a high-performance liquid chromatography (HPLC) device (Waters e2695). Chromatographic separations were obtained using C18 column (150 mm × 4.6 mm I.D., 2.7 μm, VanGuard). The mobile phase was the mixture of methanol and water solution (2:3, V/V) with a flow rate of 1.0 mL·min–1. The injection volume was 10 μL, and the column temperature was 25 °C.
Preparation of Modified Electrodes
MWCNTs-COOH (2.00 mg) and MoS2 QDs (4.00 mg) were dispersed in 2.0 mL of deionized water with ultrasonic treatment at 300 W for 1 h until uniformly mixed nanocomposites were obtained. Before modification, the bare GCE was polished with alumina slurry (0.05 μm) on chamois leather and then cleaned thoroughly with pure water under sonication, followed by drying process in air. The as-prepared nanocomposite suspension (5.0 μL) was dropped onto the surface of polished GCE and dried under an infrared lamp. The modified electrode was marked as MoS2 QDs@MWCNTs/GCE. For comparison, other modified GCEs with MoS2 QDs or MWCNTs were obtained via a similar process and named as MoS2 QDs/GCE and MWCNTs/GCE, respectively.
Electrochemical Measurements
Electrochemical impedance spectroscopy (EIS) was used to characterize the conductivity property of electrodes, which was applied in a 5.0 mmol·L–1 [Fe(CN)6]3–/4– probe solution containing 0.1 mol·L–1 KCl and recorded in the frequency range of 10–1–105 Hz at an open-circuit potential with an amplitude of 5 mV. Chronocoulometry was used to evaluate the effective areas of various electrodes in the potential range of −0.2 to 0.6 V with a pulse width of 0.25 mV. Cyclic voltammetry (CV) and square-wave voltammetry (SWV) were performed in the potential range of 0.5–1.0 V.
Real-Sample Pretreatment and Recovery Experimental
Two typical TCMs samples, namely, platycodon grandiflorum and pear, were involved in the real-sample analysis. The juice of platycodon grandiflorum was prepared via the ethanol extraction method. In detail, 0.5 g of platycodon grandiflorum was immersed in 6 mL of absolute method for 24 h. After that, the extraction was centrifuged at 1000 rpm for 10 min to remove the solid impurities. The juice of pear was obtained via crushing 35 g of pear and then filtered with a Millipore film (0.45 μm). The obtained juice or extraction was adjusted to pH 7.0 with phosphate buffer solution (pH 7.0; 0.1 M). The amount of MBC was determined by SWV according to the standard addition method.
Acknowledgments
The work was supported by a grant from Special project of Jiangxi Modern Agricultural Industrial Technology System (JXARS-03), National Natural Science Foundation of China (31660492), Natural Science Foundation of Jiangxi Province (20181BAB204017, 20192ACBL20019), and Jiangxi Provincial Department of Education (GJJ160377, GJJ170273).
Author Contributions
⊥ X.Z. and J.D. contributed equally to this work.
The authors declare no competing financial interest.
References
- Piemontese L. Plant food supplements with antioxidant properties for the treatment of chronic and neurodegenerative diseases: benefits or risks?. J. Diet. Suppl. 2017, 14, 478–484. 10.1080/19390211.2016.1247936. [DOI] [PubMed] [Google Scholar]
- Nabavi S. F.; Di Lorenzo A.; Izadi M.; Sobarzo-Sanchez E.; Daglia M.; Nabavi S. M. Antibacterial effects of cinnamon: from farm to food, cosmetic and pharmaceutical industries. Nutrients 2015, 7, 7729–7748. 10.3390/nu7095359. [DOI] [PMC free article] [PubMed] [Google Scholar]
- Zhang R.; Tan Z.; Zhao J.; Wen Y.; Fan S.; Liu C. Determination of pyrethroid residues in herbal tea using temperature-controlled ionic liquid dispersive liquid-liquid microextraction by high performance liquid chromatography. Sci. Rep. 2020, 10, 4709 10.1038/s41598-020-61755-z. [DOI] [PMC free article] [PubMed] [Google Scholar]
- Xue J.; Xu Y.; Liu F.; Xue J.; Li H.; Peng W. Comparison of different sample pre-treatments for multi-residue analysis of organochlorine and pyrethroid pesticides in chrysanthemum by gas chromatography with electron capture detection. J. Sep. Sci. 2013, 36, 1311–1316. 10.1002/jssc.201201067. [DOI] [PubMed] [Google Scholar]
- Xu R.; Wu J.; Liu Y.; Zhao R.; Chen B.; Yang M.; Chen J. Analysis of pesticide residues using the Quick Easy Cheap Effective Rugged and Safe (QuEChERS) pesticide multiresidue method in traditional Chinese medicine by gas chromatography with electron capture detection. Chemosphere 2011, 84, 908–912. 10.1016/j.chemosphere.2011.06.013. [DOI] [PubMed] [Google Scholar]
- Xiao J. J.; Duan J. S.; Xu X.; Li S. N.; Wang F.; Fang Q. K.; Liao M.; Cao H. Q. Behavior of pesticides and their metabolites in traditional Chinese medicine Paeoniae Radix Alba during processing and associated health risk. J. Pharm. Biomed. Anal. 2018, 161, 20–27. 10.1016/j.jpba.2018.08.029. [DOI] [PubMed] [Google Scholar]
- Xiao J.; Xu X.; Wang F.; Ma J.; Liao M.; Shi Y.; Fang Q.; Cao H. Analysis of exposure to pesticide residues from Traditional Chinese Medicine. J. Hazard. Mater. 2019, 365, 857–867. 10.1016/j.jhazmat.2018.11.075. [DOI] [PubMed] [Google Scholar]
- Yu G.; Guo Q.; Xie L.; Liu Y.; Wang X. Effects of subchronic exposure to carbendazim on spermatogenesis and fertility in male rats. Toxicol. Ind. Health 2009, 25, 41–47. 10.1177/0748233709103033. [DOI] [PubMed] [Google Scholar]
- Aire T. A. Short-term effects of carbendazim on the gross and microscopic features of the testes of Japanese quails (Coturnix coturnix japonica). Anat. Embryol. 2005, 210, 43–49. 10.1007/s00429-005-0001-0. [DOI] [PubMed] [Google Scholar]
- Hu Z.; Brooks S. A.; Dormoy V.; Hsu C. W.; Hsu H. Y.; Lin L. T.; Massfelder T.; Rathmell W. K.; Xia M.; Al-Mulla F.; Al-Temaimi R.; Amedei A.; Brown D. G.; Prudhomme K. R.; Colacci A. M.; Hamid R. A.; Mondello C.; Raju J.; Ryan E. P.; Woodrick J.; Scovassi A. I.; Singh N.; Vaccari M.; Roy R.; Forte S.; Memeo L.; Salem H. K.; Lowe L.; Jensen L.; Bisson W. H.; Kleinstreuer N. Assessing the carcinogenic potential of low-dose exposures to chemical mixtures in the environment: focus on the cancer hallmark of tumor angiogenesis. Carcinogenesis 2015, 36, S184–S202. 10.1093/carcin/bgv036. [DOI] [PMC free article] [PubMed] [Google Scholar]
- Ferreira A. L. G.; Loureiro S.; Soares A. M. V. M. Toxicity prediction of binary combinations of cadmium, carbendazim and low dissolved oxygen on daphnia magna. Aquat. Toxicol. 2008, 89, 28–39. 10.1016/j.aquatox.2008.05.012. [DOI] [PubMed] [Google Scholar]
- Yu I. S.; Lee J. S.; Kim S. D.; Kim Y. H.; Park H. W.; Ryu H. J.; Lee J. H.; Lee J. M.; Jung K.; Na C.; Joung J. Y.; Son C. G. Monitoring heavy metals, residual agricultural chemicals and sulfites in traditional herbal decoctions. BMC Complementary Altern. Med. 2017, 17, 154–163. 10.1186/s12906-017-1646-y. [DOI] [PMC free article] [PubMed] [Google Scholar]
- Subhani Q.; Huang Z.; Zhu Z.; Zhu Y. Simultaneous determination of imidacloprid and carbendazim in water samples by ion chromatography with fluorescence detector and post-column photochemical reactor. Talanta 2013, 116, 127–132. 10.1016/j.talanta.2013.05.023. [DOI] [PubMed] [Google Scholar]
- Li J.; Chi Y. Determination of carbendazim with multiwalled carbon nanotubes-polymeric methyl red film modified electrode. Pestic. Biochem. Physiol. 2009, 93, 101–104. 10.1016/j.pestbp.2008.12.004. [DOI] [Google Scholar]
- Hiemstra M.; de Kok A. Comprehensive multi-residue method for the target analysis of pesticides in crops using liquid chromatography–tandem mass spectrometry. J. Chromatogr. A 2007, 1154, 3–25. 10.1016/j.chroma.2007.03.123. [DOI] [PubMed] [Google Scholar]
- Belmonte Vega A.; Garrido Frenich A.; Martínez Vidal J. L. Monitoring of pesticides in agricultural water and soil samples from andalusia by liquid chromatography coupled to mass spectrometry. Anal. Chim. Acta 2005, 538, 117–127. 10.1016/j.aca.2005.02.003. [DOI] [Google Scholar]
- Pourreza N.; Rastegarzadeh S.; Larki A. Determination of fungicide carbendazim in water and soil samples using dispersive liquid-liquid microextraction and microvolume UV–vis spectrophotometry. Talanta 2015, 134, 24–29. 10.1016/j.talanta.2014.10.056. [DOI] [PubMed] [Google Scholar]
- Strickland A. D.; Batt C. A. Detection of carbendazim by surface-enhanced Raman scattering using cyclodextrin inclusion complexes on gold nanorods. Anal. Chem. 2009, 81, 2895–2903. 10.1021/ac801626x. [DOI] [PubMed] [Google Scholar]
- Li J.-L.; Sun D.-W.; Pu H.; Jayas D. S. Determination of trace thiophanate-methyl and its metabolite carbendazim with teratogenic risk in red bell pepper (Capsicumannuum L.) by surface-enhanced Raman imaging technique. Food Chem. 2017, 218, 543–552. 10.1016/j.foodchem.2016.09.051. [DOI] [PubMed] [Google Scholar]
- Zhou Y.; Cheng F.; Hong Y.; Huang J.; Zhang X.; Liao X. Rapid and sensitive detection of isoproturon via an electrochemical sensor based on highly water-dispersed carbon hybrid material. Food. Anal. Methods 2020, 13, 839–849. 10.1007/s12161-020-01707-5. [DOI] [Google Scholar]
- Nasir T.; Herzog G.; Hebrant M.; Despas C.; Liu L.; Walcarius A. Mesoporous silica thin films for improved electrochemical detection of paraquat. ACS Sens. 2018, 3, 484–493. 10.1021/acssensors.7b00920. [DOI] [PubMed] [Google Scholar]
- Maximiano E. M.; Cardoso C. A. L.; Arruda G. J. Simultaneous electroanalytical determination of thiram and carbendazim in samples of fresh fruit juices in the presence of surfactants. Food. Anal. Methods 2020, 13, 119–130. 10.1007/s12161-019-01550-3. [DOI] [Google Scholar]
- Karimi-Maleh H.; Cellat K.; Arıkan K.; Savk A.; Karimi F.; Şen F. Palladium–Nickel nanoparticles decorated on functionalized-MWCNT for high precision non-enzymatic glucose sensing. Mater. Chem. Phys. 2020, 250, 123042 10.1016/j.matchemphys.2020.123042. [DOI] [Google Scholar]
- Karimi-Maleh H.; Karimi F.; Malekmohammadi S.; Zakariae N.; Esmaeili R.; Rostamnia S.; Yola M. L.; Atar N.; Movaghgharnezhad S.; Rajendran S.; Razmjou A.; Orooji Y.; Agarwal S.; Gupta V. K. An amplified voltammetric sensor based on platinum nanoparticle/polyoxometalate/two-dimensional hexagonal boron nitride nanosheets composite and ionic liquid for determination of N-hydroxysuccinimide in water samples. J. Mol. Liq. 2020, 310, 113185 10.1016/j.molliq.2020.113185. [DOI] [Google Scholar]
- Karimi-Maleh H.; Karimi F.; Orooji Y.; Mansouri G.; Razmjou A.; Aygun A.; Sen F. A new nickel-based co-crystal complex electrocatalyst amplified by NiO dope Pt nanostructure hybrid; a highly sensitive approach for determination of cysteamine in the presence of serotonin. Sci. Rep. 2020, 10, 11699 10.1038/s41598-020-68663-2. [DOI] [PMC free article] [PubMed] [Google Scholar]
- Karimi-Maleh H.; Arotiba O. A. Simultaneous determination of cholesterol, ascorbic acid and uric acid as three essential biological compounds at a carbon paste electrode modified with copper oxide decorated reduced graphene oxide nanocomposite and ionic liquid. J. Colloid Interface Sci. 2020, 560, 208–212. 10.1016/j.jcis.2019.10.007. [DOI] [PubMed] [Google Scholar]
- Karimi-Maleh H.; Fakude C. T.; Mabuba N.; Peleyeju G. M.; Arotiba O. A. The determination of 2-phenylphenol in the presence of 4-chlorophenol using nano-Fe3O4/ionic liquid paste electrode as an electrochemical sensor. J. Colloid Interface Sci. 2019, 554, 603–610. 10.1016/j.jcis.2019.07.047. [DOI] [PubMed] [Google Scholar]
- Karimi-Maleh H.; Karimi F.; Alizadeh M.; Sanati A. L. Electrochemical sensors, a bright future in the fabrication of portable kits in analytical systems. Chem. Rec. 2020, 20, 682–692. 10.1002/tcr.201900092. [DOI] [PubMed] [Google Scholar]
- Khodadadi A.; Faghih-Mirzaei E.; Karimi-Maleh H.; Abbaspourrad A.; Agarwal S.; Gupta V. K. A new epirubicin biosensor based on amplifying DNA interactions with polypyrrole and nitrogen-doped reduced graphene: Experimental and docking theoretical investigations. Sens. Actuators, B 2019, 284, 568–574. 10.1016/j.snb.2018.12.164. [DOI] [Google Scholar]
- Tahernejad-Javazmi F.; Shabani-Nooshabadi M.; Karimi-Maleh H. Analysis of glutathione in the presence of acetaminophen and tyrosine via an amplified electrode with MgO/SWCNTs as a sensor in the hemolyzed erythrocyte. Talanta 2018, 176, 208–213. 10.1016/j.talanta.2017.08.027. [DOI] [PubMed] [Google Scholar]
- Zhang X.; Lai Z.; Tan C.; Zhang H. Solution-processed two-dimensional MoS2 nanosheets: preparation, hybridization, and applications. Angew. Chem., Int. Ed. 2016, 55, 8816–8838. 10.1002/anie.201509933. [DOI] [PubMed] [Google Scholar]
- Kalantar-zadeh K.; Ou J. Z. Biosensors based on two-dimensional MoS2. ACS Sens. 2016, 1, 5–16. 10.1021/acssensors.5b00142. [DOI] [Google Scholar]
- Jiao Y.; Huang Q.; Wang J.; He Z.; Li Z. A novel MoS2 quantum dots (QDs) decorated Z-scheme g-C3N4 nanosheet/N-doped carbon dots heterostructure photocatalyst for photocatalytic hydrogen evolution. Appl. Catal., B 2019, 247, 124–132. 10.1016/j.apcatb.2019.01.073. [DOI] [Google Scholar]
- Lin D.; Su Z.; Wei G. Three-dimensional porous reduced graphene oxide decorated with MoS2 quantum dots for electrochemical determination of hydrogen peroxide. Mater. Today Chem. 2018, 7, 76–83. 10.1016/j.mtchem.2018.02.001. [DOI] [Google Scholar]
- Li B. L.; Setyawati M. I.; Zou H. L.; Dong J. X.; Luo H. Q.; Li N. B.; Leong D. T. Emerging 0D transition-metal dichalcogenides for sensors, biomedicine, and clean energy. Small 2017, 13, 1700527 10.1002/smll.201700527. [DOI] [PubMed] [Google Scholar]
- Yuan H.; Li J.; Yuan C.; He Z. Facile synthesis of MoS2@CNT as an effective catalyst for hydrogen production in microbial electrolysis cells. ChemElectroChem 2014, 1, 1828–1833. 10.1002/celc.201402150. [DOI] [Google Scholar]
- Chen L. X.; Chen Z. W.; Wang Y.; Yang C. C.; Jiang Q. Design of dual-modified MoS2 with nanoporous Ni and graphene as efficient catalysts for the hydrogen evolution reaction. ACS Catal. 2018, 8, 8107–8114. 10.1021/acscatal.8b01164. [DOI] [Google Scholar]
- Li F.; Li J.; Cao Z.; Lin X.; Li X.; Fang Y.; An X.; Fu Y.; Jin J.; Li R. MoS2 quantum dot decorated RGO: a designed electrocatalyst with high active site density for the hydrogen evolution reaction. J. Mater. Chem. A 2015, 3, 21772–21778. 10.1039/C5TA05219J. [DOI] [Google Scholar]
- Ren X.; Pang L.; Zhang Y.; Ren X.; Fan H.; Liu S. One-step hydrothermal synthesis of monolayer MoS2 quantum dots for highly efficient electrocatalytic hydrogen evolution. J. Mater. Chem. A 2015, 3, 10693–10697. 10.1039/C5TA02198G. [DOI] [Google Scholar]
- Yang X.; Jia Q.; Duan F.; Hu B.; Wang M.; He L.; Song Y.; Zhang Z. Multiwall carbon nanotubes loaded with MoS2 quantum dots and MXene quantum dots: Non–Pt bifunctional catalyst for the methanol oxidation and oxygen reduction reactions in alkaline solution. Appl. Surf. Sci. 2019, 464, 78–87. 10.1016/j.apsusc.2018.09.069. [DOI] [Google Scholar]
- Cheng F.; Liao X.; Huang Z.; Xu L.; Zhou Y.; Zhang X. Highly sensitive detection of thiabendazole residues in food samples based on multiwall carbon nanotubes decorated two-dimensional layered molybdenum disulfide. Food. Anal. Methods 2020, 13, 811–822. 10.1007/s12161-019-01698-y. [DOI] [Google Scholar]
- Datsyuk V.; Kalyva M.; Papagelis K.; Parthenios J.; Tasis D.; Siokou A.; Kallitsis I.; Galiotis C. Chemical oxidation of multiwalled carbon nanotubes. Carbon 2008, 46, 833–840. 10.1016/j.carbon.2008.02.012. [DOI] [Google Scholar]
- Maultzsch J.; Reich S.; Thomsen C. Raman scattering in carbon nanotubes revisited. Phys. Rev. B 2002, 65, 233402 10.1103/PhysRevB.65.233402. [DOI] [Google Scholar]
- Tang Q.; Jiang D.-e. Mechanism of hydrogen evolution reaction on 1T-MoS2 from first principles. ACS Catal. 2016, 6, 4953–4961. 10.1021/acscatal.6b01211. [DOI] [Google Scholar]
- Jiménez Sandoval S.; Yang D.; Frindt R. F.; Irwin J. C. Raman study and lattice dynamics of single molecular layers of MoS2. Phys. Rev. B 1991, 44, 3955–3962. 10.1103/PhysRevB.44.3955. [DOI] [PubMed] [Google Scholar]
- Voiry D.; Salehi M.; Silva R.; Fujita T.; Chen M.; Asefa T.; Shenoy V. B.; Eda G.; Chhowalla M. Conducting MoS2 nanosheets as catalysts for hydrogen evolution reaction. Nano Lett. 2013, 13, 6222–6227. 10.1021/nl403661s. [DOI] [PubMed] [Google Scholar]
- Lee C.; Yan H.; Brus L. E.; Heinz T. F.; Hone J.; Ryu S. Anomalous lattice vibrations of single- and few-layer MoS2. ACS Nano 2010, 4, 2695–2700. 10.1021/nn1003937. [DOI] [PubMed] [Google Scholar]
- Sun M.; Adjaye J.; Nelson A. E. Theoretical investigations of the structures and properties of molybdenum-based sulfide catalysts. Appl. Catal., A 2004, 263, 131–143. 10.1016/j.apcata.2003.12.011. [DOI] [Google Scholar]
- Acerce M.; Voiry D.; Chhowalla M. Metallic 1T phase MoS2 nanosheets as supercapacitor electrode materials. Nat. Nanotechnol. 2015, 10, 313–318. 10.1038/nnano.2015.40. [DOI] [PubMed] [Google Scholar]
- Gopalakrishnan D.; Damien D.; Shaijumon M. M. MoS2 quantum dot-interspersed exfoliated MoS2 nanosheets. ACS Nano 2014, 8, 5297–5303. 10.1021/nn501479e. [DOI] [PubMed] [Google Scholar]
- Dong Y.; Yang J.; Liu X.; Zhang L. Ionic liquids-modified CaFe2O4/MWCNTs nano-hybrid as an electrode material for detection of carbendazim. J. Electrochem. Soc. 2016, 163, B652–B658. 10.1149/2.0811613jes. [DOI] [Google Scholar]
- Li M.; Jing L. Electrochemical behavior of acetaminophen and its detection on the PANI–MWCNTs composite modified electrode. Electrochim. Acta 2007, 52, 3250–3257. 10.1016/j.electacta.2006.10.001. [DOI] [Google Scholar]
- Duan F.; Zhang S.; Yang L.; Zhang Z.; He L.; Wang M. Bifunctional aptasensor based on novel two-dimensional nanocomposite of MoS2 quantum dots and g-C3N4 nanosheets decorated with chitosan-stabilized Au nanoparticles for selectively detecting prostate specific antigen. Anal. Chim. Acta 2018, 1036, 121–132. 10.1016/j.aca.2018.06.070. [DOI] [PubMed] [Google Scholar]
- Song Y.; Xu M.; Li Z.; He L.; Hu M.; He L.; Zhang Z.; Du M. Ultrasensitive detection of bisphenol A under diverse environments with an electrochemical aptasensor based on multicomponent AgMo heteronanostructure. Sens. Actuators, B 2020, 321, 128527 10.1016/j.snb.2020.128527. [DOI] [Google Scholar]
- Wang M.; Zhang Y.; Cui M.; Lu Y.; Peng D.; Cao X.; Wu C.; Zhou J.; Feng Y.; Liu W.; Chen Z.; Liu X.; Wang T.; Song P.; Huang Y. Molecular-scale cage-confinement pyrolysis route to size-controlled molybdenum carbide nanoparticles for electrochemical sensor. Biosens. Bioelectron. 2020, 165, 112373 10.1016/j.bios.2020.112373. [DOI] [PubMed] [Google Scholar]
- Liu S.; Lai G.; Zhang H.; Yu A. Amperometric aptasensing of chloramphenicol at a glassy carbon electrode modified with a nanocomposite consisting of graphene and silver nanoparticles. Microchim. Acta 2017, 184, 1445–1451. 10.1007/s00604-017-2138-y. [DOI] [Google Scholar]
- Periyasamy S.; Vinoth Kumar J.; Chen S. M.; Annamalai Y.; Karthik R.; Erumaipatty Rajagounder N. Structural insights on 2D gadolinium tungstate nanoflake: a promising electrocatalyst for sensor and photocatalyst for the degradation of postharvest fungicide (carbendazim). ACS Appl. Mater. Interfaces 2019, 11, 37172–37183. 10.1021/acsami.9b07336. [DOI] [PubMed] [Google Scholar]
- Laviron E. Adsorption, autoinhibition and autocatalysis in polarography and in linear potential sweep voltammetry. J. Electroanal. Chem. Interfacial Electrochem. 1974, 52, 355–393. 10.1016/S0022-0728(74)80448-1. [DOI] [Google Scholar]
- Liao X.; Huang Z.; Huang K.; Qiu M.; Chen F.; Zhang Y.; Wen Y.; Chen J. Highly sensitive detection of carbendazim and its electrochemical oxidation mechanism at a nanohybrid sensor. J. Electrochem. Soc. 2019, 166, B322–B327. 10.1149/2.0251906jes. [DOI] [Google Scholar]
- Cui R.; Xu D.; Xie X.; Yi Y.; Quan Y.; Zhou M.; Gong J.; Han Z.; Zhang G. Phosphorus-doped helical carbon nanofibers as enhanced sensing platform for electrochemical detection of carbendazim. Food Chem. 2017, 221, 457–463. 10.1016/j.foodchem.2016.10.094. [DOI] [PubMed] [Google Scholar]
- Luo S.; Wu Y.; Gou H. A voltammetric sensor based on GO–MWNTs hybrid nanomaterial-modified electrode for determination of carbendazim in soil and water samples. Ionics 2013, 19, 673–680. 10.1007/s11581-013-0868-3. [DOI] [Google Scholar]
- Ya Y.; Jiang C.; Mo L.; Li T.; Xie L.; He J.; Tang L.; Ning D.; Yan F. Electrochemical determination of carbendazim in food samples using an electrochemically reduced Nitrogen-doped graphene oxide-modified glassy carbon electrode. Food Anal. Methods 2017, 10, 1479–1487. 10.1007/s12161-016-0708-y. [DOI] [Google Scholar]
- Zeng T.; Ke X.; Li L.; Cheng X.; Ni Y.; Ouyang X.; Zhang X.; Chen L.; Huang L.; Hu H.-C. Quantification of N-methyl morpholine N-oxide in biorefinery process solution by headspace gas chromatography. Cellulose 2020, 27, 6861–6870. 10.1007/s10570-020-03259-7. [DOI] [Google Scholar]
- Maximiano E. M.; de Lima F.; Cardoso C. A. L.; Arruda G. J. Modification of carbon paste electrodes with recrystallized zeolite for simultaneous quantification of thiram and carbendazim in food samples and an agricultural formulation. Electrochim. Acta 2018, 259, 66–76. 10.1016/j.electacta.2017.10.162. [DOI] [Google Scholar]
- Razzino C. A.; Sgobbi L. F.; Canevari T. C.; Cancino J.; Machado S. A. Sensitive determination of carbendazim in orange juice by electrode modified with hybrid material. Food Chem. 2015, 170, 360–365. 10.1016/j.foodchem.2014.08.085. [DOI] [PubMed] [Google Scholar]
- Tian C.; Zhang S.; Wang H.; Chen C.; Han Z.; Chen M.; Zhu Y.; Cui R.; Zhang G. Three-dimensional nanoporous copper and reduced graphene oxide composites as enhanced sensing platform for electrochemical detection of carbendazim. J. Electroanal. Chem. 2019, 847, 113243–113251. 10.1016/j.jelechem.2019.113243. [DOI] [Google Scholar]
- Zhou Y.; Cui R.; Dang Y.; Li Y.; Zou Y. Doping controlled oxygen vacancies of ZnWO4 as a novel and effective sensing platform for carbendazim and biomolecule. Sens. Actuators, B 2019, 296, 126680–126688. 10.1016/j.snb.2019.126680. [DOI] [Google Scholar]


