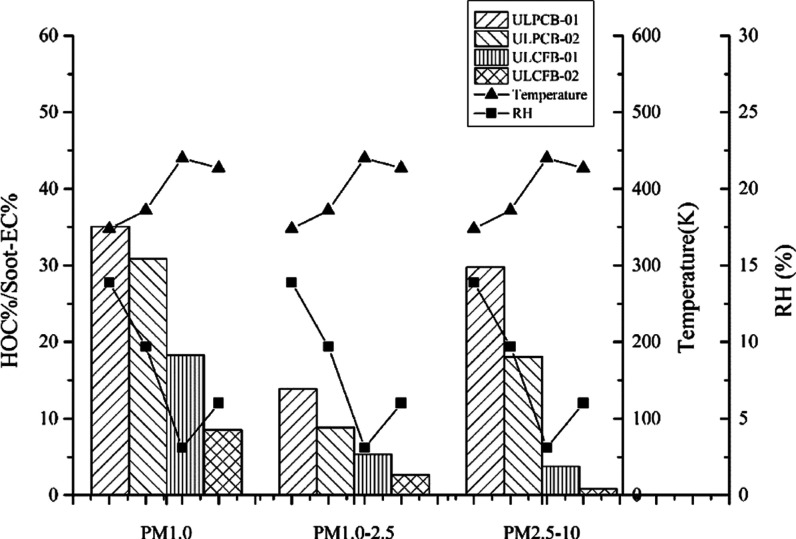
Abstract
Particulate matters (PMs) were collected in stacks from two types of ultralow emission coal-fired power plants by a heated electrical low-pressure impactor (HT-ELPI+), including ultralow emission pulverized combustion technology boilers (ULPCBs) and ultralow emission circulating fluidized bed boilers (ULCFBs). The characteristics of organic carbon (OC) and elemental carbon (EC) in size-resolved particles were analyzed. The ultralow emission technologies significantly decreased the mass concentrations of the carbonaceous content, and the emission concentrations of OC and EC ranged from 5.64 to 17.9 μg/m3 for ULPCBs and from 0.57 to 1.85 μg/m3 for ULCFBs. However, the number concentration of particles was not significantly decreased in the four ultralow emission power plants. The OC in the particle emission of ULPCBs presents a bimodal size distribution with the particle size, while three successive unimodal distributions were observed in the ULCFB emission. Compared to ULPCBs, much more char-EC and soot-EC condensed in the particles, which were collected from ULCFBs. Furthermore, the char-EC/soot-EC in the particle fractions of ULPCBs characterized by the “V” type with the sequence of PM1.0 > PM2.5–10 > PM1.0–2.5, differing from the PM1.0 > PM1.0–2.5 > PM2.5–10 of ULCFBs. The ratios of OC/EC in the stacks from two types of boilers did not show obvious variations in particle size distributions, and the mean OC/EC was far higher than those for non-ultralow emission power plants. Considering the impact of OC1, OC4, and EC1, the ratio of high-temperature organic carbon (HTOC, defined as OC2 + OC3) and soot-EC was studied. The HTOC/soot-EC increased with the increase of RH in the stack, and the highest HTOC/soot-EC values were obtained from ULPCBs (33.0% (PM1.0), 11.4% (PM1.0–2.5), and 23.9% (PM2.5–10)). Meanwhile, strong correlations (0.69–0.85, p < 0.001) between HTOC and soot-EC were obtained, implying that HTOC and soot-EC probably simultaneously condensed in the purification equipment.
1. Introduction
Carbonaceous particles can be categorized into organic carbon (OC) and elemental carbon (EC), which play an important role in global climate change.1 EC is directly emitted from the primary source and formed by the incomplete combustion via pyrolysis of hydrocarbons. OC is a mixture of hundreds of compounds that are emitted from various sources, and it can be classified into primary organic compounds (POCs) and secondary organic compounds (SOCs) according to formation processes.
Fossil fuel combustion and industrial activities are considered as one of the major anthropogenic sources for OC and EC in particulate matters.2 Coal-fired power plants (CFPPs) represent an important pollution source and exhaust huge amounts of gaseous pollutants, such as volatile/semivolatile organic compounds (VOCs and SVOCs), CO, CO2, NH3, NOx, and SO2. China had paid significant attention to pollutants emitted from coal-fired power plants in the last decade and then put forward the ultralow emission standards for CFPPs, which required the emission concentration of particles, SO2, and NO2 lower than 10, 35, and 50 mg/m,3 respectively. The emission characteristics of coarse and fine particulates from ultralow emission units (ULs) changed a lot as new combustion technologies, operation conditions, and high-efficiency purification equipment were used. In recent years, many emission inventories and source profiles have been established through analyzing PM2.5 and PM10, which are collected from ultralow emission units (ULs). The data from the ULs showed significant differences in the variations of boilers, and the emission characteristics of the carbonaceous particles from the ULs have rarely been reported.
The characteristics of carbonaceous particles from pollution sources are very important to the source apportionment studies, and OC, EC, and OC/EC are usually used to assess the relative contributions of the primary emission and secondary organic aerosol. However, the detailed carbonaceous particulate matters of different types of power plants with ultralow emission are rarely reported. Therefore, it is imperative to study the new characteristics of ULs to adapt to the new situation, and the details of exhaust carbonaceous could promote understanding and identifying pollution sources in air pollution episodes. This article described the carbonaceous particle emission characteristics of two types of ultralow emission power plants compared to the previous studies, including two PCBs and two CFBs. In this study, samples collected from the dust remover and stacks from two types of ULs using a size-resolved detector and a resuspension method and the characteristics of OC and EC in different particle fractions (PM1.0, PM1.0–2.5, and PM2.5–10) were discussed. In addition, char-EC and soot-EC were also discussed to identify emission characteristics. Finally, the conception of high-temperature organic carbon (HTOC) was introduced, and HTOC/soot-EC in the particle fractions was discussed.
2. Materials and Methods
2.1. Sampling Methods
The samples were collected from the routine monitoring holes on the stack set by local environmental protection departments. The particulate matters were collected by a particle sampler using a heated electrical low-pressure impactor (HT-ELPI+, Dekati Ltd., Finland) on 14 membranes based on aerodynamic diameters (D50) in the range from 0.013 to 9.89 μm (100 °C). The sampling system (the probe, transfer line, cyclone, dilution tunnel, compressed air, and impactor of ELPI+) was heated to 100 °C and balanced at least 3 h before starting the test to prevent vapor condensation and the signal drift. Further details of the instrumentation and data-processing methods are given in our previous work.4 Clean and dry aluminum foils (25 mm, Dekati Ltd.) were used during the mass and number concentration real-time monitoring process. The high-temperature resistant Apiezon-L (M & I Materials Ltd.) was greased on the aluminum foil to suppress the particle bouncing effect.5 Meanwhile, a quartz membrane (Φ 25 mm, Pall) was used to analyze the carbonaceous species, and the real-time monitor function must be turned off during the entire sampling period to avoid the loss of particulate matters caused by charging. In addition, the sampling time varied with the emission concentration of PM, and the maximum amount of particulates on each membrane must be lower than 1 mg to reduce the impact of particle rebound.
2.2. Details of Ultralow Emission Power Plants
Table 1 lists the information of four ULs in this study. The ULs are classified according to the type of boiler, including two PCBs and two CFBs. Two ultralow emission control for PCB (ULPCB) units equipped with electrostatic precipitators (ESPs) and bag filters (BFs) to remove particles from flue gases, wet flue gas desulfurization (WFGD) to decrease the amount of sulfur dioxide, and wet electrostatic precipitators (WESPs) to further decrease the emission concentration of particle matters and other pollutants were used.2,6 Comparing with ULPCBs, ESPs or BFs and dry/semidry desulfurization were used in the two ultralow emission control for CFB (ULCFB) units to remove particles and sulfur dioxide, respectively. In addition, selective catalytic reduction (SCR) and selective noncatalytic reduction (SNCR) were used in the two types of ULs to remove NOx.
Table 1. Background of Power Plants and the Mass Concentration of OC and EC in PMsa.
| |
stack
conditions |
emission characteristics |
|||||||||||||
|---|---|---|---|---|---|---|---|---|---|---|---|---|---|---|---|
| load | filtration technology |
RH | T | dust emissions | number | OC, μg/m3 |
EC, μg/m3 |
||||||||
| boiler type and code | MW | denitration | dust remover | desulfuration | dust remover | % | K | mg/m3 | dN/d log Dp | PM1.0 | PM2.5 | PM10 | PM1.0 | PM2.5 | PM10 |
| ULPCB-01 | 600 | SCR | ESPs + BFs | WFGD | WESP | 13.9 | 348 | 2.1 | 1.06 × 10⁵ | 2.01 | 15.28 | 17.9 | 0.19 | 0.83 | 0.93 |
| ULPCB-02 | 330 | SCR | ESPs + BFs | WFGD | WESP | 9.7 | 372 | 4.5 | 1.19 × 10⁵ | 1.04 | 6.31 | 11.6 | 0.09 | 0.75 | 0.83 |
| ULCFB-01 | 330 | SCR | BFs | quick lime | 3.1 | 440 | 3.2 | 1.97 × 10⁵ | 2.58 | 8.32 | 16.8 | 0.15 | 0.41 | 0.57 | |
| ULCFB-02 | 60 | SNCR | ESPs | quick lime | 6.3 | 427 | 4.2 | 3.69 × 10⁵ | 1.24 | 4.58 | 5.64 | 0.14 | 1.06 | 1.85 | |
SCR: selective catalytic reduction; SNCR: selective noncatalytic reduction; and BF: bag filter.
2.3. Analytical Methods
OC and EC were analyzed with a thermal/optical carbon analyzer (DRI 2001A Atmoslytic Inc.). The details of thermal/optical carbon analysis methods are given in our previous work.4 Briefly, the temperature program IMPROVE_A (Interagency Monitoring of Protected Visual Environments) protocol4,7 was used in the analysis process, and the temperature-determined species OC1 (120 °C), OC2 (250 °C), OC3 (450 °C), OC4 (550 °C), EC1 (550 °C), EC2 (700 °C), EC3 (850 °C) were obtained. Generally, OC1 consists of the most volatile organic compounds, while OC2, OC3, OC4, and POC contain semi- and nonvolatile organic compounds. The different evaporation/oxidation temperatures represent their unique characteristics and can help to identify the source or emission features in different boilers. However, the pyrolysis of organic carbon (POC) must be considered to avoid underestimation of OC and overestimation of EC because there is an increase in light absorption, resulting in a decrease in reflectance and transmission when pyrolysis takes place, and this was also described in the study of Watson.8 Finally, the total OC is defined as OC1 + OC2 + OC3 + OC4 + POC, and EC is defined as EC1 + EC2 + EC3 – POC.
2.4. Quality Assurance
The probe and dilution tunnel was cleaned thoroughly with deionized water and compressed air to remove the residual particles. The cutting diameters of cyclone and HT-ELPI+ were recalculated with a sheet from DEKATI to keep isokinetic sampling. In addition, the quartz membranes for collecting particle matters were baked at 900 °C for 3 h before sampling to remove absorbed organic compounds. All membranes must be balanced, and static electricity must be removed before weighing. In addition, each membrane was weighed at least three times before and after sampling with an ultramicro balance (Mettler-Toledo Ltd., UMX2, Switzerland), and the average value was used to calculate the particulate mass. All collected samples were equilibrated 48 h under strict temperatures (20–23 °C) and RH (35–45%) conditions. The blank membranes were analyzed, and the detection limits for OC and EC were 0.35 and 0.04 μg/cm2, respectively.
In the process of chemical analysis, a blank test was performed daily in the laboratory, and in the process of sampling, the in-situ blank filter was placed with the standby impactor to monitor the background value. The results showed that the analysis results of the blank samples were below or close to the detection limit of the chemical species, and three parallel samples were obtained to get the mean value and standard deviation.
3. Results and Discussion
3.1. OC and EC in the Primary Particle Emission
Table 1 shows the detailed data of the four ULs during sampling campaigns. The dust removers played an important role in the ultralow emission system, and the particulate matter removal efficiency from the exhausts was more than 95% for PM10 and PM2.5.6,9 The mass concentrations of particle matters from the four ULs varied from 2.1 to 4.2 mg/m3, significantly lower than the emission limit of 10 mg/m3. The mass concentration of OC from the four ULs was 17.9 μg/m3 (ULPCB-01), 11.6 μg/m3 (ULPCB-02), 16.8 μg/m3 (ULCFB-01), and 5.64 μg/m3 (ULCFB-02), approximately accounting for 1.7, 0.49, 5.9, and 5.0% in PM10, respectively. The obtained data from ULs were significantly lower than the non-ultralow emission pulverized combustion technology boilers (NULPCBs, 730–790 μg/m3) and non-ultralow emission circulating fluidized bed boilers (NULCFBs, 710–3350 μg/m3) by comparing with our previous study.4 Meanwhile, the mass concentration of EC was greatly lower than the value of NULs,4 ranging from 0.93 to 1.85 μg/m3. The purification equipment used in the ULs significantly decreased the mass concentration of the particulate matters, but this was limited to the decrease in the number concentration of particles. The number concentrations of two ULPCBs were 1.06 × 10⁵ and 1.19 × 10⁵ (dN/dlog Dp), slightly lower than those of two ULCFBs (1.97 × 10⁵ and 3.69 × 10⁵ (dN/dlog Dp)).
It has been reported that the mass concentration of PM monitored by ELPI+ in the stack from NULs showed bimodal and trimodal distributions. The peaks of bimodal distributions were at 0.1 and 2.0 μm, and the peaks of trimodal distributions were all lower than 1 μm.10,11 The characteristics of mass concentration identified in the present study differed substantially from those previously reported in samples collected from NULs. The trimodal distributions were found from the four ULs, with the rightmost peaks at around 3.72 and 5.48 μm in ULPCBs and ULCFBs, respectively.
The number distributions of PM emitted from two types of ULs were mainly concentrated in PM1.0. There were two significant submicrometre peaks ranged from 0.013 to 0.0835 μm, and another two less obvious peaks in the range of 0.143–3.72 μm (Figure 1). In addition, a significant difference was identified on the Aitken nucleus between ULPCBs and ULCFBs because trace elements, ions, and organic compounds easily transform to a large quantity of PMs under the high-temperature condition in PCBs.12
Figure 1.
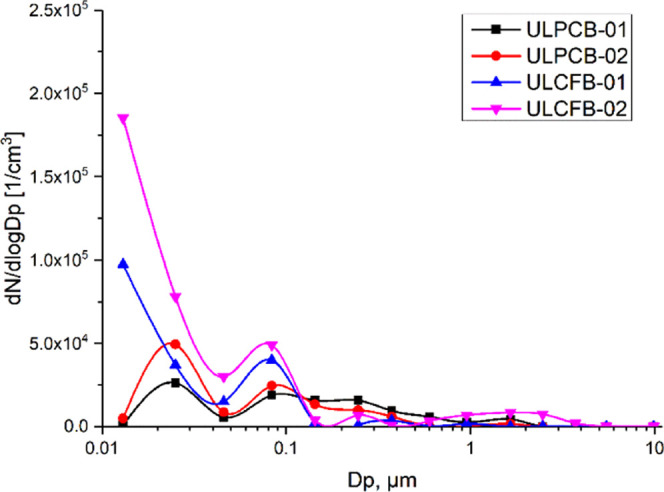
Number concentration distribution of PM monitored in the stack.
3.2. Particulate Size Distribution of OC and EC
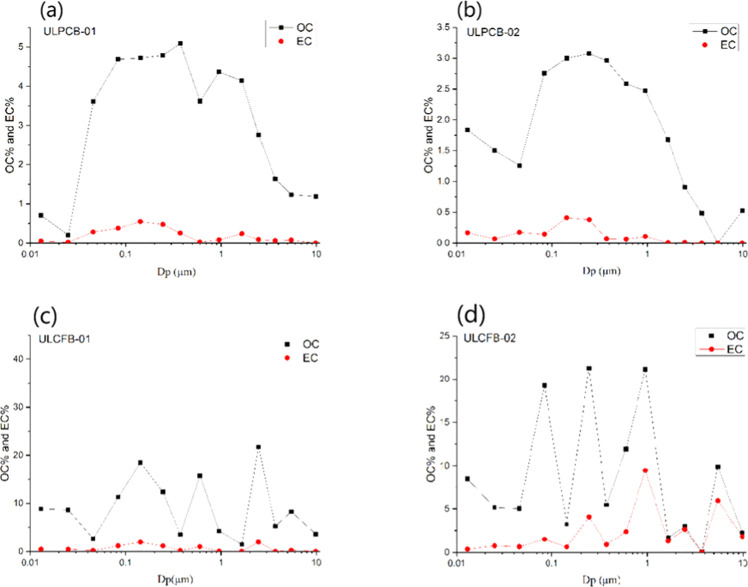
The percentages of particulate OC and EC on each stage were calculated (Figure 2) and compared. According to our previous study,4 the OC of NULPCB particle emission has a trimodal distribution including two submicrometre modes with peaks near 1.0 and 0.1 μm and a fine peak near 2.4 μm. However, two distribution characteristics of carbonaceous components were observed according to the boiler units in the present studies, and the characteristic of ULPCBs identified in this study differed substantially from our previous studies of NULPCBs. The mass size distribution of OC of ULPCBs displayed a bimodal distribution, which consists of two submicrometre modes, including one broad peak and one shoulder peak approximately at 0.374 and 0.953 μm, respectively. WESP is the most extensively used technology by many ultralow emission pulverized combustion technology boilers, and the above results demonstrated that WESP has significant impacts on the mass and distribution of particulate carbonaceous particles to remove partial PMs from the exhaust of WFGD.2,6,13 However, similar successive unimodal distributions of OC and EC were identified in NULCFBs and ULCFBs, indicating that the chemical and physical properties of particles probably did not change too much before and after modification of CFB units.
Figure 2.
Size distribution of OC% and EC% in the four ultralow emission power plants, i.e., (a) ULPCB-01, (b) ULPCB-02, (c) ULCFB-01, and (d) ULCFB-02. The black line denotes OC% and the red line means denotes EC%.
3.3. OC/EC Ratios
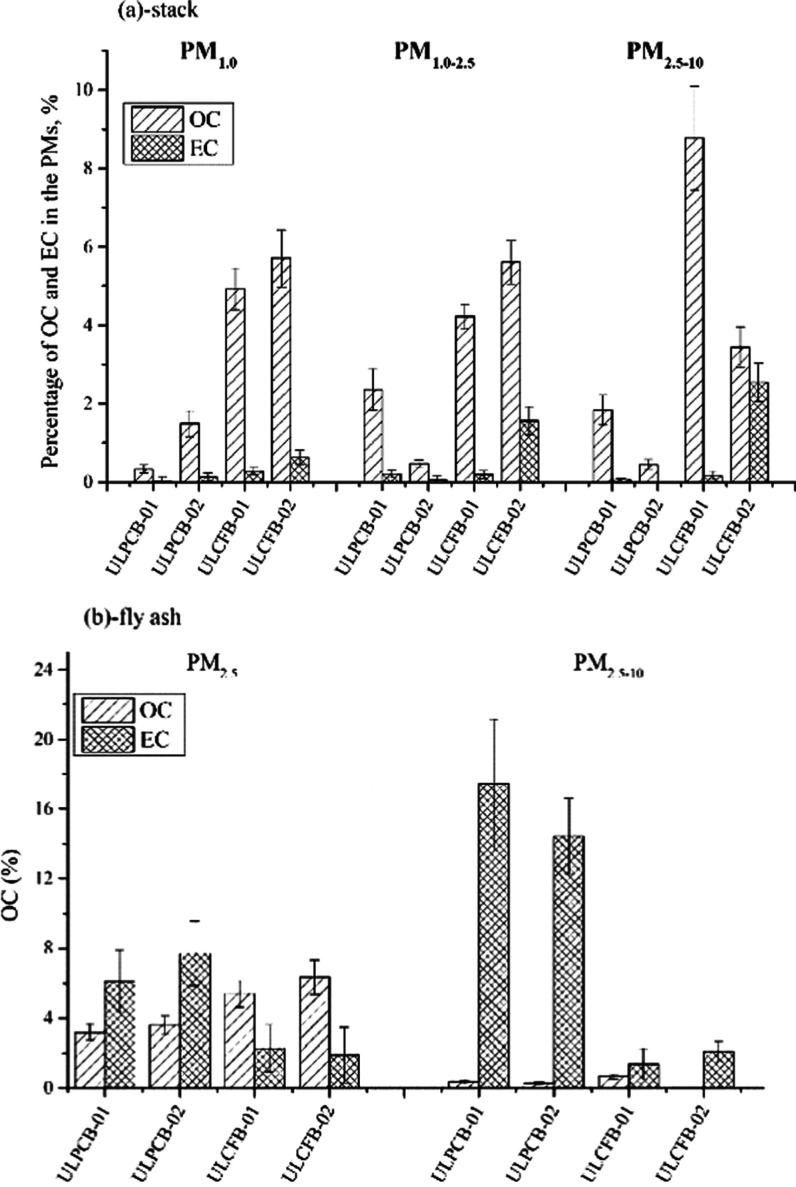
The samples were collected from the bottom of dust removers and exhaust, and the contents of OC and EC in the PMs were analyzed (Figure 3). Generally, the content of carbonaceous components varies with the types of boiler, fuel, combustion conditions, and purification technology. The combustion temperatures of boilers are probably the most important factors in the content of OC and EC. Low OC% and EC% in different particle fractions of ULPCBs were observed and attributed to the high combustion temperature (approximately 1550 K), approximately accounting for 0.33–4.35% (OC) and 0.01–0.21% (EC). Meanwhile, the percentages of particulate carbonaceous of ULCFBs were range from 3.44 to 8.77% for OC and from 0.17 to 2.54% for EC under a relatively lower temperature (1100 K).
Figure 3.
Percentages of OC and EC in PMs of four the ultralow emission power plants. (a) Samples were collected from the stack using ELPI+ and (b) samples collected from the bottom of dust removers.
Fly ash samples were recollected from resuspending equipment in the lab and analyzed by a thermal/optical carbon analyzer (Figure 3b). For the pulverized combustion technology boilers, the high temperature decreases the residence of OC in the swelling of coal particles, while a reduction environment contributes to enhancing the content of EC in the PM. It is obvious that the two ULPCB units have higher content of EC than that of OC in fine particulate matters and coarse particulate matters, with 2–50 times in PM2.5 and PM2.5–10, respectively. However, the opposite trend was observed in the fine particulate matters of ULCFB units, both of the two ULCFB units have higher OC% in PM2.5. The higher OC% of PM2.5 from ULCFB units is attributed to the relatively lower furnace temperature, and the uneven bedding temperature of the circulating fluidized bed boilers results in the higher EC content in the swelling coal particles. The above results indicated that the furnace temperature and the load might be the more important factors for the formation of carbonaceous aerosols, and the emission characteristics of carbonaceous aerosols probably depended on the dust removers.
The OC/EC ratios of stationary pollution sources are usually used to estimate the contribution of the source to atmospheric particle concentrations, playing an important role in the source apportion research.14 Nevertheless, OC and EC emissions vary from source to source, and hence the primary OC/EC ratio is complicated than our imagination. In the present studies, the gaps of OC/EC from the four ULs became wider with the increase of particle diameters, with the range of 9.12–17.7 (mean 12.0) of PM1.0, 4.3–20.3 (mean 12.9) of PM2.5, and 3.05–29.4 (mean 16.5) of PM10, respectively (Figure 4a). In the other report, OC/EC ratios for the industrial emission were in the range of 3.5–5,15 and these values were close to those reported in our previous studies for the non-ultralow power plant with the range from 3.8 to 4.2. However, the average OC/EC values in PM2.5 of ULPCB and ULCFB units were 13.5 and 12.3, significantly higher than those for NULPCB (3.8) and NULCFB (4.2) units. Comparing to the characteristics of stack samples, the ratio of OC/EC in fly ash could be identified by the significant gap of OC/EC between the two types of ULs. The fly ash of the two ULCFB units has significantly higher values of OC/EC in PM2.5 and PM10, with average ratios of 4.75 and 3.05, respectively.
Figure 4.
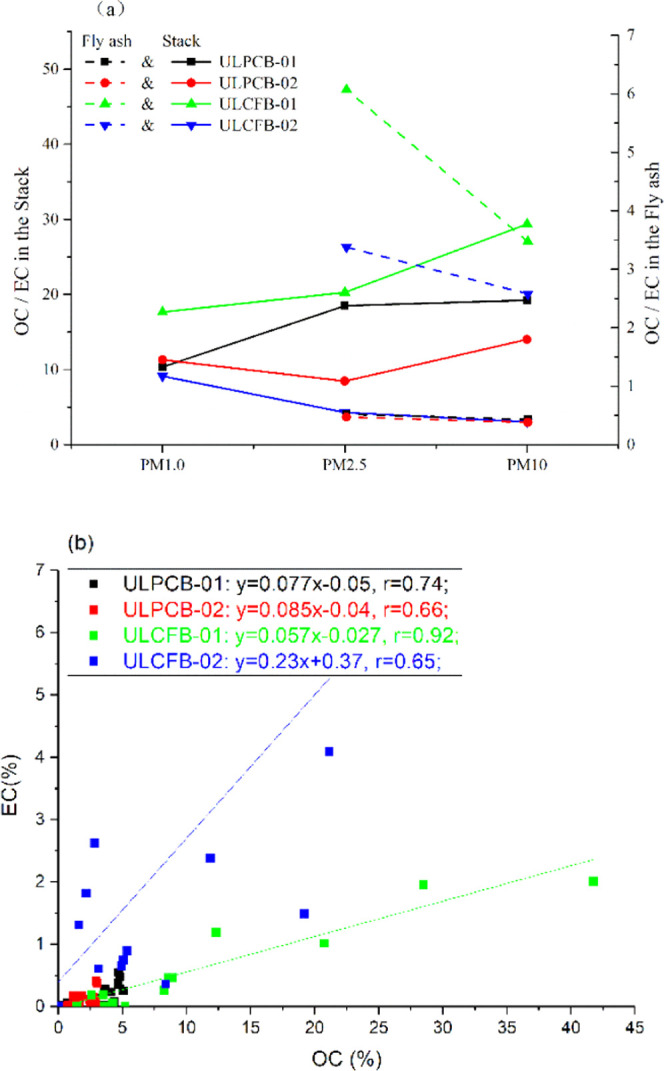
OC/EC in PM1.0, PM2.5, and PM10 and Pearson’s correlation. (a) OC/EC in the dust removers and stacks. (b) Pearson’s r between OC and EC.
The mean OC/EC of power plants with ultralow emission was 3–4 times than that of non-ultralow emission power plants, indicating that the ultralow emission technology is better in decreasing the EC content in fine particle matters. Meanwhile, this was also attributed to the large fraction of EC removed by dust removers. The correlations between OC% and EC% for UL units were calculated (Figure 4b), and the strong Pearson’s correlations ranging from 0.65 to 0.92 were obtained, indicating common affected factors for OC and EC.
3.4. Carbon Fractions of OC and EC
3.4.1. Char-EC and Soot-EC
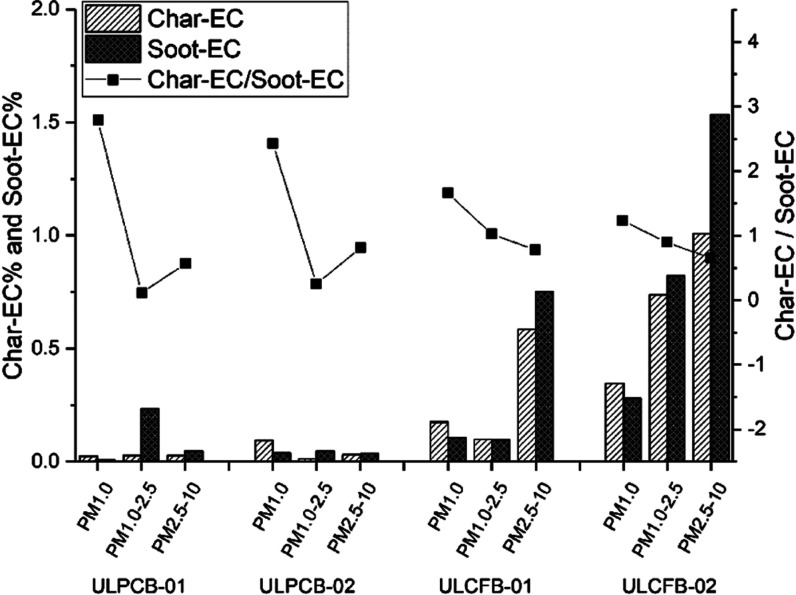
It has generally recognized that EC is formed by incomplete combustion via pyrolysis of hydrocarbons, including char-EC (defined as EC1-POC) and soot-EC (EC2 + EC3).16,17 The emission of char-EC is related to the solid residues during the combustion process, while the soot-EC is condensed from the high-temperature gas phase. Figure 5 shows the details of char-EC and soot-EC in particle fractions. The percentages of char-EC and soot-EC in two ULPCB units have a similar grade and were lower than 0.3% in the fractions of PM1.0, PM1.0–2.5, and PM2.5–10, whereas the char-EC and soot-EC of two ULCFB units significantly higher than those of ULPCBs. Furthermore, the ULCFB-02 with a relatively lower boiler load enriched char-EC and soot-EC in particle fractions than ULCFB-01, and the content of EC clearly increased with the particle diameter. The above results demonstrated that the combustion temperature was probably an important impacting factor for the content of EC in PMs. A small fraction of char-EC and soot-EC was expected to be present in the PMs under high temperature of PCB boilers, whereas a large fraction of char-EC and soot-EC was expected to be condensed in the CFB boilers. Meanwhile, the percentages of EC were not as high as expected in the fine PMs, and it seems that the coarse particulate matters easily enriched much more EC in ULCFBs, while these characteristics were not identified from ULPCBs, and the probable reason is that the size of fine particles was increasing with the condensing of pollutants.
Figure 5.
Char-EC/soot-EC of the four ultralow emission power plants.
The ratios of char-EC/soot-EC in the two types of UL units were studied (Figure 5). The ratios of char-EC/soot-EC were strongly impacted by the types of boiler and particle size, regardless of the temperature and the RH in the stack. The char-EC/soot-EC in particle fractions of ULPCBs characterized by the “V” type with the sequence of PM1.0 > PM2.5–10 > PM1.0–2.5, differing from the PM1.0 > PM1.0–2.5 > PM2.5–10 of ULCFBs. These characteristics probably attributed to the partitioning of EC between the gas and the particles; the coarse particles condensed much more soot-EC than the fine particles during the combustion process.
3.4.2. HTOC/Soot-EC
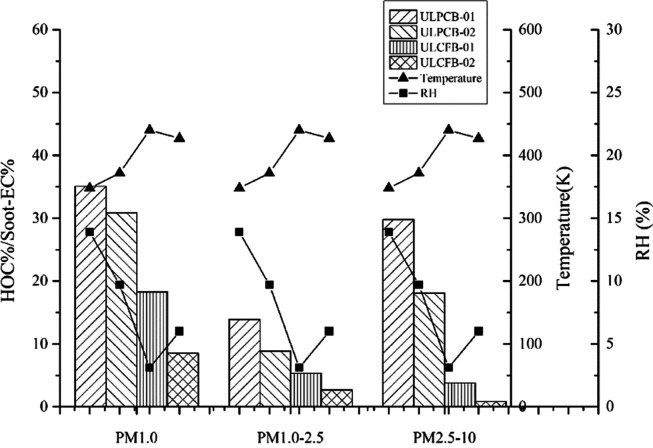
According to the principle of the thermal/optical carbon analyzer, OC1 is regarded as volatile organic carbon, while OC2, OC3, OC4, and POC are classified as high-temperature organic carbon. As the unstable components (OC1) and the controversial of the breakpoint between OC4 and EC1, the results of OC/EC vary with the sampling method, temperature protocols, and analyzing instruments.18,19 Therefore, this article discussed the ratio of high-temperature organic carbon (HTOC, defined as OC2 + OC3) and soot-EC, which are not impacted too much by the sampling method and the analyzer.
Figure 6 shows the ratios of HTOC/soot-EC in the particle fractions of two types of ULs. The high temperature of the boilers usually releases more OC from swelling coal particles and enhance combustion efficiency. On the other hand, the condensing of soot-EC to particle matters will be constrained under high temperatures. The results of the present study were not as we expected, and ULPCBs have the highest ratios of HTOC/soot-EC in PM1.0, PM1.0–2.5, and PM2.5–10 than ULCFBs. However, it seems that the HTOC/soot-EC is related to the RH in the stack. The average RH in the stack of ULPCBs (11.8%) is higher than that in ULCFBs (4.55%), and the mean HTOC/soot-EC of ULPCBs was 33.0% (PM1.0), 11.4% (PM1.0–2.5), 23.9% (PM2.5–10) at 360 K, while the average ratios were only 13.4% (PM1.0), 4.01% (PM1.0–2.5), 2.31% (PM2.5–10) for ULCFBs at 433.5 K. The probable reason is that the content of OC in PMs mainly depends on the temperature and RH of the purification equipment and not on the temperature of the combustion process. The high temperature of boilers benefits from releasing a large fraction of organic compounds from swelling coal particles. However, the residues of the OC content in the flue gas were condensed to the particulate matters under a relatively lower temperature in SCR/SNCR, ESP/BFs, WFGD, and WESPs.
Figure 6.
OC1/OC and HTOC%/char-EC% of the four ultralow emission power plants.
This could be supported by strong correlations between HOCT and soot-EC, ranging from 0.73 to 0.85 (p < 0.001) for the two ULPCB units and 0.69 to 0.78 (p < 0.001) for the two ULCFB units. The strong correlations indicated that the fraction of HTOC has a similar formation source with soot-EC in the ULs, probably linked to the condensing process. The partitioning of organic compounds between the gas and the particle phase in the power plant is not well understood, and the competition between combustion and adsorption of organic compounds may be the more important factors and they must also be considered in the future.
4. Conclusions
This study focuses on the emission characteristics of carbonaceous components from two types of ULs, including two ULPCBs and two ULCFBs. The particles were collected from the dust removers and stacks by the resuspension chamber and ELPI+, respectively. The temperature-determined carbonaceous species PM1.0, PM2.5, and PM10 were analyzed. The emission characteristics of carbonaceous for two types of ULs were compared to each other and the previous studies.
The mass concentration of particulate matters of ULs is greatly lower than that of NULs, significantly lower than 10 mg/m3. Ultralow emission technologies cannot effectively decrease the number concentrations of the particles, and the number concentration for ULs ranging from 1.06 ×10⁵ to 3.69 ×10⁵ (dN/d log Dp) is close to that of NULs. The size distributions of OC and EC were characterized by bimodal distributions for ULPCBs and successive unimodal distributions for ULCFBs. The mean OC/EC of the four ULs were 12.0 for PM1.0, 12.9 for PM2.5, and 16.5 for PM10. In addition, the OC/EC ratio in PM2.5 of ULs was much higher than those of NULPSBs (3.8) and NULCFBs (4.2). The percentages of char-EC and soot-EC in two ULPCB units were significantly lower than those of two ULCFB units, and the values of ULPCBs were lower than 0.3% in particle fractions of PM1.0, PM1.0–2.5, and PM2.5–10. Furthermore, the mean HTOC/soot-EC of ULPCBs was 33.0% (PM1.0), 11.4% (PM1.0–2.5), 23.9% (PM2.5–10) at the condition of 11.8% RH and 360 K, and these were much higher than that of ULCFBs (11.8% RH and 433.5 K). The high-temperature organic carbon (HTOC) and soot-EC have similar condensation processes, and significant correlations (0.69–0.85, p < 0.001) were obtained between them.
Acknowledgments
This work was supported by the Tianjin Science and Technology Program (18ZXSZSF00160), the National Key Research and Development Program of China (2016YFC0208500), and the National Natural Science Foundation of China (21207069).
The authors declare no competing financial interest.
References
- Engelhart G. J.; Moore R. H.; Nenes A.; Pandis S. N. Cloud condensation nuclei activity of isoprene secondary organic aerosol. J. Geophys. Res. 2011, 116, D02207 10.1029/2010JD014706. [DOI] [Google Scholar]
- Zhao S.; Duan Y.; Tan H.; Liu M.; Wang X.; Wu L.; Wang C.; Lv J.; Yao T.; She M.; Tang H. Migration and emission characteristics of trace elements in a 660 Mw coal-fired power plant of China. Energy Fuels 2016, 30, 5937–5944. 10.1021/acs.energyfuels.6b00450. [DOI] [Google Scholar]
- Tian Y.; Chen G.; Wang H.; Huang Y.; Shi G.; Han B.; Feng Y. Source regional contributions to PM2.5 in a megacity in China using an advanced source regional apportionment method. Chemosphere. 2016, 147, 256–263. 10.1016/j.chemosphere.2015.12.132. [DOI] [PubMed] [Google Scholar]
- Ma X.; Wu J.; Zhang Y.; Bi X.; Sun Y.; Feng Y. Size-classified variations in carbonaceous aerosols from real coal-fired boilers. Energy Fuels 2016, 30, 39–46. 10.1021/acs.energyfuels.5b01770. [DOI] [Google Scholar]
- Latva-Somppi J.; Moisio M.; Kauppinen E. I.; Valmari T.; Ahonen P.; Tapper U.; Keskinen J. Ash formation during fluidized-bed incineration of paper mill waste sludge. J. Aerosol Sci. 1998, 29, 461–480. 10.1016/S0021-8502(97)00291-7. [DOI] [Google Scholar]
- Masto R. E.; Sarkar E.; George J.; Jyoti K.; Dutta P.; Ram L. C. PAHs and potentially toxic elements in the fly ash and bed ash of biomass fired power plants. Fuel Process. Technol. 2015, 132, 139–152. 10.1016/j.fuproc.2014.12.036. [DOI] [Google Scholar]
- Chow J. C.; Watson J. G.; Crow D.; Lowenthal D. H.; Merrifield T. Comparison of IMPROVE and NIOSH carbon measurements. Aerosol Sci. Technol. 2001, 34, 23–34. 10.1080/02786820119073. [DOI] [Google Scholar]
- Watson J. G.; Chow J. C.; Lowenthal D. H.; Robinson N. F.; Cahill C. F.; Blumenthal D. L. Simulating changes in source profiles from coal-fired power stations: Use in chemical mass balance of PM2. 5 in the Mount Zirkel Wilderness. Energy Fuels 2002, 16, 311–324. 10.1021/ef010202w. [DOI] [Google Scholar]
- Lei Z.; Hongguang Z. Particle removal efficiency analysis of WESP in an ultra low emission coal-fired power plant. Proc. CSEE. 2016, 36, 458–473. [Google Scholar]
- Ke Z.; Jianping N.; Guangcai Z.; Dunxi Y.; Minghou X. Emission characteristics of particulate matter from coal-fired plant equipped with WFGD. Therm. Power Gener. 2013, 42, 81–85. [Google Scholar]
- Hu Y.; Wu X.; Wang C.; Liang Y.; Ma Z. Testing of concentration and characteristics of particulate matters emitted from stationary combustion sources in Beijing. Environ. Sci. 2016, 37, 1653. [PubMed] [Google Scholar]
- Whitby K. T. California aerosols: Their physical and chemical characteristics. Adv. Environ. Sci. Technol. 1980, 9, 477–525. [Google Scholar]
- Wu X.; Zhao H.; Zhang Y.; Zheng C.; Gao X. Measurement of slurry droplets in coal-fired flue gas after WFGD. Environ. Geochem. Health 2015, 37, 915–929. 10.1007/s10653-014-9648-x. [DOI] [PubMed] [Google Scholar]
- Yu S.; Dennis R. L.; Bhave P. V.; Eder B. K. Primary and secondary organic aerosols over the United States: estimates on the basis of observed organic carbon (OC) and elemental carbon (EC), and air quality modeled primary OC/EC ratios. Atmos. Environ. 2004, 38, 5257–5268. 10.1016/j.atmosenv.2004.02.064. [DOI] [Google Scholar]
- Hsu W. T.; Liu M. C.; Hung P. C.; Chang S. H.; Chang M. B. PAH emissions from coal combustion and waste incineration. J. Hazard. Mater. 2016, 318, 32–40. 10.1016/j.jhazmat.2016.06.038. [DOI] [PubMed] [Google Scholar]
- Han Y.; Cao J.; Lee S.; Ho K.; An Z. Different characteristics of char and soot in the atmosphere and their ratio as an indicator for source identification in Xi’an, China. Atmos. Chem. Phys. 2010, 10, 595–607. 10.5194/acp-10-595-2010. [DOI] [Google Scholar]
- Han Y.; Lee S.; Cao J.; Ho K.; An Z. Spatial distribution and seasonal variation of char-EC and soot-EC in the atmosphere over China. Atmos. Environ. 2009, 43, 6066–6073. 10.1016/j.atmosenv.2009.08.018. [DOI] [Google Scholar]
- Karanasiou A.; Minguillón M. C.; Viana M.; Alastuey A.; Putaud J. P.; Maenhaut W.; Panteliadis P.; Močnik G.; Favez O.; Kuhlbusch T. A. Thermal-optical analysis for the measurement of elemental carbon (EC) and organic carbon (OC) in ambient air a literature review. Atmos. Meas. Tech. Discuss. 2015, 8, 9649–9712. 10.5194/amtd-8-9649-2015. [DOI] [Google Scholar]
- Chow J. C.; Watson J. G.; Pritchett L. C.; Pierson W. R.; Frazier C. A.; Purcell R. G. The dri thermal/optical reflectance carbon analysis system: description, evaluation and applications in U.S. Air quality studies. Atmos. Environ., Part A 1993, 27, 1185–1201. 10.1016/0960-1686(93)90245-T. [DOI] [Google Scholar]


