Abstract
Localization based microscopy using self-interference digital holography (SIDH) provides three-dimensional (3D) positional information about point sources with nanometer scale precision. To understand the performance limits of SIDH, here we calculate the theoretical limit to localization precision for SIDH when designed with two different configurations. One configuration creates the hologram using a plane wave and a spherical wave while the second configuration creates the hologram using two spherical waves. We further compare the calculated precision bounds to the 3D single molecule localization precision from different Point Spread Functions. SIDH results in almost constant localization precision in all three dimensions for a 20 µm thick depth of field. For high signal-to-background ratio (SBR), SIDH on average achieves better localization precision. For lower SBR values, the large size of the hologram on the detector becomes a problem, and PSF models perform better.
1. Introduction
In widefield fluorescence microscopy, each image captured by the camera captures a two-dimensional slice of the object in-focus. To acquire a three-dimensional image, 2D images must be acquired as the focal plane is moved through the sample. With holography, a two-dimensional image of the complex field is captured. Because both the amplitude and phase of the field are recorded, an image can be generated re-focused to any axial position in the sample. This allows for rapid volumetric imaging [1].
But traditional holography requires coherent light and is not compatible with fluorescence. In Self-Interference Digital Holography (SIDH), the light from the sample is interfered with itself rather than a reference beam so that coherence is no longer required [2]. SIDH enables imaging of incoherently emitting objects over large axial ranges without refocusing and can provide unique properties such as infinite depth of field [3,4], violation of the Lagrange invariant [5,6] and edge enhancement with a vortex filter [7]. SIDH works by dividing the incoherent light emitted from the sample into two beams that are separately phase-modulated and recombined in a common plane to produce interference fringes. The axial position of the object is encoded in the density of the interference fringes. Three images are collected with the phase of one path shifted for each hologram. The three images are then combined to create the final hologram, eliminating both the bias image and the holographic "twin image." SIDH can be used for a variety of imaging applications including particle tracking [8,9] and high resolution fluorescence imaging of biological samples [10].
In modern fluorescence microscopy, single particle tracking (SPT) and single molecule localization microscopy (SMLM) have become essential tools for imaging and tracking particles at resolutions exceeding the diffraction limit, sometimes by over an order of magnitude [11–13]. In SPT and SMLM, the point spread functions (PSFs) of individual fluorophores are imaged and localized. By fitting the PSF to a model function, the center of the PSF can be determined with much greater accuracy than the diffraction limit. In SMLM, single molecules emitting a few thousand photons are imaged; in SPT, the emitters can also be fluorescent microspheres emitting tens of thousands of photons [14]. For 3D SPT or SMLM, it is necessary to extract the positional information of the single emitter with high precision in all three dimensions. Unfortunately, the recorded two-dimensional PSF of a standard fluorescence microscope does not change rapidly with defocus and therefore does not provide sufficient information about the axial position of the emitter. To address this issue, a variety of techniques have been developed over the past decade to facilitate unambiguous 3D localization of single emitters with high precision. One approach is to modify the microscope to make multiple simultaneous measurements of the 3D PSF at different focal planes [15–17]. Another idea is to extract the axial position of the emitter using other properties such as the intensity gradient of the excitation field [18], the near-field coupling of the emission to the coverslip [19,20] or the phase information of the emitted light [21]. PSF engineering relies on altering the PSF of the microscope to encode the axial position of an emitter in its shape. The most widely used PSF engineering technique uses a cylindrical lens to impart astigmatism to the system, producing an elliptical PSF that encodes the axial position of the emitter [22]. Other designs include, the rotating double-helix PSF [23], the corkscrew PSF [24], the phase ramp PSF [25], the self-bending PSF [26] and the saddle-point and tetrapod PSFs [27,28]. All these engineered PSFs have distinct features that change rapidly with defocus thus encoding the axial position of the emitter.
The ability of any particular method to determine the position of a single emitter can be determined by calculating the Cramér-Rao lower bound (CRLB) from the Fisher information matrix [29–31]. This calculation yields the theoretically best precision that can be achieved for a given estimator and has been performed for most of the SML techniques. The lower bound provides a limit with which the position of the emitter can be estimated. This quantity is useful because it (1) serves as a benchmark to which the precision provided by a particular estimator can be compared, thus indicating how much room there might be for improvement and (2) by calculating the quantity for a particular estimator under different experimental conditions, the lower bound helps in designing experiments where various parameters of the optical setup can be varied to achieve the desired level of precision. Calculation of the CRLB requires computation of the Fisher information matrix which provides a measure of the amount of information the data contains about the parameters being estimated. The precision with which a parameter can be estimated is directly proportional to the amount of information the collected data contains about the parameter. The amount of information in the data is determined by considering how the likelihood of obtaining a set of measurements in the presence of noise changes with the value of the parameter of interest. If the parameter of interest is the position of the emitter and the data collected is the response of the optical system, the Fisher information matrix calculates how the likelihood of the acquired data varies with changes in the position of the emitter. If the likelihood of the acquired data is very sensitive to changes in the position of the emitter, then the data contains a relatively large amount of information about the position and can be estimated with relatively high precision. The CRLB of a certain parameter (e.g., position) is obtained from the inverse of the Fisher information matrix, thus confirming the expectation that a large amount of information about the parameter should result in a smaller bound on the variance with which the parameter can be estimated [32]. The CRLB has been calculated for many different PSF models to determine the precision with which a single emitter can be localized [32–38]. Saddle point and tetrapod PSFs were developed by optimizing the Fisher information matrix in an engineered PSF over a certain axial range, thereby generating a PSF that contains the maximum amount of information with regard to the position of the emitter.
An attractive feature of SIDH is that the hologram is converted into an image at a particular z-plane using a mathematically well-defined kernel. The image of a point source is then approximately Gaussian in shape with width and can be localized using standard single molecule localization (SML) algorithms. In contrast to some of the engineered PSFs, the PSF will not be larger, increasing the likelihood of overlapping PSFs. And, because the PSF can be re-focused, it can be localized in the axial direction as well. Recently, we investigated single particle localization of fluorescent beads using SIDH [39]. We demonstrated that holograms can be reconstructed into images with good SNR with as few as 15,000 photons. We demonstrated localization with precision of 5 nm laterally and 40 nm axially from 50,000 photons.
The CRLB has not yet been calculated for SIDH, and understanding the CRLB will be useful to researchers further developing holographic approaches to SPT and SMLM. Here we ask whether SIDH can provide high localization precision over a large axial range and compare the performance of SIDH to PSF-based localization. We use the Fisher information matrix to calculate the best-case localization precision using SIDH for a 20 m axial range. We compare our results to different PSF models used in SPT and SMLM. We show that SIDH compares favorably in the case of low-background noise but suffers due to the large hologram size when background noise becomes appreciable.
2. Methods
In this section we first provide a theoretical analysis of SIDH. We then introduce the concept of Fisher information and the Cramér-Rao lower bound (CRLB) and describe our CRLB calculations for SIDH.
2.1. Theoretical analysis of SIDH
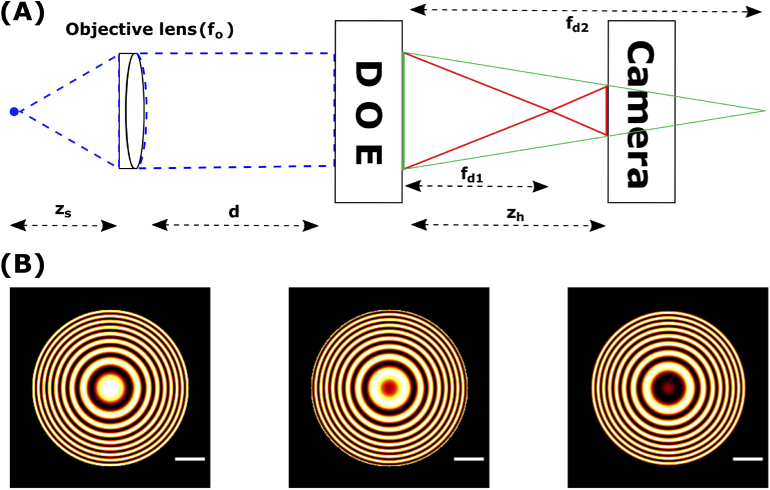
Following the convention in [2], and referring to the generalized diagram in Fig. 1, we consider a point source at ( in front of the objective lens with focal length . After light from the point source propagates through the objective lens to the diffractive optical element (DOE), it gets focused by the DOE displaying the phase components of two quadratic phase functions with focal lengths and . After further propagating a distance of to the camera, the complex amplitude at the camera is given by
| (1) |
where , , is a complex constant related to the complex amplitude of the point source, denotes a 2D convolution [40], is the distance between the objective lens and the DOE, and are constants that control the contribution of each lens to the hologram, is a constant phase term applied to the DOE to eliminate the bias term and the twin image, and is the distance between the DOE and the camera. After squaring and evaluating the complex amplitude given by Eq. (1), the intensity of the recorded hologram of a point source can be calculated and is given by
| (2) |
where is a constant, is the wavelength of the emitted light, is the reconstruction distance from the hologram plane, and is the transverse magnification of the system. Besides the constant term, Eq. (2) contains two terms that describe the correlation between the object and the z-dependent quadratic phase function. The constant term is the bias term and the third term is called the twin image. Both these terms need to be eliminated to reconstruct a clear image from the recorded hologram. Three holograms with phase shifts , , are recorded, which are then algebraically combined to form a final complex hologram that takes the form
| (3) |
Fig. 1.
Configuration for SIDH. (A) Detection path for imaging using SIDH. SIDH creates holograms by a single-channel on axis incoherent interferometer process. (B) Simulated images of holograms of a single-emitter recorded using SIDH. We refer to these as the point spread holograms (PSH). Three holograms with different phases (, and ) are required to reconstruct the final image. All scale bars are 5 m.
The final complex hologram can be numerically back-propagated to produce a reconstructed 3D image of the sample.
| (4) |
where , which is a function of , is the distance of the emitter from the objective focal plane.
2.2. Calculating the CRLB for the SIDH imaging model
The CRLB is the limiting lower bound of the variance for any unbiased estimator and is given by the inverse of the Fisher information matrix
| (5) |
where is the standard deviation of the estimator, is the Fisher information matrix and are the parameters being estimated. In this paper = []. The equal sign is the minimum value of the estimation and is referred to as the CRLB. The elements of the Fisher information matrix are given by [29,30]
| (6) |
where describes the imaging model. For a first calculation of the Cramér-Rao limits for lateral and axial precision for SIDH, we follow the approach in [33] and calculate the limits for a photon distribution given by the point spread hologram (PSH)
| (7) |
where , , and the normalization constant, , is given by
| (8) |
where is the radius of the hologram at the CCD plane and
| (9) |
Upon calculating the terms of the Fisher information matrix using Eqs. (5) & (6) we find that (see the appendix, Sec. 7.1, for the derivation)
| (10) |
and
| (11) |
In the equation for above, we have simplified the derivation by ignoring the dependence of the constant and the PSH radius . Because the radial fringes change more rapidly with the axial position than the PSH radius, we believe this is a valid approximation.
2.3. Calculating the CRLB for PSF imaging models
We also calculate the CRLB for the PSF model from scalar diffraction theory, the Cropped Oblique Secondary Astigmatism (COSA) PSF [14], and Gaussian and Astigmatic Gaussian approximations to the PSF. The scalar PSF and COSA PSF are based on Fourier Optics theory. The COSA PSF is similar to the tetrapod PSF and provides high axial localization precision over an adjustable axial range. The Gaussian PSFs are approximations to the “true” PSF that can be calculated quickly and are frequently used in SPT and SMLM to localize the PSF [33]. For all these calculations we use a Numerical Aperture (NA) of 1.4, an emission wavelength of 670 nm, and a refractive index of 1.515. For the numerical simulation of the Gaussian PSF, we have matched our simulations to the cases previously discussed [33]. The focal depth for a high-NA imaging system is given by [41] and the spot size /(4NA) 122 nm (at = 0). For simulating the astigmatic PSF, the amount of astigmatism introduced in the system was assumed to be = 400 nm. The focal depth and the spot size are the same as assumed in the Gaussian case. The three imaging setups have been designed to have the same overall magnification equal to = 50. For the COSA PSF, the adjustable parameter, , is set to 11.46 which corresponds to a 15m axial range for our parameters. Details of these calculations can be found in the appendix, Secs. 7.2 - 7.4.
2.4. Effects of background noise
The calculated fundamental limits of localization precision assume the best case scenario for the acquisition system. These expressions derived above present the best possible localization precision in the absence of deteriorating factors such as background noise. The elements of the Fisher information matrix in the case where the PSF is corrupted by noise were calculated analogously to the ideal case and are given by
| (12) |
where is the background signal (photons/) corrupting the PSF/PSH in each of the cases. Since the integral in Eq. (12) cannot be calculated analytically, it was calculated numerically using custom written MATLAB code [42].
3. Results and discussion
3.1. Configuration 1: SIDH with one plane wave and one spherical wave
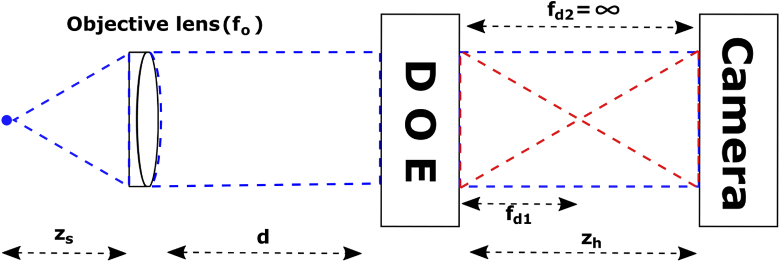
We first review the simplest case in SIDH, where the hologram is formed as a result of the interference between one spherical wave and one plane wave. Referring to Fig. 2, is responsible for the spherical wave and the plane wave is created when . In this case the reconstruction distance () and the transverse magnification () are given by
| (13) |
and
| (14) |
where
The signs in Eq. (13) show that the images can be reconstructed from either the real or the virtual image, depending on which is isolated using the phase-shifting process as described in Eq. (3). The radius of the hologram at the CCD plane calculated using an ABCD ray transfer matrix framework is described in [43] for this analysis. The radii of the plane and spherical wave, for the optical system described by Fig. 2 at the CCD plane are given by
| (15) |
and
| (16) |
where and are the radii of the plane and spherical waves at the CCD plane and and are the maximum angles at which the rays from the plane and spherical waves meet the CCD. is the distance from the optical axis at which the ray enters the system and is the maximum angle at which the rays enters the system. Since the radius of the hologram is limited by the area of overlap between the radius of the plane and spherical waves the radius of the hologram () can be defined as
Fig. 2.
Configuration 1 for SIDH. The interferogram formed at the camera is a result of a plane wave ( = ) and a spherical wave ().
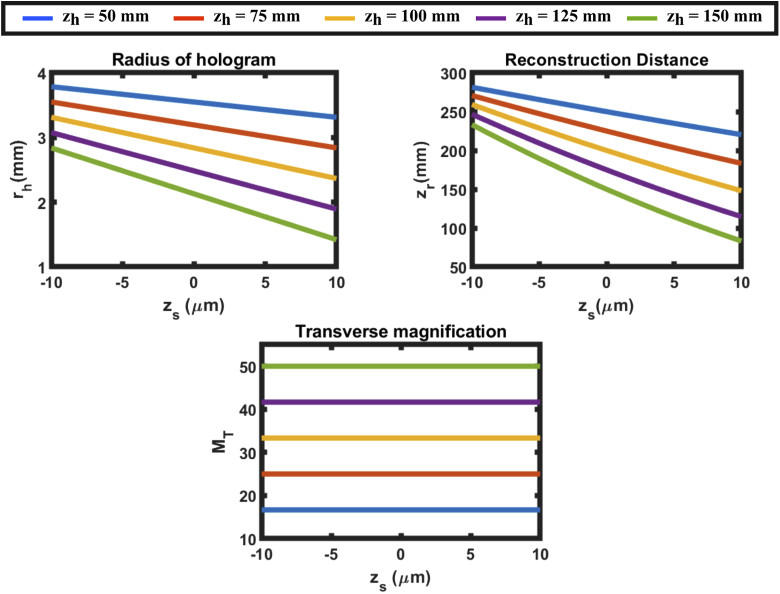
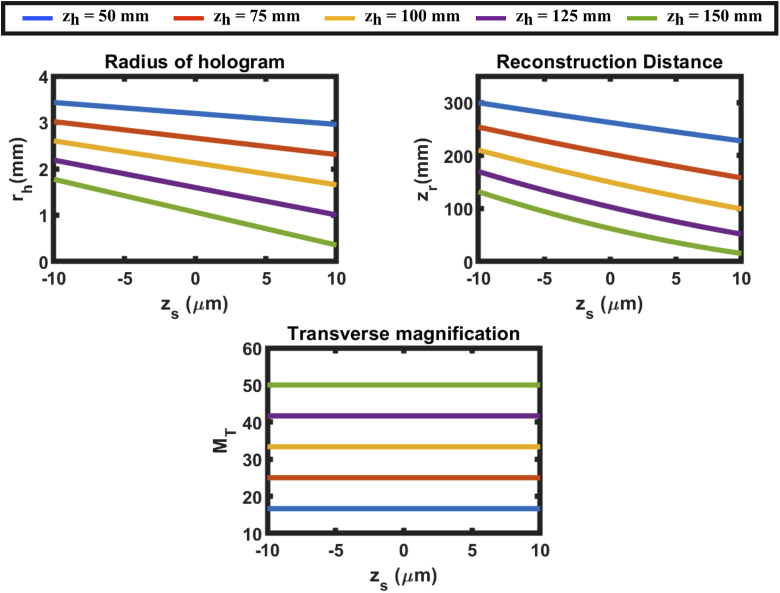
Using Eqs. (13)–(16) we calculate various parameters of an SIDH system such as the radius of the hologram (), transverse magnification of the system () and the reconstruction distance () for different DOE-CCD distances ()(shown in Fig. 3). In order to simulate the SIDH system, a 60x, 1.42 numerical aperture (NA) objective is assumed ( = 3 mm), imaging into an index of 1.515. The wavelength of light is 670 nm. The distance between the objective lens and the DOE is = 3 mm, the focal length of the quadratic phase pattern is = 300 mm and = . The CRLB for SIDH was calculated for = 150 mm. When the camera is placed at 150 mm, the hologram comes to focus within the 20 m axial range thereby reducing the achievable axial range.
Fig. 3.
Hologram radius (), reconstruction distance () and transverse magnification () of configuration 1 when the CCD is placed at different distances away from the DOE.
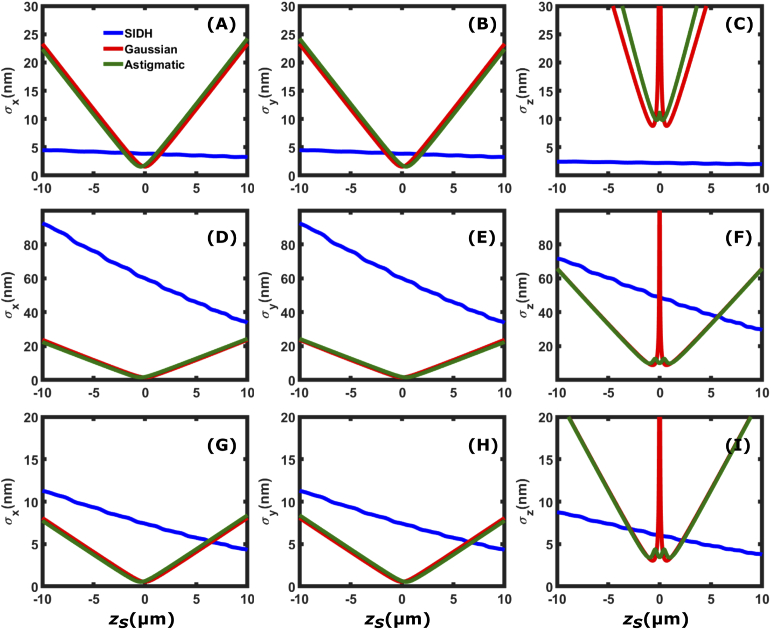
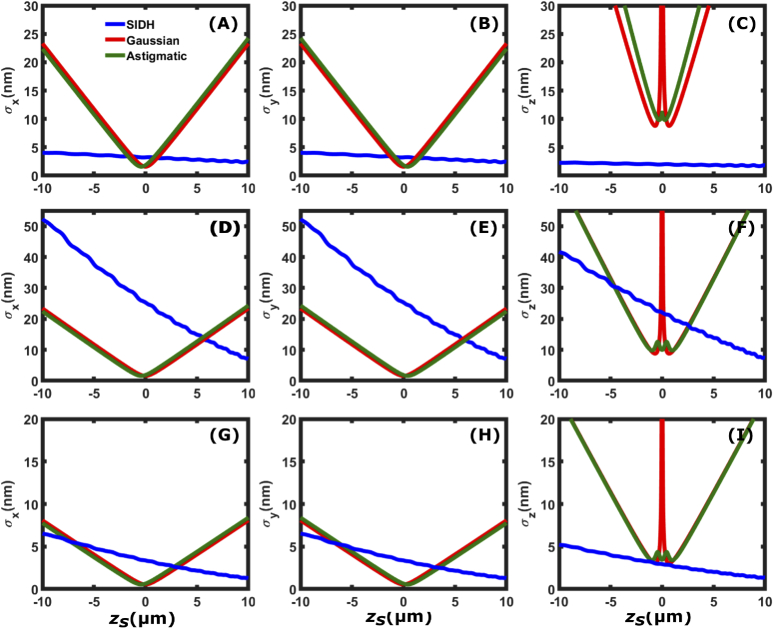
Figure 4 compares , , and localization precision of SIDH with the Gaussian PSF and the astigmatic PSF as a function of the axial position with respect to focus. The first row of the figure [(A)-(C)] corresponds to =6000 photons in the absence of background noise ( = 0 photons/), the second row [(D)-(F)] shows the localization precision for typical single molecule imaging when =6000 photons in the presence of background noise = 60,000 photons/ ( 10 photons/pixel) in the image space and the third row [(G)-(I)] shows the localization precision, typical for imaging a fluorescent bead, when =50,000 photons in the presence of background noise = 60,000 photons/ ( 10 photons/pixel) in the image space. In the absence of noise, SIDH provides 20 nm precision and has more uniform localization precision than the other two PSF models in all three dimensions throughout the entire 20 m depth of field. This is a direct result of the constant spatial variation rate in all three dimensions, which makes it more suitable for 3D localization based microscopy. In the low SBR case (=6000, =10 photons/pixel in Fig. 4(F)), SIDH does not perform as well as the Gaussian and the astigmatic PSF over the 20 m range, thus making SIDH less suitable for 3D imaging at low SBR conditions. In the case of high SBR (=50,000, = 10 photons/pixel in Fig. 4(I)), the axial localization precision provided by SIDH outperforms the astigmatic and the Gaussian PSF when imaging away from focus thus making it suitable for single particle tracking applications.
Fig. 4.
Comparison of the [(A), (D) and (G)], [(B), (E) and (H)], and [(C), (F) and (I)] localization precision among SIDH with configuration 1, the astigmatic PSF, and the Gaussian PSF. The first row [(A)-(C)] shows the localization precisions when the single emitter is emitting =6000 photons in the absence of background ( = 0 photons/), (D)-(F) when =6000 photons and = 60,000 photons/ ( 10 photons/pixel) and (G)-(I) when =50,000 photons and = 60,000 photons/.
3.2. Configuration 2: SIDH with two spherical waves
SIDH has also been performed using two spherical waves with different focal lengths and to create the interferogram [44]. This configuration shown in Fig. 5, offers the possibility of placing the camera closer to the DOE allowing greater light efficiency without adversely affecting the resolution in the reconstructed image. When SIDH is performed with this configuration, the reconstruction distance () is given by
| (17) |
where
Fig. 5.
Configuration 2 for SIDH. The interferogram formed at the camera is a result of two spherical waves ( and ).
The transverse magnification () for SIDH with two spherical waves is the same as that with one spherical and plane wave as described previously in Eq. (14). The ABCD ray transfer matrices for the system shown in Fig. 5 are given by
| (18) |
and
| (19) |
where and are the radii of the spherical waves formed due to the two focal lengths and at the CCD plane. The radius of the hologram () is this configuration is defined by the area of overlap between the two spherical waves at the CCD plane as is similarly given by
Although this configuration allows the camera to be placed nearer to the CCD, in order to image across the entire axial range ( 20 m) it is necessary to place it not in the range 200 to 400 mm ( to ) to ensure that the values of the reconstruction distance () are not symmetric across the focal plane (Fig. 6) Therefore, simulations for calculating the CRLB for SIDH using the configuration shown in Fig. 5 were performed by placing the camera at 150 mm.
Fig. 6.
Hologram radius (), reconstruction distance () and transverse magnification () of configuration 2 when the CCD is placed at different distances away from the DOE.
The simulations to calculate the CRLB using this configuration are the same as those described in the previous section. the focal lengths of the quadratic phase patterns are = 200 mm and = 400 mm. Figure 7 compares , , and localization precision of SIDH using the second configuration with the Gaussian PSF and the astigmatic PSF as a function of the axial position with respect to focus. The top row (Fig. 7 [(A)-(C)]) shows the CRLB comparisons for =6000 photons in the absence for background noise, the middle row (Fig. 7 [(D)-(F)]) shows the CRLB comparisons for =6000 photons in the presence of background noise = 60,000 photons/ ( 10 photons/pixel) and the third row (Fig. 7 [(G)-(I)]) shows the CRLB comparisons for =50,000 photons in the presence of background noise = 60,000 photons/.
Fig. 7.
Comparison of the [(A), (D) and (G)], [(B), (E) and (H)], and [(C), (F) and (I)] localization precision among SIDH with configuration 2, the astigmatic PSF, and the Gaussian PSF. The first row [(A)-(C)] shows the localization precisions when the single emitter is emitting =6000 photons in the absence of background ( = 0 photons/), (D)-(F) when =6000 photons and = 10 photons/pixel and (G)-(I) when =50000 photons and = 10 photons/pixel.
The precision bounds for SIDH using this configuration are similar to the first configuration (with one plane wave and one spherical wave), however in the high SBR case, Fig. 7(I), this configuration provides better axial localization precision than the astigmatic and the Gaussian PSF over the entire axial range. In general it can be seen from Fig. 7 that SIDH with configuration 2 performs better than SIDH with configuration 1. This can be attributed to the smaller hologram size throughout the axial range in configuration 2 which can be seen in Figs. 3 and 6. Since the number of photons contained in each of the holograms is the same, the larger size of the hologram in configuration 1 leads to more background noise in the hologram thereby degrading the localization precision.
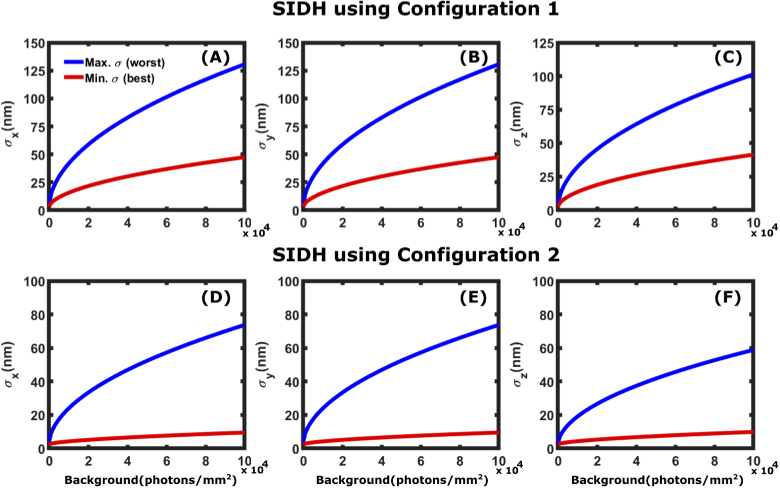
In Fig. 8, we calculate the CRLB for SIDH using configurations 1 and 2 as a function of background (up to 20 photons/pixel). For each configuration, we plot the best and worst precision over the range. We plot the maximum CRLB value with increasing background photon values up to = photons/ ( 20 photons/pixel). Figure 8 shows that while SIDH is successful at providing nm-scale precision across large axial ranges, the technique is highly sensitive to noise. As shown in Fig. 4(D-F), the SIDH CRLB has a negative slope with respect to the axial position. This is due to the change in the size of the hologram as one moves across the entire axial range. The shape of the hologram is largest when the emitter is -10 m away from the focal plane. Therefore the worst precision occurs at -10m, and the best occurs at +10m.
Fig. 8.
Effect of background noise on CRLB: Maximum (worst) and minimum (best) localization precision for SIDH using configuration 1 [(A)-(C)] and configuration 2 [(D)-(F)] for a particle emitting = 6000 photons in the presence of background noise = 0 - photons/ ( 0-20 photons/pixel). The CRLB plots shown in the figures are when the particle is at = -10 m (blue plot) and = +10 m (red plot). These are the highest (worst) and lowest (best) values of precision across the entire axial range due to size of the hologram being the largest and smallest at these points.
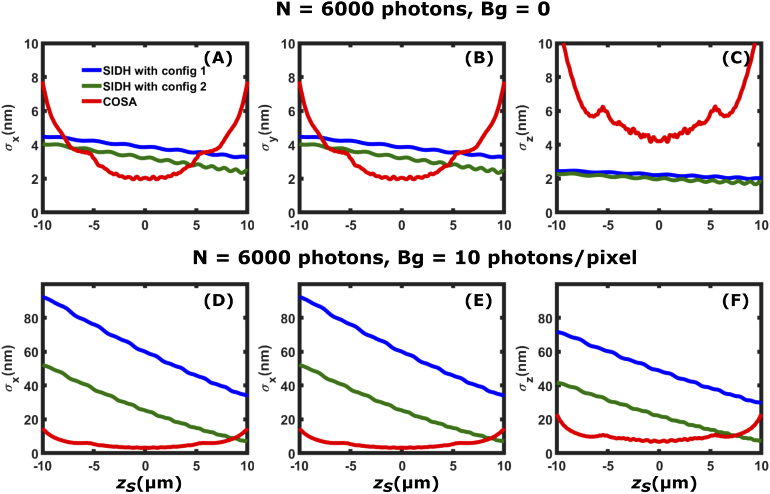
Finally, we compare the localization precision of SIDH to the COSA PSF. The COSA PSF provides close to optimal precision over a given axial range. In Fig. 9 we show comparisons for the case of no background and for the case of a background of 60,000 photons/ ( 10 photons / pixel) in the image plane. Again, we see that SIDH compares favorably in the case of no background, but does not perform as well with background.
Fig. 9.
Comparison of the [(A) and (D)], [(B) and (E)], and [(C) and (F)] localization precision between SIDH with configurations 1 (blue plot), 2 (green plot) and the COSA PSF (red plot). The first row [(A)-(C)] shows the localization precision when the single emitter is emitting =6000 photons in the absence of background ( = 0 photons/) and (D)-(F) when =6000 photons and = 60,000 photons/.
4. Localization of SIDH data
In this section we compare both simulated and measured localization data to the CRLB. We first perform single molecule fitting of simulated incoherent holograms produced by a single particle emitting = 6000 photons over three images in the presence of background noise = 1000 photons/. We measure the precision of the localization by performing the localization 50 times for each axial position and comparing the standard deviation of the measurements to the CRLB values calculated above for configuration 1. The synthetic data was produced using the equations described in section 2.1 and the fitting of the reconstructed images was performed using custom written Python code described in [39] although here we localize in the z coordinate by finding the maximum intensity along the z direction rather than the minimum spot width.
Figure 10 shows that our code for fitting the data is close to the CRLB in the lateral dimensions (-). In the axial dimension (), the measured standard deviations are roughly twice the calculated CRLB values. The spatial (x-y) localized coordinates are found by fitting a 2D Gaussian function to the images formed by reconstructing the holograms. Since the algorithm used to find the spatial coordinates converges to the maximum likelihood estimate (MLE) of the position, they reach the CRLB [32], however the reported axial (z) localized coordinates are found by fitting a curve to the intensity values in the axial direction and finding the maximum intensity value. We speculate that this is the reason the reported axial localization precision does not reach the CRLB and that if we fit the data to an imaging model to determine the axial PSF, the observed axial localization precision would reach the CRLB.
Fig. 10.
Simultaneous fits to , intensity and background for simulated data. Shown are the reported , and values from 50 measurements of the simulated data. The calculated CRLB values are shown in solid blue lines and circles whereas the standard deviations from the simulations are labeled as red diamonds. The simulated dataset was created assuming a single particle emitting = 6000 photons in the presence of background noise of = 1000 photons/.
An analysis of experimental bead data is shown in Fig. 11. A single 0.2 m dark red (660/680) fluorescent microsphere (Invitrogen) was pumped with a 647 nm laser (Coherent) with an irradiance of 1.2 kW/ and each hologram was acquired in one 30-ms frame. The calibrated EM gain setting was 500 and an average of 60,000 photons were detected per estimation (each consisting of 3 images). The average background noise was measured to be = 10000 photons/ ( 2 photons/pixel). 100 frames were collected at five different -positions and the images resulting from the reconstructions of the holograms were fitted using our iterative algorithm which performed a simultaneous fit to , , and the emission and background rates. Once again we notice that the lateral position precisions ( and ) both come close to the CRLB value. In the axial () direction, the precision does not come close to the CRLB. This is attributed to the fact that our algorithm does not iteratively fit the data to a particular model. For the CRLB value to be reached, the imaging model to which the individual parameters are fit must be correct. We speculate that by fitting the -position to an imaging model that accounts for aberrations in the experimental images, the -position precision can also reach the CRLB.
Fig. 11.
Simultaneous fits to , intensity and background for experimental data. Shown are the reported , and values from 100 measurements of the experimental data obtained from localizing a single 0.2 m dark red (660/680) fluorescent microsphere (Invitrogen). The calculated CRLB values are shown in solid blue lines and circles whereas the standard deviations from localizing the experimental data are labeled as red diamonds. The fluorescent microsphere was measured to be emitting = 60000 photons in the presence of background noise of = 10000 photons/.
5. Conclusion
We have introduced a simple calculation for the fundamental limit to precision when using SIDH to perform localization based microscopy using the Fisher information matrix. The results introduced in this paper can be used to design SIDH systems to obtain a desired localization precision. Furthermore, these expressions can be used as a benchmark against which algorithms can be evaluated that are used to estimate the location of emitters. These results show that high precision localization in all three dimensions can be achieved over a 20 m axial range using SIDH with high SBR. We have neglected the effect of pixelation on the precision in our calculations because this does not relate directly to the effectiveness of SIDH as a localization technique, but including pixelation would be a next step in this work.
We also compare the localization precision of SIDH using two different configurations with localization precision from different PSF models including the astigmatic and the Gaussian PSF using parameters matched as closely as possible to their actual implementations. SIDH using both the configurations results in a small and almost constant localization precision over a large axial range of 20 m for lower SBR conditions. In the presence of higher background noise ( > 5000 photons/, = 6000 photons), SIDH continues to provide <50 nm precision in all three dimensions over the entire axial range. However, under such conditions, the astigmatic PSF provides better precision near the focal plane making it more suitable for imaging thinner samples (1 m thick). The high sensitivity to background noise in SIDH is primarily due to the large size of the hologram compared to a Gaussian or astigmatic PSF. Since the hologram is spread over 2-4 , for = 60000 photons/, the SBR for SIDH is significantly lower than the SBR for the astigmatic and the Gaussian PSF’s thereby degrading the precision of the system. Localization over a large axial range can also be achieved with the tetrapod PSF for which the CRLB is 60 nm over 20 microns with 3500 signal photons and 50 background photons per pixel [28]. With a background of 20 photons per pixel, SIDH achieves a precision of 125 nm. While the tetrapod PSF performs better than SIDH, understanding the performance of SIDH is of interest due to the analytical reconstruction process [39] and the ability to correct for optical aberrations in SIDH [45].
The results presented in this paper should be useful to investigators designing SIDH systems and algorithms for localization based imaging which could lead to SIDH approaches to localization based microscopy with superior performance.
6. Code availability
The software used in this study is available under an open-source (GPL-3.0) license under two packages:
7. Appendix
7.1. Derivation of Cramér-Rao lower bound for self-interference digital holography
Using Eq. (2) we now derive the fundamental limit of the localization accuracy for the point-spread hologram (PSH) in self-interference digital holography (SIDH). We assume that the emitter emits photons which and that the counting process is a Poisson process. We first consider the PSH given by
| (20) |
where , and the normalization constant, , is given by
| (21) |
where is the radius of the hologram at the CCD plane. The derivative of with respect to is given by
| (22) |
Since the PSH is symmetric, the non-diagonal elements of the Fisher information matrix are zero and = . Thus we have
| (23) |
where and . We similarly calculate , however note that in these calculations we ignore the dependence of on and . The derivative of with respect to is given by
| (24) |
and
| (25) |
7.2. Calculating the CRLB for the Gaussian and the astigmatic imaging model
7.2.1. Gaussian PSF
Using Eqs. (5) & (6), we calculate the fundamental limit of the localization precision for the PSF approximated by a Gaussian profile given by
| (26) |
By symmetry, the off-diagonal elements of the Fisher information matrix are zero. For a particle emitting photons, the elements of the Fisher information matrix describing the and localization precisions are given by
| (27) |
In order to calculate the CRLB of the estimation for a Gaussian profile, we approximated the PSF with a 2D Gaussian with a -dependent standard deviation [36] given by
| (28) |
where is the standard deviation of the in-focus PSF and is the depth of focus of the objective lens. The element of the Fisher information matrix can now be calculated similar to Eq. (27)
| (29) |
Therefore, using Eq. (5) the calculated limit of localization precision for a Gaussian profile is given by = = and = .
7.2.2. Astigmatic model
In the case of the astigmatic PSF, a weak cylindrical lens is introduced in the imaging pathway which splits the focal plane into two perpendicular focal planes at different depths giving an asymmetric PSF. The form of the astigmatic PSF on the detector can be approximated by [36]
| (30) |
and are the full-width half maximums (FWHMs) of the intensity distributions in and directions. = only half way between the two focal planes; we define this plane as . Assuming the -direction is focused above the focal plane and using Eq. (28), for the -direction and for the -direction.
| (31a) |
| (31b) |
where is the amount of astigmatism introduced by the cylindrical lens. The CRLB for the astigmatic PSF is calculated in a similar manner to that of the Gaussian PSF as described by Eqs. (5) & (6) and is given by
| (32a) |
| (32b) |
where and is the focal depth of the objective lens.
7.3. Calculation of the Cramér-Rao lower bound for the scalar PSF model
Fig. 12.
(A), (B) and (C) calculations for the scalar PSF model
We calculate the PSF from scalar diffraction theory with the equation
| (33) |
where is the pupil function and is the phase that results from a defocus, z. Because the transform is rotationally symmetric, we can numerically calculate the PSF with a one-dimensional integral.
| (34) |
To calculate the matrix elements and , we calculate and as the finite differences of over . We then calculate and by numerical integration using adaptive quadrature integration using the python library scipy.integrate. Figure 12 shows the CRLB of the scalar PSF model compared with the Gaussian PSF model. We can see that while the behavior is not exactly the same, it is similar. The structure of the PSF away from focus does not provide the same axial precision as SIDH.
7.4. Calculation of the Cramér-Rao lower bound for the COSA PSF
The COSA PSF can be calculated similarly.
| (35) |
where is the COSA phase function [14]. The parameter can be calculated for a desired axial range and system parameters using Eq. (5) from [14].
To calculate the matrix elements quickly, we use a purely numeric approach and calculate the PSF from the FFT of the back pupil plane. We calculate the PSF over pixels with a pixel size of 60 nm. is calculated from the finite difference along the x axis from the PSF image, and is calculated as the finite difference along the axial direction from the images, . nm.
7.5. CRLB plots for different experimental conditions of SIDH
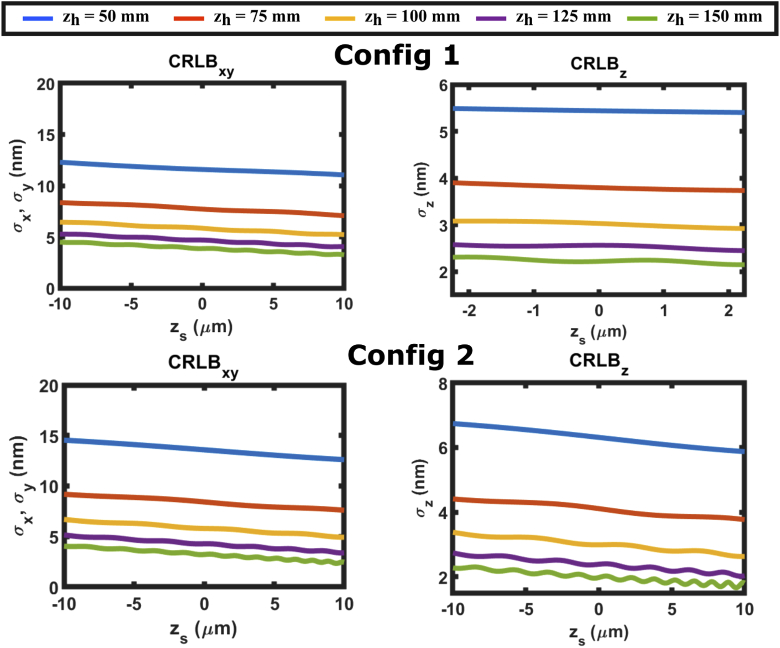
Different experimental parameters can provide different CRLB results for an SIDH system. Figure 13 shows the spatial and axial CRLB results for DOE-CCD distances () for the two different configurations. In both cases the 6000 photons are detected from the emitter ( = 6000) in the absence of background noise (=0).
Fig. 13.
, and calculations for SIDH with configurations 1 and 2 when the CCD is placed at different distances away from the DOE. =6000 photons and = 0 photons/.
Funding
National Science Foundation10.13039/100000001 (1555576); National Institutes of Health10.13039/100000002 (R21GM134462).
Disclosures
The authors declare no conflicts of interest.
References
- 1.Kim M., “Principles and techniques of digital holographic microscopy,” J. Photonics Energy 1(1), 018005 (2010). 10.1117/6.0000006 [DOI] [Google Scholar]
- 2.Rosen J., Vijayakumar A., Kumar M., Rai M. R., Kelner R., Kashter Y., Bulbul A., Mukherjee S., “Recent advances in self-interference incoherent digital holography,” Adv. Opt. Photonics 11(1), 1–66 (2019). 10.1364/AOP.11.000001 [DOI] [Google Scholar]
- 3.Weigel D., Babovsky H., Kiessling A., Kowarschik R., “Widefield microscopy with infinite depth of field and enhanced lateral resolution based on an image inverting interferometer,” Opt. Commun. 342, 102–108 (2015). 10.1016/j.optcom.2014.12.047 [DOI] [Google Scholar]
- 4.Nobukawa T., Katano Y., Muroi T., Kinoshita N., Ishii N., “Bimodal incoherent digital holography for both three-dimensional imaging and quasi-infinite–depth-of-field imaging,” Sci. Rep. 9(1), 3363 (2019). 10.1038/s41598-019-39728-8 [DOI] [PMC free article] [PubMed] [Google Scholar]
- 5.Lai X., Zeng S., Lv X., Yuan J., Fu L., “Violation of the lagrange invariant in an optical imaging system,” Opt. Lett. 38(11), 1896–1898 (2013). 10.1364/OL.38.001896 [DOI] [PubMed] [Google Scholar]
- 6.Rosen J., Kelner R., “Modified lagrange invariants and their role in determining transverse and axial imaging resolutions of self-interference incoherent holographic systems,” Opt. Express 22(23), 29048–29066 (2014). 10.1364/OE.22.029048 [DOI] [PMC free article] [PubMed] [Google Scholar]
- 7.Bouchal P., Bouchal Z., “Selective edge enhancement in three-dimensional vortex imaging with incoherent light,” Opt. Lett. 37(14), 2949–2951 (2012). 10.1364/OL.37.002949 [DOI] [PubMed] [Google Scholar]
- 8.Yu X., Hong J., Liu C., Kim M., “Review of digital holographic microscopy for three-dimensional profiling and tracking,” Opt. Eng. 53(11), 112306 (2014). 10.1117/1.OE.53.11.112306 [DOI] [Google Scholar]
- 9.Memmolo P., Miccio L., Paturzo M., Caprio G. D., Coppola G., Netti P. A., Ferraro P., “Recent advances in holographic 3D particle tracking,” Adv. Opt. Photonics 7(4), 713–755 (2015). 10.1364/AOP.7.000713 [DOI] [Google Scholar]
- 10.Rosen J., Brooker G., “Non-scanning motionless fluorescence three-dimensional holographic microscopy,” Nat. Photonics 2(3), 190–195 (2008). 10.1038/nphoton.2007.300 [DOI] [Google Scholar]
- 11.Sigal Y. M., Zhou R., Zhuang X., “Visualizing and discovering cellular structures with super-resolution microscopy,” Science 361(6405), 880–887 (2018). 10.1126/science.aau1044 [DOI] [PMC free article] [PubMed] [Google Scholar]
- 12.von Diezmann A., Shechtman Y., Moerner W., “Three-dimensional localization of single molecules for super-resolution imaging and single-particle tracking,” Chem. Rev. 117(11), 7244–7275 (2017). 10.1021/acs.chemrev.6b00629 [DOI] [PMC free article] [PubMed] [Google Scholar]
- 13.Zhou Y., Handley M., Carles G., Harvey A. R., “Advances in 3D single particle localization microscopy,” APL Photonics 4(6), 060901 (2019). 10.1063/1.5093310 [DOI] [Google Scholar]
- 14.Zhou Y., Carles G., “Precise 3D particle localization over large axial ranges using secondary astigmatism,” Opt. Lett. 45(8), 2466–2469 (2020). 10.1364/OL.388695 [DOI] [PubMed] [Google Scholar]
- 15.Prabhat P., Ram S., Ward E. S., Ober R. J., “Simultaneous imaging of different focal planes in fluorescence microscopy for the study of cellular dynamics in three dimensions,” IEEE Trans.on Nanobioscience 3(4), 237–242 (2004). 10.1109/TNB.2004.837899 [DOI] [PMC free article] [PubMed] [Google Scholar]
- 16.Juette M. F., Gould T. J., Lessard M. D., Mlodzianoski M. J., Nagpure B. S., Bennett B. T., Hess S. T., Bewersdorf J., “Three-dimensional sub–100 nm resolution fluorescence microscopy of thick samples,” Nat. Methods 5(6), 527–529 (2008). 10.1038/nmeth.1211 [DOI] [PubMed] [Google Scholar]
- 17.Tahmasbi A., Ram S., Chao J., Abraham A. V., Tang F. W., Ward E. S., Ober R. J., “Designing the focal plane spacing for multifocal plane microscopy,” Opt. Express 22(14), 16706–16721 (2014). 10.1364/OE.22.016706 [DOI] [PMC free article] [PubMed] [Google Scholar]
- 18.Fu Y., Winter P. W., Rojas R., Wang V., McAuliffe M., Patterson G. H., “Axial superresolution via multiangle TIRF microscopy with sequential imaging and photobleaching,” Proc. Natl. Acad. Sci. 113(16), 4368–4373 (2016). 10.1073/pnas.1516715113 [DOI] [PMC free article] [PubMed] [Google Scholar]
- 19.Deschamps J., Mund M., Ries J., “3D superresolution microscopy by supercritical angle detection,” Opt. Express 22(23), 29081–29091 (2014). 10.1364/OE.22.029081 [DOI] [PubMed] [Google Scholar]
- 20.Bourg N., Mayet C., Dupuis G., Barroca T., Bon P., Lécart S., Fort E., Lévêque-Fort S., “Direct optical nanoscopy with axially localized detection,” Nat. Photonics 9(9), 587–593 (2015). 10.1038/nphoton.2015.132 [DOI] [Google Scholar]
- 21.Shtengel G., Galbraith J. A., Galbraith C. G., Lippincott-Schwartz J., Gillette J. M., Manley S., Sougrat R., Waterman C. M., Kanchanawong P., Davidson M. W., “Interferometric fluorescent super-resolution microscopy resolves 3D cellular ultrastructure,” Proc. Natl. Acad. Sci. 106(9), 3125–3130 (2009). 10.1073/pnas.0813131106 [DOI] [PMC free article] [PubMed] [Google Scholar]
- 22.Huang B., Wang W., Bates M., Zhuang X., “Three-dimensional super-resolution imaging by stochastic optical reconstruction microscopy,” Science 319(5864), 810–813 (2008). 10.1126/science.1153529 [DOI] [PMC free article] [PubMed] [Google Scholar]
- 23.Pavani S. R. P., Thompson M. A., Biteen J. S., Lord S. J., Liu N., Twieg R. J., Piestun R., Moerner W., “Three-dimensional, single-molecule fluorescence imaging beyond the diffraction limit by using a double-helix point spread function,” Proc. Natl. Acad. Sci. 106(9), 2995–2999 (2009). 10.1073/pnas.0900245106 [DOI] [PMC free article] [PubMed] [Google Scholar]
- 24.Lew M. D., Lee S. F., Badieirostami M., Moerner W., “Corkscrew point spread function for far-field three-dimensional nanoscale localization of pointlike objects,” Opt. Lett. 36(2), 202–204 (2011). 10.1364/OL.36.000202 [DOI] [PMC free article] [PubMed] [Google Scholar]
- 25.Baddeley D., Cannell M. B., Soeller C., “Three-dimensional sub-100 nm super-resolution imaging of biological samples using a phase ramp in the objective pupil,” Nano Res. 4(6), 589–598 (2011). 10.1007/s12274-011-0115-z [DOI] [Google Scholar]
- 26.Jia S., Vaughan J. C., Zhuang X., “Isotropic three-dimensional super-resolution imaging with a self-bending point spread function,” Nat. Photonics 8(4), 302–306 (2014). 10.1038/nphoton.2014.13 [DOI] [PMC free article] [PubMed] [Google Scholar]
- 27.Shechtman Y., Sahl S. J., Backer A. S., Moerner W., “Optimal point spread function design for 3D imaging,” Phys. Rev. Lett. 113(13), 133902 (2014). 10.1103/PhysRevLett.113.133902 [DOI] [PMC free article] [PubMed] [Google Scholar]
- 28.Shechtman Y., Weiss L. E., Backer A. S., Sahl S. J., Moerner W., “Precise three-dimensional scan-free multiple-particle tracking over large axial ranges with tetrapod point spread functions,” Nano Lett. 15(6), 4194–4199 (2015). 10.1021/acs.nanolett.5b01396 [DOI] [PMC free article] [PubMed] [Google Scholar]
- 29.Rao C. R., Linear Statistical Inference and its Applications, vol. 2 (Wiley, 1973). [Google Scholar]
- 30.Kay S. M., Fundamentals of Statistical Signal Processing (Prentice Hall PTR, 1993). [Google Scholar]
- 31.Cover T. M., Thomas J. A., Elements of Information Theory (John Wiley & Sons, 2012). [Google Scholar]
- 32.Chao J., Ward E. S., Ober R. J., “Fisher information theory for parameter estimation in single molecule microscopy: tutorial,” J. Opt. Soc. Am. A 33(7), B36–B57 (2016). 10.1364/JOSAA.33.000B36 [DOI] [PMC free article] [PubMed] [Google Scholar]
- 33.Ober R. J., Ram S., Ward E. S., “Localization accuracy in single-molecule microscopy,” Biophys. J. 86(2), 1185–1200 (2004). 10.1016/S0006-3495(04)74193-4 [DOI] [PMC free article] [PubMed] [Google Scholar]
- 34.Ram S., Ward E. S., Ober R. J., “A stochastic analysis of performance limits for optical microscopes,” Multidim. Syst. Sign. Process 17(1), 27–57 (2006). 10.1007/s11045-005-6237-2 [DOI] [Google Scholar]
- 35.Liu S., Kromann E. B., Krueger W. D., Bewersdorf J., Lidke K. A., “Three dimensional single molecule localization using a phase retrieved pupil function,” Opt. Express 21(24), 29462–29487 (2013). 10.1364/OE.21.029462 [DOI] [PMC free article] [PubMed] [Google Scholar]
- 36.Holtzer L., Meckel T., Schmidt T., “Nanometric three-dimensional tracking of individual quantum dots in cells,” Appl. Phys. Lett. 90(5), 053902 (2007). 10.1063/1.2437066 [DOI] [Google Scholar]
- 37.Thompson M. A., Lew M. D., Badieirostami M., Moerner W., “Localizing and tracking single nanoscale emitters in three dimensions with high spatiotemporal resolution using a double-helix point spread function,” Nano Lett. 10(1), 211–218 (2010). 10.1021/nl903295p [DOI] [PMC free article] [PubMed] [Google Scholar]
- 38.Stallinga S., Rieger B., “Position and orientation estimation of fixed dipole emitters using an effective hermite point spread function model,” Opt. Express 20(6), 5896–5921 (2012). 10.1364/OE.20.005896 [DOI] [PubMed] [Google Scholar]
- 39.Marar A., Kner P., “Three-dimensional nanoscale localization of point-like objects using self-interference digital holography,” Opt. Lett. 45(2), 591–594 (2020). 10.1364/OL.379047 [DOI] [PMC free article] [PubMed] [Google Scholar]
- 40.Goodman J. W., Introduction to Fourier Optics (Roberts and Company Publishers, 2005). [Google Scholar]
- 41.Gao L., “Optimization of the excitation light sheet in selective plane illumination microscopy,” Biomed. Opt. Express 6(3), 881–890 (2015). 10.1364/BOE.6.000881 [DOI] [PMC free article] [PubMed] [Google Scholar]
- 42.Marar A., “FINCH-CRLB,” https://github.com/Knerlab/FINCH-CRLB (2020).
- 43.Saleh B. E., Teich M. C., Fundamentals of Photonics (John Wiley & Sons, 1991). [Google Scholar]
- 44.Katz B., Rosen J., Kelner R., Brooker G., “Enhanced resolution and throughput of fresnel incoherent correlation holography (finch) using dual diffractive lenses on a spatial light modulator (slm),” Opt. Express 20(8), 9109–9121 (2012). 10.1364/OE.20.009109 [DOI] [PubMed] [Google Scholar]
- 45.Kim M. K., “Adaptive optics by incoherent digital holography,” Opt. Lett. 37(13), 2694–2696 (2012). 10.1364/OL.37.002694 [DOI] [PubMed] [Google Scholar]
- 46.Marar A., Kner P., “Holographic-SMLM,” https://github.com/Knerlab/Holographic-SMLM (2020).


