Abstract
The Shack-Hartmann wavefront sensor (SHWS) is often operated under the assumption that the sensed light can be described by a single wavefront. In biological tissues and other multi-layered samples, secondary wavefronts from axially and/or transversely displaced regions can lead to artifactual aberrations. Here, we evaluate these artifactual aberrations in a simulated ophthalmic SHWS by modeling the beacons that would be generated by a two-layer retina in human and mouse eyes. Then, we propose formulae for calculating a minimum SHWS centroid integration area to mitigate these aberrations by an order of magnitude, potentially benefiting SHWS-based metrology and adaptive optics systems such as those used for retinal imaging and microscopy.
1. Introduction
The Shack-Hartmann wavefront sensor (SHWS) [1–3] is widely used in metrology [4], astronomy [5–7], microscopy [8–10], line-of-sight communications [11], refractive surgery [12–16], vision science [17–22] and retinal imaging [23–26] among other applications. This device operates by sampling a wavefront using an array of lenslets with a pixelated detector at its geometric focus [27]. This sensor operates by sampling an incoming wavefront or superposition of wavefronts using an array of lenslets in front of a pixelated sensor. The light reaching the wavefront sensor originates from an area or volume to which here we refer to as a beacon. When the beacon is so small that all wavefronts arriving to the lenslet array are identical, it is said that the SHWS is operating in the point source regime. In this regime, when the intensity of the wavefront W is approximately uniform over each lenslet [28], the centroid displacement of the lenslet image at the pixelated sensor from its nominal position, is given by [29],
| (1) |
where is the position vector on the SHWS pixelated sensor, is the lenslet focal length, and the integrals are performed over the entire lenslet area.
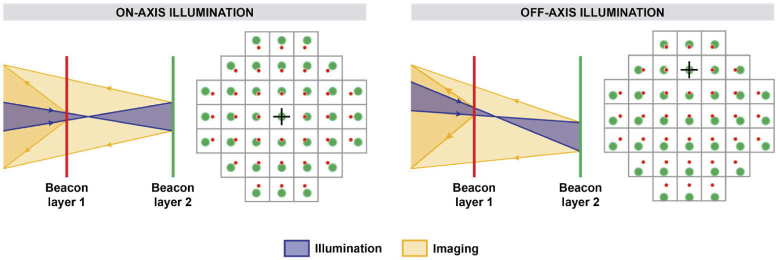
In multiple applications, including adaptive optics retinal imaging [23], microscopy [30], and ground-based astronomical adaptive optics [31], a beacon is generated by illuminating an object and measuring the wavefront generated by the backscattered or fluorescent light. If the backscattering or fluorescence originates from multiple layers [32–37], then each layer’s beacon generates its own SHWS spot pattern, as depicted in the two-layer model shown in Fig. 1. When the chief ray of the beacon illumination coincides with the optical axis of the SHWS, these spot patterns are radially shifted with respect to one another due to the different distances between the layers and the SHWS (see Fig. 1). When the illumination beam is shifted or tilted, however, the radial shift between spot patterns is now relative to a point away from the pupil center (see black crosshairs in Fig. 1). A thick layer could be thought of as a continuum of thin adjacent layers, each of which generates its own set of SHWS spots, giving the appearance of elongated spot, such as those seen in ground-based astronomical adaptive optics laser guide stars [7,31,38].
Fig. 1.
Geometrical optics depiction of SHWS lenslet images due to a dual layer beacon with on- and off-axis beacon illumination. The red and green SHWS lenslet images correspond to layers 1 and 2, respectively, and the black crosshairs to the lenslet where the beacon image shift is minimal.
If unaccounted for, the presence of multiple SHWS spot patterns can result in artifactual aberrations. In this work, we seek to evaluate the magnitude of these artifactual aberrations and demonstrate their mitigation through the use of a proposed minimum centroid integration area. We first consider how SHWS lenslet images are shifted by the presence of secondary beacons that only differ from a primary beacon in defocus and/or tilt. This scenario can be thought of as an extension of the concept of point source regime [5]. If aberrations other than defocus and tilt change across beacons, spatial filtering or coherence gating to reject light from undesired beacons should be considered [39–43]. Next, we posit formulae for determining the minimum centroid integration area (search box) that captures the central lobe of all beacons. This is followed by a description of the methods used to calculate realistic SHWS spot patterns, accounting for diffraction and defocus in both the illumination and imaging beams, as well as the low Fresnel number of most SHWS lenslets [27]. Finally, the artifactual aberrations are calculated using the traditional and proposed search box sizes in SHWS dual spot patterns in optical systems with 0.24 and 0.53 numerical apertures (representative of the human and mouse eyes, respectively). The simulations include four commonly used beacon pupil illumination profiles: full circular, annular [44,45], small circular on-axis, and small circular off-axis [46].
2. Theory
2.1. Multi-beacon Lenslet image centroid
Let us start by assuming a SHWS that sees light from multiple incoherent beacons, each of which creates a uniform intensity profile across a lenslet of area [28]. The lenslet image centroid is, by definition, the intensity-weighted sum of the centroids of the individual beacon images , which using Eq. (1) yields
| (2) |
where i and j denote beacon indices. If we now define the differences between each wavefront and that of the first beacon, that is, , we have that,
| (3) |
which can be interpreted as the first beacon image centroid being biased by the other beacons. When the wavefront differences are pure defocus [47,48], this expression reduces to,
| (4) |
where is the lenslet position vector assuming that the center of coordinates is at the SHWS pupil center, and is the focus difference between the first and ith beacons in units of diopters at the lenslet plane. The dependence on means that the centroid bias is zero for a lenslet at the pupil center, increasing linearly with distance from the pupil center, which corresponds to pure defocus bias (see Fig. 1, left). The form of this bias term indicates that if the distance between the beacons and their relative intensities remain constant, then the defocus bias term will also remain constant, and thus can be calibrated out.
When using off-axis beacon illumination [46,49], lenslet images are laterally shifted, with Eq. (4) becoming
| (5) |
where, is the tilt difference vector at the lenslet plane between the first and the ith beacon in units of radians. Because tilt shifts all the centroids equally, the SHWS images will appear radially shifted away from an off-center pupil location, as depicted in the right panel of Fig. 1.
2.2. Centroid search box size determination
Diffraction at the lenslet aperture dictates that SHWS lenslet images have infinite extent, and thus the estimation of the centroid of a SHWS lenslet image should require an infinitely large area on the pixelated sensor. In practice, however, centroids are estimated using pixels within regions of interest referred to as search boxes, ignoring the crosstalk due to the overlap of these infinitely large light distributions from other lenslets. In the interest of simplicity, this crosstalk is assumed negligible here, which is equivalent to assuming infinitely large Fresnel numbers.
SHWS centroiding algorithms are usually iterative [19,33,40,50–57], recentering the search box on the previous iteration centroid estimate, while also shrinking it, aiming to only use the pixels with higher intensities in the final iteration. In the presence of a single beacon, the truncation of the centroid integration area due to finite search boxes (truncation) does not introduce substantial error, provided the search box center is close to the actual centroid and it is comparable to or larger than the central lobe of the lenslet image. In the presence of multiple beacons, however, excessively small search boxes can result in non-negligible errors due to asymmetric beacon image truncation [58,59]. When the beacon wavefront differences are dominated by defocus, the truncation of the multi-beacon image results in radially symmetric artifactual aberrations, such as defocus, primary, secondary and higher order spherical aberrations [58,59]. When the wavefront differences also contain tilt, excessive search box shrinking will also result in non-radially symmetric artifactual aberrations, such as coma.
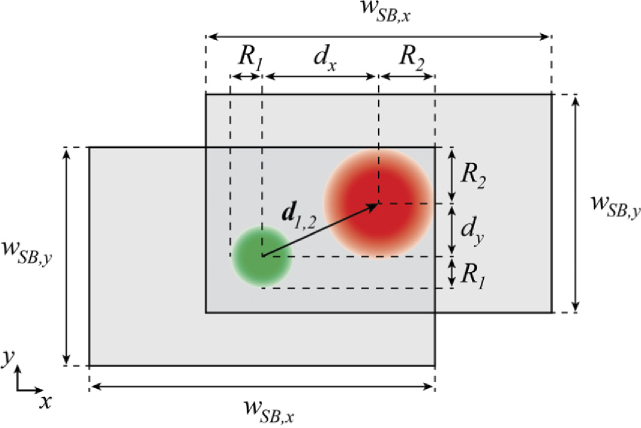
Here, we suggest a minimum search box size for iterative SHWS centroid algorithms that fully contains the central lobes of all beacon images [59,60], assuming that previous iterations centered the search box on the approximate image centroid. For simplicity, we discuss next the two-beacon case, but the reasoning can be extended to more beacons. If two beacon images at the SHWS pixelated sensor have radii and and their center separation is given by the vector (see Fig. 2), then the proposed search box width and height are
| (6) |
and
| (7) |
where and denote unit vectors along the - and -axis. These dimensions assume the worst-case scenario in which the relative intensity of one of the beacons is much greater than that of the other, and that one or more iterations have centered the search box close to the multi-beacon centroid. This condition could be relaxed, and therefore a smaller search box could be used, if knowledge of the relative intensity of the beacons is available. If the beacons size and intensity are identical, then the search box dimensions can be half of those in Eqs. (6) and (7) (minimal value).
Fig. 2.
SHWS lenslet search boxes (solid line filled with light grey) with suggested minimum dimensions in the presence of two beacons separated by . The two search boxes correspond to the extreme cases in which each of the beacons is much brighter than the other.
If the only differences between beacon wavefronts are defocus and tilt, then the vector , which varies across lenslets, can be calculated as [61],
| (8) |
where, as stated in the previous section, is the beacon focus difference in diopters (difference of the inverse wavefront radius of curvature), and is the tilt vector difference between the wavefront beacons in radians, both at the lenslet array. and can be calculated from their entrance pupil values by accounting for the refractive index of the object space n and the SHWS pupil magnification M (ratio of exit to entrance pupil diameters) [62].
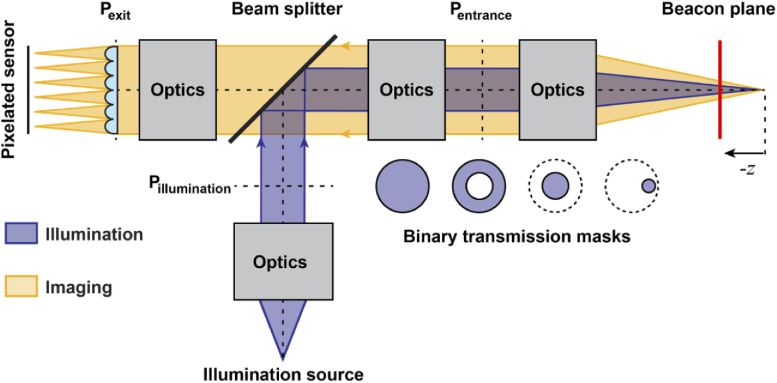
The intensity of the beacon lenslet image generated by illuminating a plane perpendicular to the optical axis of the SHWS with uniform scattering or fluorescent properties as depicted in Fig. 3 with a point source, and assuming that the imaging process is linear in intensity (temporal incoherence), is given by,
| (9) |
with and being the illumination and ith lenslet amplitude point spread functions (PSFs) respectively, and represents convolution. We can coarsely approximate the convolution as an addition of the full-width at half maximum of the lenslet (assumed square) diffraction pattern central lobe and the beacon radius generated by a near-focus Gaussian beam with numerical aperture . The Gaussian modeling is adequate for modeling the fundamental spatial modes of many lasers and light sources delivered through single-mode optical fibers, which are commonly used as beacon illumination source. With these assumptions, the radius of the beacon image at the SHWS pixelated detector is (see Appendix A)
| (10) |
where is the SHWS lenslet width, is the focal length of the optics focusing light onto the sample with numerical aperture , z is the beacon plane distance to the illumination focus, is the illumination wavelength and the factor 3.54 arises from the use of the half width Gaussian beam propagation formula. For uniform (top-hat) illumination profiles and away from the focus, the above expression can be approximated using geometrical optics as
| (11) |
Fig. 3.
Shack-Hartmann wavefront sensor schematic with a beacon generated using a point source that illuminates a backscattering or fluorescent plane, where P denotes pupil conjugate planes. The beacon illumination can be spatially modulated using pupil masks at the pupil plane with binary transmission.
3. Methods
3.1. Point spread function diffraction calculation
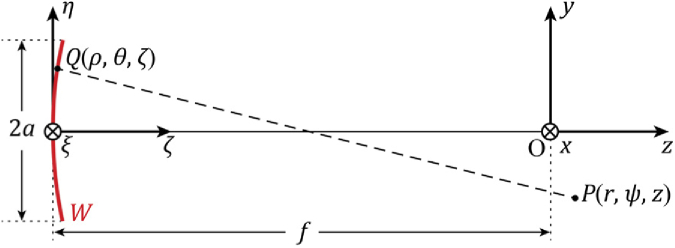
The point-spread-functions in Eq. (9) were numerically evaluated using the diffraction theory presented next assuming aberration-free optics. The beacon illumination was modeled as a converging spherical monochromatic wave normally incident on a pupil mask with either circular or annular binary transmission. The emerging electric field of wavelength and amplitude A at the pupil had an outer circular radius a and converged towards a point at a distance f along a line perpendicular to the aperture plane and passing through its center, as shown in Fig. 4. The complex electric field near the focus can be calculated in polar coordinates using Li’s approximation [63,64], which is similar to the Fresnel approximation of the Huygens-Fresnel principle but also accounting for the focal shift seen in most SHWS lenslet arrays due to their low Fresnel number () [27],
| (12) |
where
| (13) |
and it is assumed that
| (14) |
The PSF calculation of the ith square lenslet with center coordinates was performed assuming a spherical monochromatic wave emerging from the beacon plane with low Fresnel number. In this way, the amplitude of the electric field at the SHWS pixelated sensor, in Cartesian coordinates for convenience, was calculated as,
| (15) |
where, is the optical power of the spherical wave at the lenslet in units of diopters and . Here, is a circular binary pupil function of radius R accounting for the partial illumination of lenslets at the SHWS pupil edge,
| (16) |
Fig. 4.
Notation for diffraction calculation near the focus of a converging monochromatic spherical wave W due to an aperture of radius a. The point P is specified by a position vector relative to the origin O and Q is a point on W.
To account for the longitudinal magnification from the beacon to the lenslet image, the value of z to be used in the calculation of the imaging PSF is evaluated in terms of the axial separation between the beacon and the illumination focus as (see Eq. (5.28) in [62]),
| (17) |
where, is the focal length of the eye. The diffraction integrals in Eq. (12) and Eq. (15) were numerically evaluated using MATLAB’s (Mathworks, Natick, Massachusetts, USA) integral2 function with default tolerances, taking advantage of circular symmetry when possible. The corresponding intensities, calculated as the modulus square of the complex electric field amplitudes, were convolved as given by Eq. (9). Calculation times for each SHWS lenslet on an i7 (Intel Corporation, Santa Clara, California, USA) 4-GHz CPU varied between 20 and 70 minutes, for the respective human and mouse dual retinal layer models described below.
3.2. Dual layer model
The physical parameters chosen for the two simulations presented below are motivated by the ophthalmic SHWS, which is widely used in adaptive optics instruments for retinal imaging and vision science. Cross-sectional imaging of the living mammalian retina using optical coherence tomography suggests that the human and mouse retina can be coarsely modeled as two scattering layers (see Fig. 5) approximately 250 [65,66] and 200 µm [67,68] apart, respectively. This imaging modality suggests that the ratio of backscattering intensity from these layers could span over two orders of magnitude, although this only considers light emerging from the eye with the same polarization as the incident light [69–72]. These two retinal layers were modeled as embedded in a medium with ∼1.33 refractive index (the vitreous) [73], and seen by the SHWS through the optics of the eye with 8 mm pupil diameter and 16.7 mm back focal length [73] for the human eye, and 2 mm and 1.9 mm for the mouse eye. For the human eye, a 0.7 pupil magnification [26] and a lenslet array with 200 µm pitch and 7.8 mm geometrical focal length was assumed. For the mouse eye a lenslet array with 300 µm pitch and 4 mm focal length was assumed, with 2.8 pupil magnification to account for the smaller pupil of the mouse eye. The illumination and imaging wavelengths were assumed to be 850 nm and delivered to the retina through one of the following binary transmission pupil masks: full diameter circular; annulus with 100% outer diameter and 50% inner diameter; circular on-axis with 50% pupil diameter; and circular with 25% pupil diameter shifted towards the pupil edge.
Fig. 5.
Near infrared optical coherence tomography (OCT) cross-sectional view of the retina of a healthy human subject (top-left) shown using a linear intensity scale and a corresponding en face color fundus picture showing the location of the OCT cross-section (right panel, dashed orange line). The bottom left plot shows the ratio of the anterior (inner) and posterior (outer) axially integrated reflectivity of the orange and blue layers. The scale bar in the cross-section image is 250 µm wide and tall.
It is important to note that the relative intensity of the layers used here, namely 1:1 and 10:1, will only affect the magnitude of the artifactual aberrations, and not the size of the search boxes proposed in Eqs. (6) and (7).
3.3. Numerical calculations
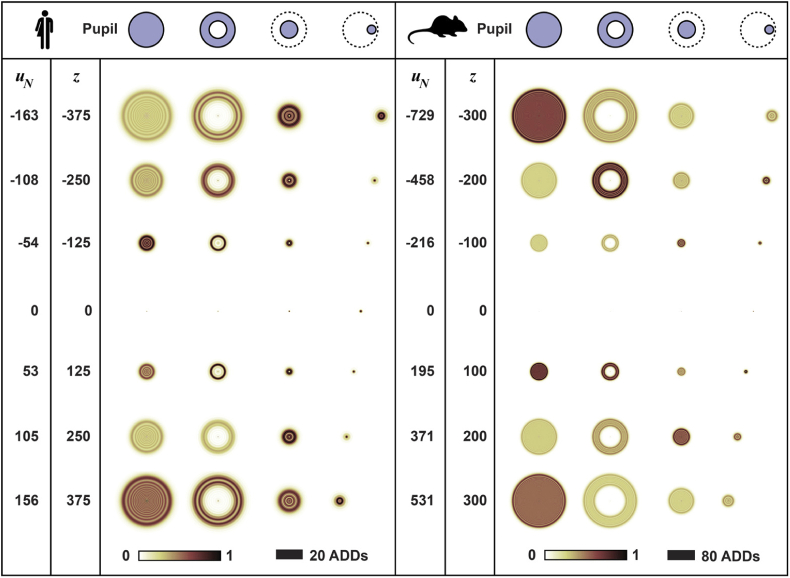
The electric field distribution of the beacon illumination was calculated using Eq. (12) over a square region 100 Airy disk diameters (ADDs) in width, to capture more than 99.9% of the energy passing through the transmission masks and with 10 samples per ADD. The beacon illumination for each pupil mask was calculated for the foci shown in Fig. 6 between -375 to 375 µm range in 125 µm steps for the simulated human eye and between -300 and 300 µm range in 100 µm steps for mouse eye. The resulting intensity () patterns show that the beacon size changes dramatically with focus (Fig. 7), and that the decentered circular pupil shows a transverse shift given by,
| (18) |
where is the transverse decenter of the circular mask relative to the SHWS’s (and eye’s) optical axis. These beacon profiles also show that other than at the focus, the patterns could be reasonably approximated using geometrical optics as uniformly illuminated circles or annuli. Thus, the more complex diffraction calculations described above could be simplified given that these patterns will be blurred by the convolution with the lenslet point-spread function.
Fig. 6.
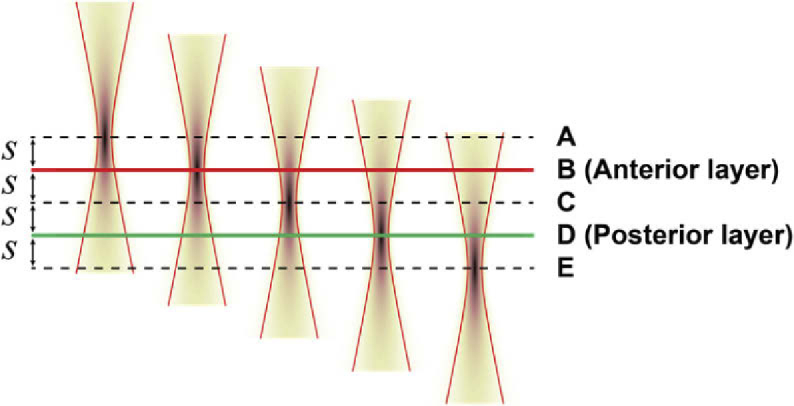
Shack-Hartmann wavefront sensor illumination foci (A-E) 125 µm apart in the simulated human retina and 100 µm in the mouse retina, in relation to the beacon layers (B & D).
Fig. 7.
Beacon intensity patterns () for the four simulated pupil transmission functions and seven foci, with parameters defined in the main text. Note the difference in the black horizontal scale bar between the human and mouse eye intensity patterns, and the lateral shift of the off-center illumination with focus.
The point spread function of each lenslet was calculated using Eq. (15), making sure that the sampling matched that of the beacon illumination while also considering the lateral magnification factor from the beacon onto the lenslet image. This was achieved using Matlab’s spline interpolation to match the sampling required for calculating the convolution (see Eq. (9)) while keeping intensity errors below 0.003% of the maximum intensity value.
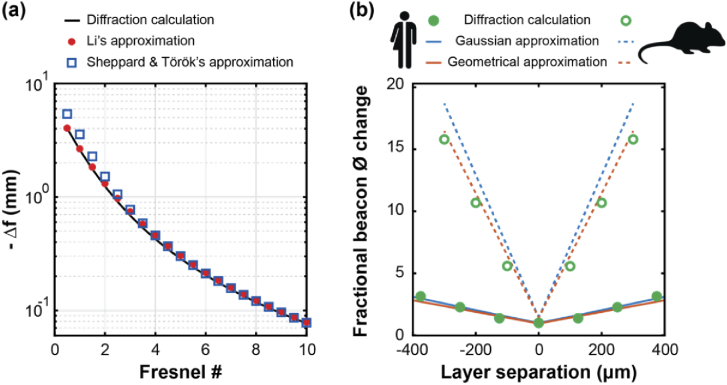
Four tests were performed to validate the numerical calculations. First, the calculated intensity at the geometrical focal plane of a circular pupil was compared against the analytically derived intensity, which is the Airy disk. A maximum error <10−13 of the peak intensity was obtained for an area centered on the propagation axis and 2 ADDs across. Next, cross-sections of the field across a plane containing the propagation axis with various Fresnel numbers ( = 6.5 mm, = 101.5 µm and = 0.16 - 3.17 µm) were calculated [27], and the axial positions of the peak intensities relative to the geometrical focus (focal shift) were compared against the approximate formulae by Li [74] and Sheppard and Török [75]. The results, shown in Fig. 8(a) agree over the range in which these approximations are considered valid. Thirdly, the numerically evaluated intensity along the axis of a circular aperture with a large Fresnel number approximation is within of the theoretical predictions (Eq. (26) of Section 8.8 in Ref. [76]). Finally, a comparison of the Gaussian beam approximation from Eq. (10), assuming a lenslet image due to a single defocused layer and the width of the same lenslet image obtained from exact numerical evaluation of Eq. (9), is shown in Fig. 8(b), showing agreement to within ∼8% for the human eye (Gaussian model) and ∼14% for the mouse eye (geometrical optics model).
Fig. 8.
(a) Diffraction calculation validation for low Fresnel SHWS lenslets using Eq. (15) (black line) against predictions from approximate empirical formulae by Li [63] (full red circles) and Sheppard and Török [75] (blue squares). (b) Spot width increase factor due to a single out-of-focus layer: Comparison between the approximate Gaussian beam model (see Eq. (10)), geometrical optics model (see Eq. (11)) and diffraction calculations.
3.4. Centroiding algorithm
After performing the convolution in Eq. (9) each simulated SHWS lenslet image had more than 600 and 2000 samples across each lenslet for the human and mouse retinas, respectively. The centroid of each lenslet image was then estimated using an iterative centroid algorithm, in which the first search boxes matched the projection of the square lenslet onto the pixelated sensor. The search boxes in subsequent iterations were re-centered on the centroid estimated in the previous iteration and shrunk by the factor , where n is the number of iterations, which for this study we chose as 10, and and are the initial and final search box widths, respectively. The algorithm allows the search box to move beyond the boundaries of the initial search box, where the images were also calculated. The only unrealistic aspect of this approach is that each lenslet intensity pattern at the SHWS pixelated sensor assumes the absence of lenslet crosstalk.
4. Results
4.1. Lenslet images
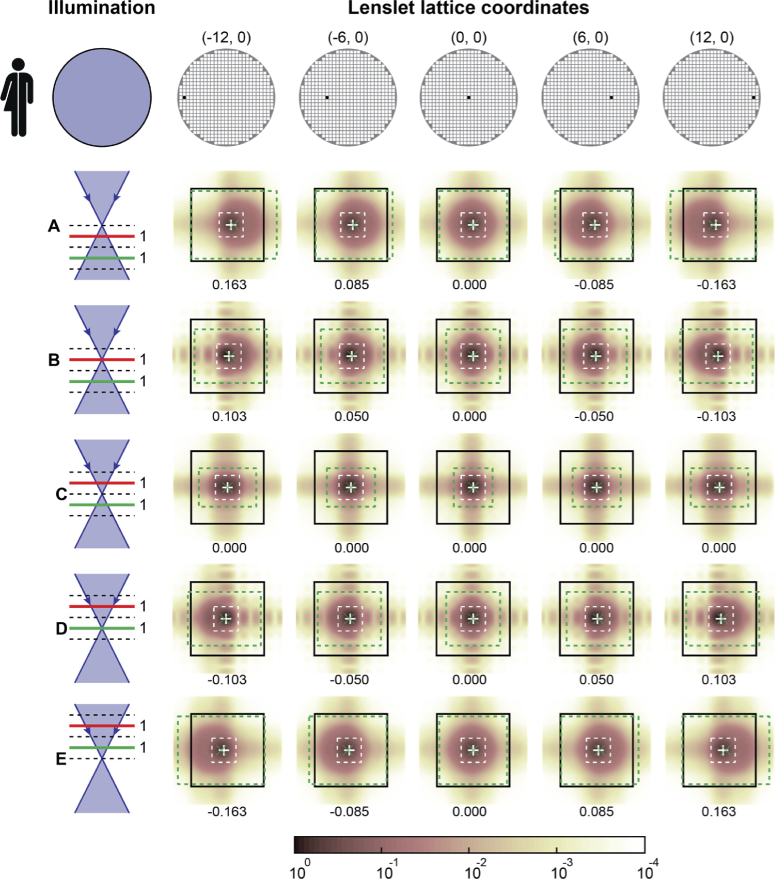
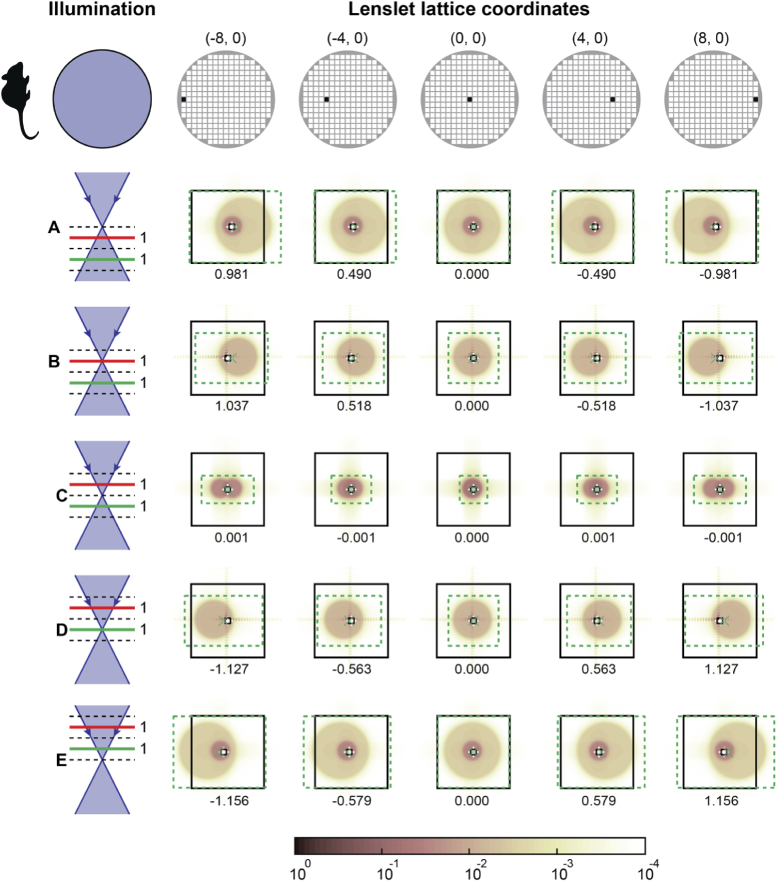
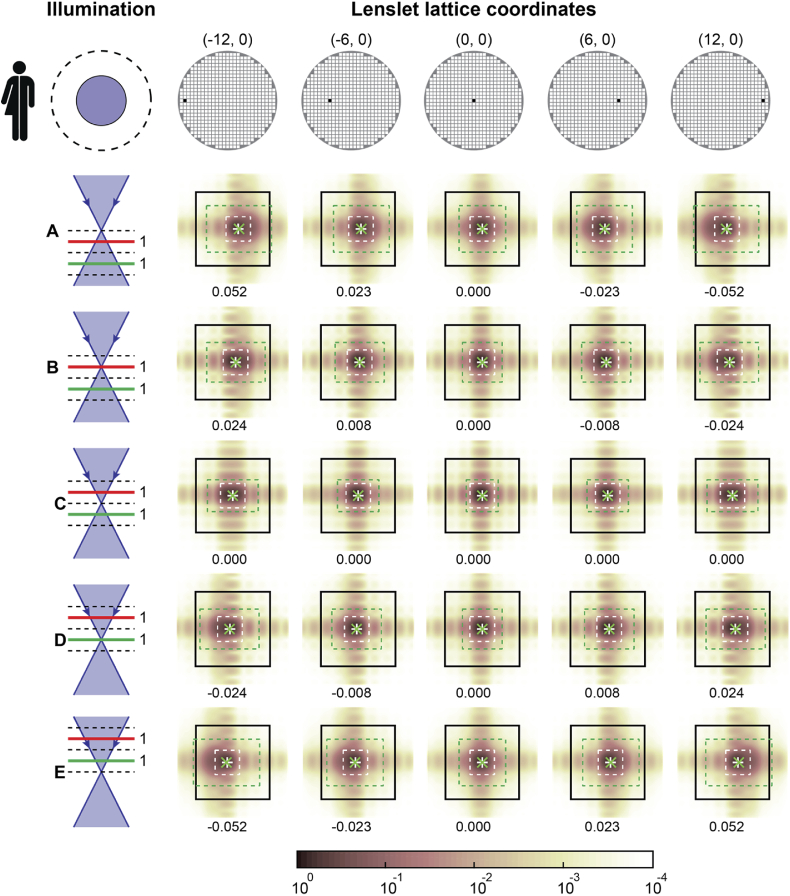
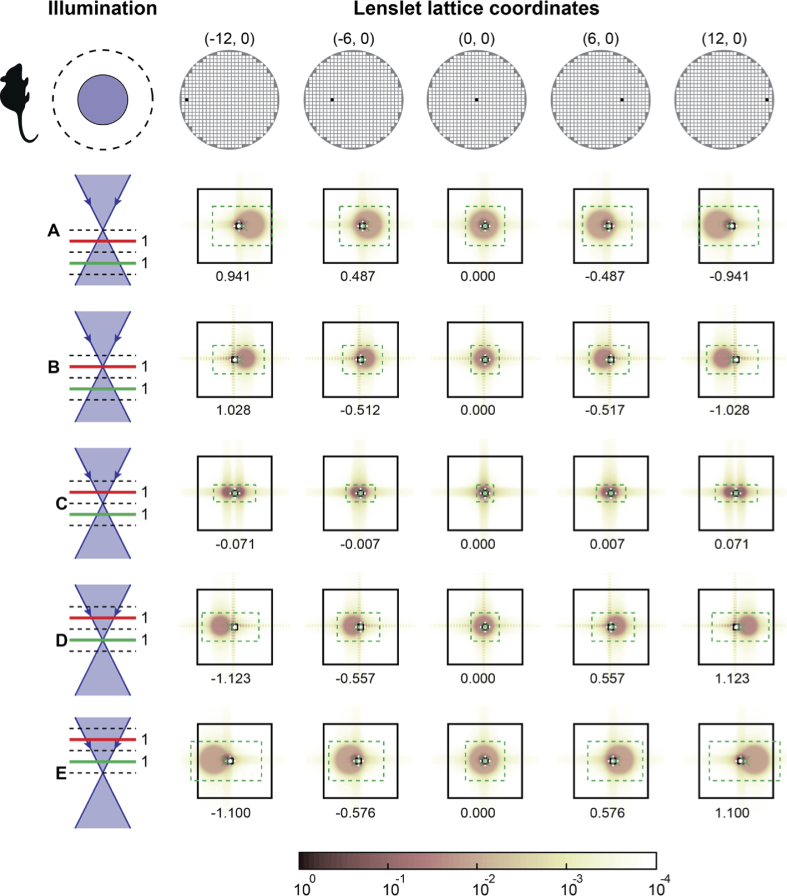
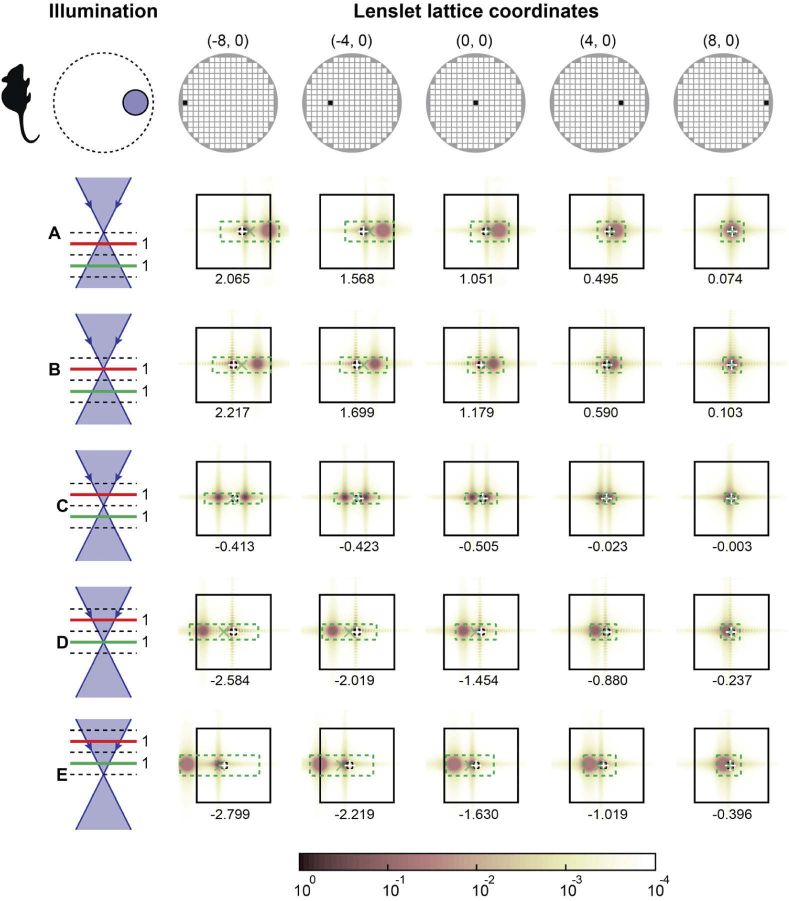
Simulated lenslet images for circular pupil illumination with 1:1 intensity beacon ratio are shown in Fig. 9 and Fig. 10 for the simulated human and mouse retinas, respectively. In these figures, the defocused beacon images are substantially broader than the lenslet diffraction pattern central lobe, indicating that irrespective of the presence of a secondary beacon, the search box size should be increased with beacon defocus to fully capture the lenslet image.
Fig. 9.
SHWS lenslet images at the pupil positions shown in the top row diagrams, calculated for a human eye using a full circular illumination pupil at five foci, assuming beacon light originating from the red and green planes with equal amplitude. The images show normalized intensity using the logarithmic scale indicated by the color bar. The black solid line squares represent the lenslet outline projected onto the pixelated sensor, while the dashed-line rectangles show the search boxes used in the final centroiding iteration with sizes matching the lenslet central diffraction lobe (white dashed lines) and that provided by Eqs. (6) and (7) (green). The estimated centroids are indicated with green ‘x’ and white ‘+’ markers, and the number below each panel is the difference between centroids estimated with the two marked search boxes, in units of the lenslet diffraction pattern first minimum-to-minimum lobe distance.
Fig. 10.
SHWS lenslet images at the pupil positions shown in the top row diagrams, calculated for a mouse eye using a full circular illumination pupil at five foci, assuming beacon light originating from the red and green planes with equal amplitude. The images show normalized intensity using the logarithmic color scale indicated by the color bar. The large black solid line squares represent the lenslet outline projected onto the pixelated sensor, while the dashed-line rectangles/squares show the search boxes used in the final centroiding iteration with sizes matching the lenslet central diffraction lobe (small black box) and that provided by Eqs. (6) and (7) (green). The estimated centroids are indicated with green ‘x’ and white ‘+’ markers, and the number below each panel is the difference between centroids estimated with the two marked search boxes, in units of the lenslet diffraction pattern first minimum-to-minimum lobe distance.
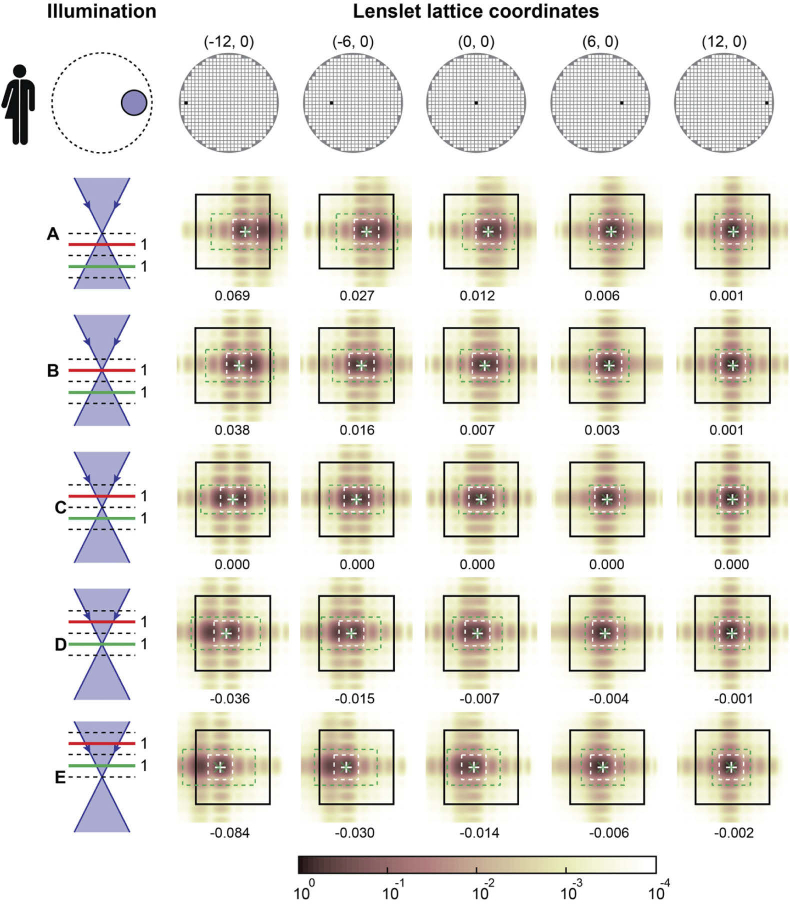
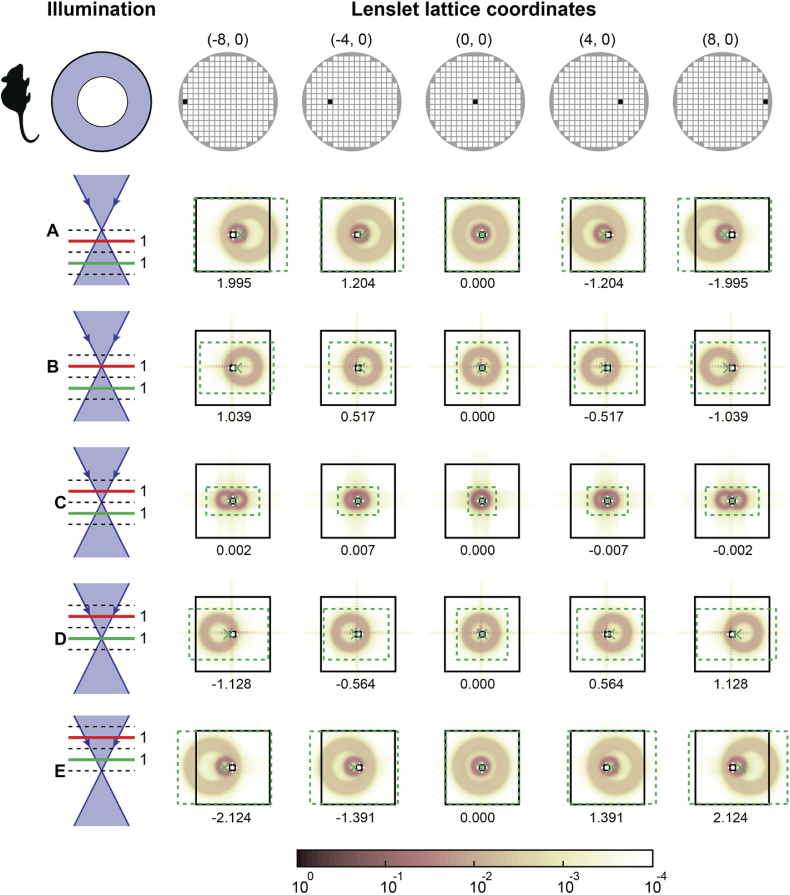
These figures also show that images of the secondary beacons can reach the edge of the lenslet outline, suggesting that iterative centroiding algorithms must allow the search box to translate beyond the lenslet boundary. Additional figures (Figs. 14–19) with 1:1 beacon ratio for the other simulated pupil illumination profiles in Appendix B, provide further qualitative confirmation that the proposed minimum centroid final search box size formulae are adequate.
All SHWS lenslet image figures show that for rotationally symmetric pupil illumination, centroid errors are approximately proportional to the lenslet distance to the pupil center, indicating that the dominant artifactual aberration across all foci is defocus.
For small off-axis illumination, however, the centroid error varies nonlinearly across the pupil, suggesting the presence of tilt, defocus, and coma. The centroid error along the middle panel row (focus in layer C) for rotationally symmetric illumination are negligible or zero because both beacons are equally defocused and have identical intensity. This results in equal and opposite beacon displacement which cancels the centroid bias even if the search boxes do not completely capture the central lobe of either beacon.
4.2. Artifactual focus error
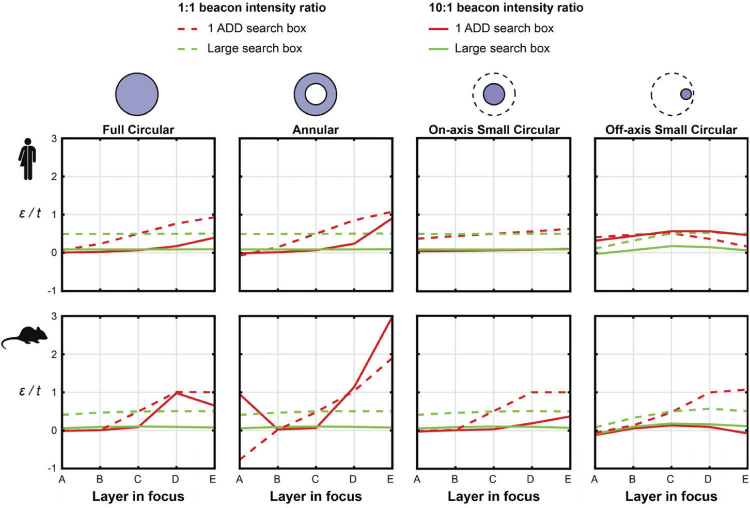
Artifactual focus error, defined here as the difference between the defocus in the single- and dual-layer model retinas, was calculated using a linear fitting of the centroid displacements as a function of the lenslet radial coordinate, and dividing the slope by that generated by a diopter of defocus at the entrance pupil plane. As mentioned above, this showed that the major artifactual aberration due to the secondary beacon is defocus, which is plotted in Fig. 11 as a function of SHWS focus for all pupil masks. These plots show that when using the SHWS to aid the focusing of an instrument, as it is commonly done in adaptive optics ophthalmoscopes, the estimation of axial separation between two planes in an image stack or two features will be affected in a manner that is dependent on the beacon axial separation and intensity ratio.
Fig. 11.
Defocus error in units of the axial separation of the beacons t (250 µm for human and 200 µm for mouse eyes) a dual-layer model of the Shack-Hartmann wavefront sensor for the human and mouse eyes plotted as a function of SHWS focus for all considered beacon illumination strategies and two reflectivity ratios (1:1 and 10:1).
Large search boxes result in flatter curves that correspond to a focus offset which depends on the beacon intensity ratio, as predicted by Eq. (5). Therefore, when the SHWS is used to adjust focus, axial distances will be correctly estimated.
4.3. Artifactual primary spherical aberration and coma
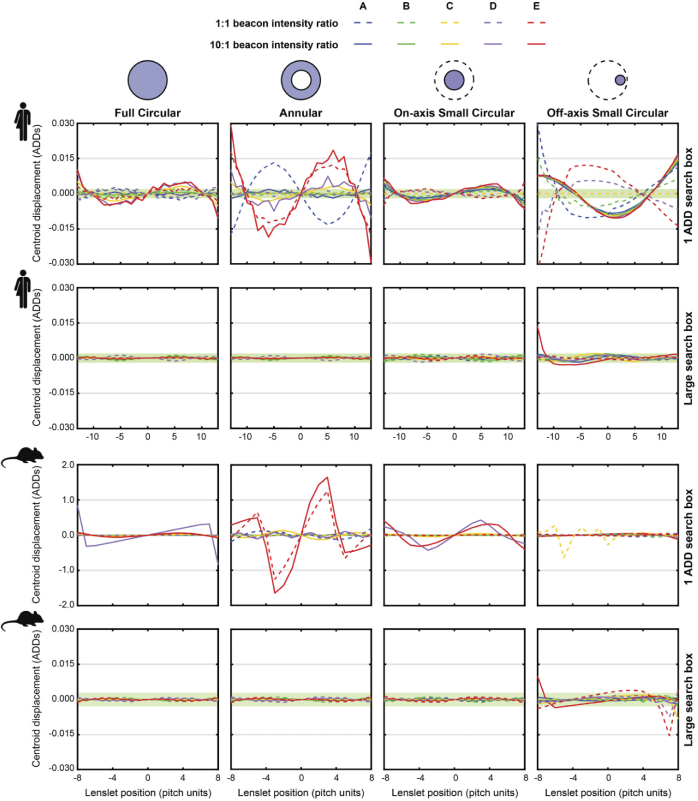
The first derivative of primary defocus is tilt, and therefore defocus-subtracted centroid displacements were obtained by subtracting the linear component of the spot displacement as a function of radial lenslet coordinate. The subtraction of defocus reveals the residual artifactual wavefront slopes shown in Fig. 12, where the green shaded areas indicate the centroid repeatability in our SHWS (∼0.01 pix). The use of smaller final search boxes in the centroiding algorithm in the rotationally symmetric pupil masks results in approximately anti-symmetric third order polynomials, which indicates that the dominant residual artifactual aberration is primary spherical aberration (which has a third order derivative). For the off-axis pupil illumination, the smaller search boxes result in curves that can be approximated as a second order polynomial, which corresponds to artifactual coma. In all simulated conditions, the artifactual spherical aberration and coma are greatly mitigated using the proposed search boxes.
Fig. 12.
Defocus subtracted SHWS lenslet image displacements calculated with search box sizes matching the lenslet central diffraction lobe and that provided by Eqs. (6) and (7) are shown for the human and mouse eyes with four different beacon illumination strategies and two different anterior to posterior reflectivity ratios. Each curve in the plots represents an illumination focus (from A-E, see Fig. 6). The shaded area (green) in these plots indicates the centroid repeatability (∼0.01 pixels) of our custom SHWSs using scientific-grade CCD cameras.
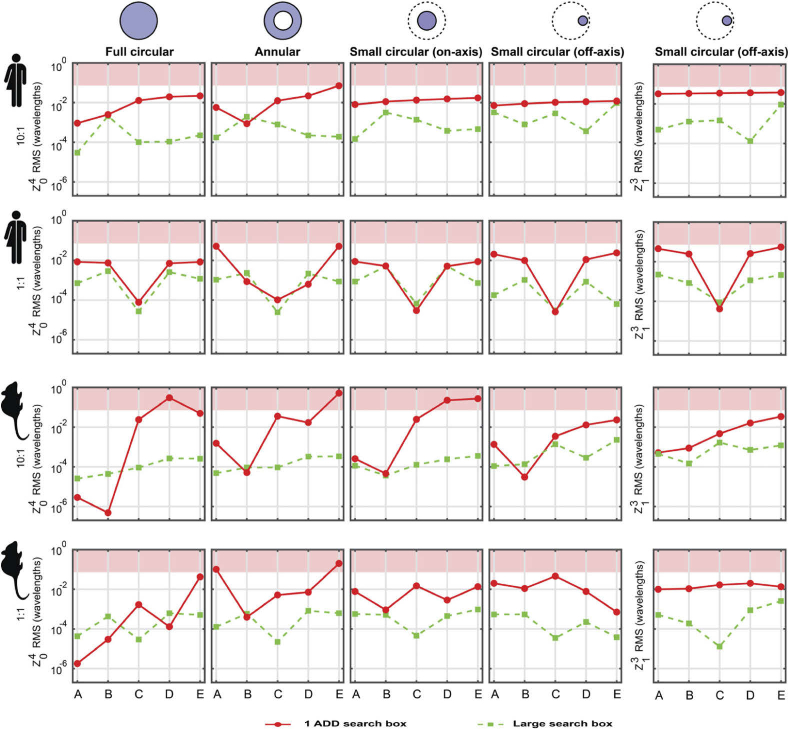
The plots in Fig. 12 were fitted with the curves that would be generated by spherical aberration and coma, to estimate their amplitude [29], which are plotted in Fig. 13, where the shaded region represents a wavefront RMS greater than the Marechal’s criterion for diffraction-limited imaging (i.e., ≤ /14, with = 850 nm). Again, these plots show that for both the human and mouse simulated retinas, the proposed larger centroid search box is beneficial. Here it is important to note that when this appears not to be the case (i.e., red solid dots below green squares) the aberration amplitude is most likely below the repeatability and/or sensitivity of any SHWS built to date, and most certainly of ours, as the plots in Fig. 12 show. In the human eye plots, the artifactual aberration due to the use of the smaller search boxes are always close to or below the diffraction limit. This might suggest that using the smaller search boxes is acceptable, but it should be kept in mind that in real SHWSs there will be numerous other sources of errors that will compound with these artifactual aberrations, including those caused by photon noise, readout noise, pixelation, finite bit-depth, non-uniform sensitivity across the pixelated sensor and lenslet crosstalk. Therefore, we suggest that larger search boxes should be used. In the mouse eye plots, we can see that the smaller search boxes can introduce artifactual aberrations with amplitudes well above the diffraction limit for the rotationally symmetric pupil masks, and that the use of larger search boxes is desirable.
Fig. 13.
Zernike primary spherical aberration and coma coefficients for all illumination pupil masks as a function of focus in a dual layer retina model of the Shack-Hartmann wavefront sensor for the human and mouse eyes and for 10:1 and 1:1 anterior to posterior layer reflectivity ratios. Note that coma is only present in the off-axis pupil illumination. The red shaded regions represent an error greater than the Marechal’s criterion for diffraction-limited imaging.
5. Summary
The presence of secondary wavefronts from axially and/or transversely displaced beacons can lead to artifactual aberrations in SHWS measurements. Here we proposed formulae to estimate a minimum centroid search box to mitigate these artifactual aberrations. Numerical simulation of two dual layer beacon scenarios relevant to ophthalmic wavefront sensing show that the secondary wavefronts can introduce defocus, spherical aberration and coma that vary with the relative intensity of the beacons. The proposed approach is, that is the calculation of a minimal search box size, is independent on the amplitude of the beacons, and therefore, it is broadly applicable, and not just restricted to ophthalmic SHWSs. Interestingly, the simulations show that the lenslet Fresnel number should be chosen not purely based on aberration dynamic range or sensitivity, as it is usually the case [4], but also taking into account the potential crosstalk due to the large size of out-of-focus beacon images.
Acknowledgments
The authors would like to thank Donald T. Miller and Stephen A. Burns for useful insight and discussions during this work.
Appendix A: illumination beacon radius
The 1/ half-width of the illumination beacon due to an evolving Gaussian beam at a single layer separated axially from the illumination focus by a distance z can be calculated using the following hyperbolic relation,
| (19) |
where, is the Rayleigh range and is the Gaussian waist radius, which is related to the numerical aperture as follows for circular pupils,
| (20) |
Then, the radius of the illumination beacon can be written as follows,
| (21) |
Appendix B: simulated dual layer SHWS images
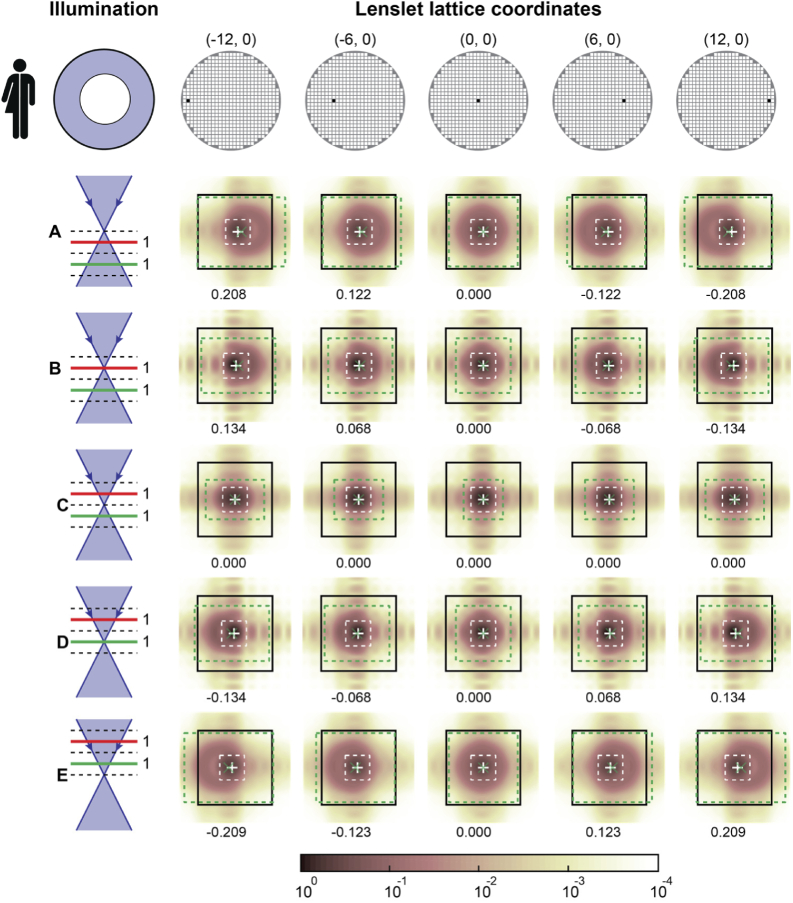
Fig. 14.
SHWS lenslet images at the pupil positions shown in the top row diagrams, calculated for a human eye and annular pupil illumination at five foci, assuming beacon light originating from the red and green planes with equal amplitude. The images show normalized intensity using the logarithmic color scale indicated by the color bar. The large black solid line squares represent the lenslet outline projected onto the pixelated sensor, while the dashed-line rectangles/squares show the search boxes used in the final centroiding iteration with sizes matching the lenslet central diffraction lobe (white dashed lines) and that provided by Eqs. (6) and (7) (green dashed lines). The estimated centroids are indicated using corresponding green ‘x’ and white ‘+’ markers, and the number below each panel is the difference between centroids estimated with the two marked search boxes, in units of the diffraction-limited first minimum to minimum lobe distance.
Fig. 15.
SHWS lenslet images calculated for a human eye at various pupil positions (see top row diagrams) and an on-axis small circular pupil and five foci, and assuming beacon originating from the red and green planes with equal amplitude. The images show normalized intensity using the logarithmic color scale indicated by the color bar. The large black solid line squares represent the lenslet outline projected onto the pixelated sensor, while the dashed-line rectangles/squares show the search boxes used in the final centroiding iteration with sizes matching the lenslet central diffraction lobe (white dashed lines) and that provided by Eqs. (6) and (7) (green dashed lines). The estimated centroids are indicated using corresponding green ‘x’ and white ‘+’ markers, and the number below each panel is the difference between centroids estimated with the two marked search boxes, in units of the diffraction-limited first minimum to minimum lobe distance.
Fig. 16.
SHWS lenslet images calculated for a human eye at various pupil positions (see top row diagrams) using an off-axis small circular pupil and five foci, and assuming beacon originating from the red and green planes with equal amplitude. The images show normalized intensity using the logarithmic color scale indicated by the color bar. The large black solid line squares represent the lenslet outline projected onto the pixelated sensor, while the dashed-line rectangles/squares show the search boxes used in the final centroiding iteration with sizes matching the lenslet central diffraction lobe (white dashed lines) and that provided by Eqs. (6) and (7) (green dashed lines). The estimated centroids are indicated using corresponding green ‘x’ and white ‘+’ markers, and the number below each panel is the difference between centroids estimated with the two marked search boxes, in units of the diffraction-limited first minimum to minimum lobe distance.
Fig. 17.
SHWS lenslet images calculated for a mouse eye at various pupil positions (see top row diagrams) and using an annular pupil and five foci, and assuming beacon originating from the red and green planes with equal amplitude. The images show normalized intensity using the logarithmic color scale indicated by the color bar. The large black solid line squares represent the lenslet outline projected onto the pixelated sensor, while the dashed-line rectangles/squares show the search boxes used in the final centroiding iteration with sizes matching the lenslet central diffraction lobe (small black box) and that provided by Eqs. (6) and (7) (green dashed lines). The estimated centroids are indicated using corresponding green ‘x’ and white ‘+’ markers, and the number below each panel is the difference between centroids estimated with the two marked search boxes, in units of the diffraction-limited first minimum to minimum lobe distance.
Fig. 18.
SHWS lenslet images calculated for a mouse eye at various pupil positions (see top row diagrams) and using an on-axis small circular pupil and five foci, and assuming beacon originating from the red and green planes with equal amplitude. The images show normalized intensity using the logarithmic color scale indicated by the color bar. The large black solid line squares represent the lenslet outline projected onto the pixelated sensor, while the dashed-line rectangles/squares show the search boxes used in the final centroiding iteration with sizes matching the lenslet central diffraction lobe (small black box) and that provided by Eqs. (6) and (7) (green dashed lines). The estimated centroids are indicated using corresponding green ‘x’ and white ‘+’ markers, and the number below each panel is the difference between centroids estimated with the two marked search boxes, in units of the diffraction-limited first minimum to minimum lobe distance.
Fig. 19.
SHWS lenslet images calculated for a mouse eye at various pupil positions (see top row diagrams) and using an off-axis small circular pupil and five foci, and assuming beacon originating from the red and green planes with equal amplitude. The images show normalized intensity using the logarithmic color scale indicated by the color bar. The large black solid line squares represent the lenslet outline projected onto the pixelated sensor, while the dashed-line rectangles/squares show the search boxes used in the final centroiding iteration with sizes matching the lenslet central diffraction lobe (small black box) and that provided by Eqs. (6) and (7) (green dashed lines). The estimated centroids are indicated using corresponding green ‘x’ and white ‘+’ markers, and the number below each panel is the difference between centroids estimated with the two marked search boxes, in units of the diffraction-limited first minimum to minimum lobe distance.
Funding
National Eye Institute10.13039/100000053 (P30EY026877, R01EY025231, R01EY028287, R01EY031360, U01EY025477); Research to Prevent Blindness10.13039/100001818 (Challenge Grant).
Disclosures
The authors declare no conflicts of interest.
References
- 1.Hartmann J., “Bemerkungen über den bau und die justierung von spektrographen,” Z. Instrumentenkd 20, 47–58 (1900). [Google Scholar]
- 2.Shack R. V., Platt B. C., “Production and use of a lenticular Hartmann screen,” J. Opt. Soc. Am. 61(5), 648–697 (1971). 10.1364/JOSA.61.000648 [DOI] [Google Scholar]
- 3.Platt B. C., Shack R., “History and principles of Shack-Hartmann wavefront sensing,” J. Refract. Surg. 17(5), S573–577 (2001). 10.3928/1081-597X-20010901-13 [DOI] [PubMed] [Google Scholar]
- 4.Dörband B., Müller H., Gross H., Handbook of Optical Systems, Volume 5: Metrology of Optical Components and Systems (John Wiley & Sons, 2012). [Google Scholar]
- 5.Hardy J. W., Adaptive Optics for Astronomical Telescopes (Oxford University Press, 1998). [Google Scholar]
- 6.Roddier F., Adaptive Optics in Astronomy (Cambridge University Press, 1999). [Google Scholar]
- 7.Wizinowich P. L., Le Mignant D., Bouchez A. H., Campbell R. D., Chin J. C. Y., Contos A. R., van Dam M. A., Hartman S. K., Johansson E. M., Lafon R. E., Lewis H., Stomski P. J., Summers D. M., “The W. M. Keck Observatory laser guide star adaptive optics system: Overview,” Publ. Astron. Soc. Pac. 118(840), 297–309 (2006). 10.1086/499290 [DOI] [Google Scholar]
- 8.Booth M. J., “Adaptive optical microscopy: the ongoing quest for a perfect image,” Light: Sci. Appl. 3(4), e165 (2014). 10.1038/lsa.2014.46 [DOI] [Google Scholar]
- 9.Tao X., Fernandez B., Azucena O., Fu M., Garcia D., Zuo Y., Chen D. C., Kubby J., “Adaptive optics confocal microscopy using direct wavefront sensing,” Opt. Lett. 36(7), 1062–1064 (2011). 10.1364/OL.36.001062 [DOI] [PubMed] [Google Scholar]
- 10.Ji N., “Adaptive optical fluorescence microscopy,” Nat. Methods 14(4), 374–380 (2017). 10.1038/nmeth.4218 [DOI] [PubMed] [Google Scholar]
- 11.Levine B. M., Martinsen E. A., Wirth A., Jankevics A., Toledo-Quinones M., Landers F., Bruno T. L., “Horizontal line-of-sight turbulence over near-ground paths and implications for adaptive optics corrections in laser communications,” Appl. Opt. 37(21), 4553–4560 (1998). 10.1364/AO.37.004553 [DOI] [PubMed] [Google Scholar]
- 12.Liang J., Williams D. R., Miller D., “Supernormal vision and high-resolution retinal imaging through adaptive optics,” J. Opt. Soc. Am. A 14(11), 2884–2892 (1997). 10.1364/JOSAA.14.002884 [DOI] [PubMed] [Google Scholar]
- 13.Mrochen M., Kaemmerer M., Seiler T., “Wavefront-guided laser in situ keratomileusis: early results in three eyes,” J. Refract. Surg. 16(2), 116–121 (2000). [DOI] [PubMed] [Google Scholar]
- 14.Mrochen M., Kaemmerer M., Seiler T., “Clinical results of wavefront-guided laser in situ keratomileusis 3 months after surgery,” J. Cataract Refractive Surg. 27(2), 201–207 (2001). 10.1016/S0886-3350(00)00827-0 [DOI] [PubMed] [Google Scholar]
- 15.Schallhorn S., Brown M., Venter J., Teenan D., Hettinger K., Yamamoto H., “Early clinical outcomes of wavefront-guided myopic LASIK treatments using a new-generation Hartmann-Shack aberrometer,” J. Refract. Surg. 30(1), 14–21 (2013). 10.3928/1081597X-20131029-02 [DOI] [PubMed] [Google Scholar]
- 16.Akondi V., Perez-Merino P., Martinez-Enriquez E., Dorronsoro C., Alejandre N., Jimenez-Alfaro I., Marcos S., “Evaluation of the true wavefront aberrations in eyes implanted with a rotationally asymmetric multifocal intraocular lens,” J. Refract. Surg. 33(4), 257–265 (2017). 10.3928/1081597X-20161206-03 [DOI] [PubMed] [Google Scholar]
- 17.Yoon G. Y., Williams D. R., “Visual performance after correcting the monochromatic and chromatic aberrations of the eye,” J. Opt. Soc. Am. A 19(2), 266–275 (2002). 10.1364/JOSAA.19.000266 [DOI] [PubMed] [Google Scholar]
- 18.Artal P., Chen L., Fernández E. J., Singer B., Manzanera S., Williams D. R., “Neural compensation for the eye's optical aberrations,” J. Vis. 4(4), 4–287 (2004). 10.1167/4.4.4 [DOI] [PubMed] [Google Scholar]
- 19.Porter J., Queener H., Lin J., Thorn K., Awwal A., eds., Adaptive Optics for Vision Science: Principles, Practices, Design, and Applications, Microwave and Optical Engineering (John Wiley & Sons, Inc, 2006). [Google Scholar]
- 20.Guo H., Atchison D. A., Birt B. J., “Changes in through-focus spatial visual performance with adaptive optics correction of monochromatic aberrations,” Vis. Res. 48(17), 1804–1811 (2008). 10.1016/j.visres.2008.04.033 [DOI] [PubMed] [Google Scholar]
- 21.Vinas M., Benedi-Garcia C., Aissati S., Pascual D., Akondi V., Dorronsoro C., Marcos S., “Visual simulators replicate vision with multifocal lenses,” Sci. Rep. 9(1), 1539 (2019). 10.1038/s41598-019-38673-w [DOI] [PMC free article] [PubMed] [Google Scholar]
- 22.Marcos S., Werner J. S., Burns S. A., Merigan W. H., Artal P., Atchison D. A., Hampson K. M., Legras R., Lundstrom L., Yoon G., Carroll J., Choi S. S., Doble N., Dubis A. M., Dubra A., Elsner A., Jonnal R., Miller D. T., Paques M., Smithson H. E., Young L. K., Zhang Y., Campbell M., Hunter J., Metha A., Palczewska G., Schallek J., Sincich L. C., “Vision science and adaptive optics, the state of the field,” Vis. Res. 132, 3–33 (2017). 10.1016/j.visres.2017.01.006 [DOI] [PMC free article] [PubMed] [Google Scholar]
- 23.Roorda A., Romero-Borja F., Donnelly W., III, Queener H., Hebert T., Campbell M., “Adaptive optics scanning laser ophthalmoscopy,” Opt. Express 10(9), 405–412 (2002). 10.1364/OE.10.000405 [DOI] [PubMed] [Google Scholar]
- 24.Dubra A., Sulai Y., Norris J. L., Cooper R. F., Dubis A. M., Williams D. R., Carroll J., “Noninvasive imaging of the human rod photoreceptor mosaic using a confocal adaptive optics scanning ophthalmoscope,” Biomed. Opt. Express 2(7), 1864–1876 (2011). 10.1364/BOE.2.001864 [DOI] [PMC free article] [PubMed] [Google Scholar]
- 25.Burns S. A., Elsner A. E., Sapoznik K. A., Warner R. L., Gast T. J., “Adaptive optics imaging of the human retina,” Prog. Retin. Eye Res. 68, 1–30 (2019). 10.1016/j.preteyeres.2018.08.002 [DOI] [PMC free article] [PubMed] [Google Scholar]
- 26.Dubra A., Sulai Y., “Reflective afocal broadband adaptive optics scanning ophthalmoscope,” Biomed. Opt. Express 2(6), 1757–1768 (2011). 10.1364/BOE.2.001757 [DOI] [PMC free article] [PubMed] [Google Scholar]
- 27.Akondi V., Dubra A., “Accounting for focal shift in the Shack–Hartmann wavefront sensor,” Opt. Lett. 44(17), 4151–4154 (2019). 10.1364/OL.44.004151 [DOI] [PMC free article] [PubMed] [Google Scholar]
- 28.Akondi V., Steven S., Dubra A., “Centroid error due to non-uniform lenslet illumination in the Shack–Hartmann wavefront sensor,” Opt. Lett. 44(17), 4167–4170 (2019). 10.1364/OL.44.004167 [DOI] [PMC free article] [PubMed] [Google Scholar]
- 29.Akondi V., Dubra A., “Average gradient of Zernike polynomials over polygons,” Opt. Express 28(13), 18876–18886 (2020). 10.1364/OE.393223 [DOI] [PMC free article] [PubMed] [Google Scholar]
- 30.Booth M. J., “Adaptive optics in microscopy,” Philos. Trans. R. Soc., A 365(1861), 2829–2843 (2007). 10.1098/rsta.2007.0013 [DOI] [PubMed] [Google Scholar]
- 31.Thompson L. A., Gardner C. S., “Experiments on laser guide stars at Mauna Kea Observatory for adaptive imaging in astronomy,” Nature 328(6127), 229–231 (1987). 10.1038/328229a0 [DOI] [Google Scholar]
- 32.Forest C., Canizares C., Neal D., McGuirk M., Schattenburg M., “Metrology of thin transparent optics using Shack-Hartmann wavefront sensing,” Opt. Eng. 43(3), 742 (2004). 10.1117/1.1645256 [DOI] [Google Scholar]
- 33.Geng Y., Schery L. A., Sharma R., Dubra A., Ahmad K., Libby R. T., Williams D. R., “Optical properties of the mouse eye,” Biomed. Opt. Express 2(4), 717–738 (2011). 10.1364/BOE.2.000717 [DOI] [PMC free article] [PubMed] [Google Scholar]
- 34.Tan C., Wang X., Ng Y., Lim W., Chai T. Y., “Method for distortion correction of multi-layered surface reconstruction using time-gated wavefront sensing approach,” J. Eur. Opt. Soc-Rapid 8, 13034 (2013). 10.2971/jeos.2013.13034 [DOI] [Google Scholar]
- 35.Liu T., Thibos L., Marin G., Hernandez M., “Evaluation of a global algorithm for wavefront reconstruction for Shack-Hartmann wave-front sensors and thick fundus reflectors,” Ophthalmic Physiol. Opt. 34(1), 63–72 (2014). 10.1111/opo.12097 [DOI] [PubMed] [Google Scholar]
- 36.Sajdak B. S., Salmon A. E., Cava J. A., Allen K. P., Freling S., Ramamirtham R., Norton T. T., Roorda A., Carroll J., “Noninvasive imaging of the tree shrew eye: Wavefront analysis and retinal imaging with correlative histology,” Exp. Eye Res. 185, 107683 (2019). 10.1016/j.exer.2019.05.023 [DOI] [PMC free article] [PubMed] [Google Scholar]
- 37.Singh S. E., Wildsoet C. F., Roorda A. J., “Optical aberrations of guinea pig eyes,” Invest. Ophthalmol. Visual Sci. 61(10), 39 (2020). 10.1167/iovs.61.10.39 [DOI] [PMC free article] [PubMed] [Google Scholar]
- 38.Beckers J. M., “Overcoming perspective elongation effects in laser-guide-star-aided adaptive optics,” Appl. Opt. 31(31), 6592–6594 (1992). 10.1364/AO.31.006592 [DOI] [PubMed] [Google Scholar]
- 39.Feierabend M., Rückel M., Denk W., “Coherence-gated wave-front sensing in strongly scattering samples,” Opt. Lett. 29(19), 2255–2257 (2004). 10.1364/OL.29.002255 [DOI] [PubMed] [Google Scholar]
- 40.Wang J., Podoleanu A. G., “Demonstration of real-time depth-resolved Shack-Hartmann measurements,” Opt. Lett. 37(23), 4862–4864 (2012). 10.1364/OL.37.004862 [DOI] [PubMed] [Google Scholar]
- 41.Tuohy S., Podoleanu A. G., “Depth-resolved wavefront aberrations using a coherence-gated Shack-Hartmann wavefront sensor,” Opt. Express 18(4), 3458–3476 (2010). 10.1364/OE.18.003458 [DOI] [PubMed] [Google Scholar]
- 42.Rueckel M., Mack-Bucher J. A., Denk W., “Adaptive wavefront correction in two-photon microscopy using coherence-gated wavefront sensing,” Proc. Natl. Acad. Sci. 103(46), 17137–17142 (2006). 10.1073/pnas.0604791103 [DOI] [PMC free article] [PubMed] [Google Scholar]
- 43.Rahman S. A., Booth M. J., “Direct wavefront sensing in adaptive optical microscopy using backscattered light,” Appl. Opt. 52(22), 5523–5532 (2013). 10.1364/AO.52.005523 [DOI] [PubMed] [Google Scholar]
- 44.Vohnsen B., Rativa D., “Ultrasmall spot size scanning laser ophthalmoscopy,” Biomed. Opt. Express 2(6), 1597–1609 (2011). 10.1364/BOE.2.001597 [DOI] [PMC free article] [PubMed] [Google Scholar]
- 45.Sulai Y. N., Dubra A., “Adaptive optics scanning ophthalmoscopy with annular pupils,” Biomed. Opt. Express 3(7), 1647–1661 (2012). 10.1364/BOE.3.001647 [DOI] [PMC free article] [PubMed] [Google Scholar]
- 46.Williams D. R., Yoon G., “Wavefront sensor with off-axis illumination,” U.S. patent 6264328B1 (2001).
- 47.Zhou X., Bedggood P., Metha A., “Limitations to adaptive optics image quality in rodent eyes,” Biomed. Opt. Express 3(8), 1811–1824 (2012). 10.1364/BOE.3.001811 [DOI] [PMC free article] [PubMed] [Google Scholar]
- 48.Herriot G., Hickson P., Ellerbroek B., Véran J.-P., She C.-Y., Clare R., Looze D., “Focus errors from tracking sodium layer altitude variations with laser guide star adaptive optics for the Thirty Meter Telescope,” Proc. SPIE 6272, 62721I (2006). 10.1117/12.672081 [DOI] [Google Scholar]
- 49.Max C. E., Olivier S. S., Friedman H. W., An K., Avicola K., Beeman B. V., Bissinger H. D., Brase J. M., Erbert G. V., Gavel D. T., Kanz K., Liu M. C., Macintosh B., Neeb K. P., Patience J., Waltjen K. E., “Image improvement from a sodium-layer laser guide star adaptive optics system,” Science 277(5332), 1649–1652 (1997). 10.1126/science.277.5332.1649 [DOI] [Google Scholar]
- 50.Hofer H., Artal P., Singer B., Aragón J. L., Williams D. R., “Dynamics of the eye's wave aberration,” J. Opt. Soc. Am. A 18(3), 497–506 (2001). 10.1364/josaa.18.000497 [DOI] [PubMed] [Google Scholar]
- 51.Prieto P. M., Vargas-Martín F., Goelz S., Artal P., “Analysis of the performance of the Hartmann-Shack sensor in the human eye,” J. Opt. Soc. Am. A 17(8), 1388–1398 (2000). 10.1364/JOSAA.17.001388 [DOI] [PubMed] [Google Scholar]
- 52.Thomas S., Fusco T., Tokovinin A., Nicolle M., Michau V., Rousset G., “Comparison of centroid computation algorithms in a Shack-Hartmann sensor,” Mon. Not. R. Astron. Soc. 371(1), 323–336 (2006). 10.1111/j.1365-2966.2006.10661.x [DOI] [Google Scholar]
- 53.Akondi V., Vohnsen B., “Myopic aberrations: impact of centroiding noise in Hartmann Shack wavefront sensing,” Ophthalmic Physiol. Opt. 33(4), 434–443 (2013). 10.1111/opo.12076 [DOI] [PubMed] [Google Scholar]
- 54.Lardière O., Conan R., Clare R., Bradley C., Hubin N., “Performance comparison of centroiding algorithms for laser guide star wavefront sensing with extremely large telescopes,” Appl. Opt. 49(31), G78–G94 (2010). 10.1364/AO.49.000G78 [DOI] [Google Scholar]
- 55.Leroux C., Dainty C., “Estimation of centroid positions with a matched-filter algorithm: relevance for aberrometry of the eye,” Opt. Express 18(2), 1197–1206 (2010). 10.1364/OE.18.001197 [DOI] [PubMed] [Google Scholar]
- 56.Anugu N., Garcia P. J. V., Correia C. M., “Peak-locking centroid bias in Shack–Hartmann wavefront sensing,” Mon. Not. R. Astron. Soc. 476(1), 300–306 (2018). 10.1093/mnras/sty182 [DOI] [Google Scholar]
- 57.Jiang W., Xian H., Shen F., “Detection error of Shack-Hartmann wavefront sensor,” Proc. SPIE 3126, 534–544 (1997). 10.1117/12.279060 [DOI] [Google Scholar]
- 58.Gao W., Cense B., Zhu C., Jonnal R., Miller D., “Impact of fundus structure on wavefront sensing of ocular aberrations,” Invest. Ophthalmol. Vis. Sci. 49(13), 2836 (2008). [Google Scholar]
- 59.Lardière O., Conan R., Bradley C., Jackson K., Hampton P., “Radial thresholding to mitigate laser guide star aberrations on centre-of-gravity-based Shack–Hartmann wavefront sensors,” Mon. Not. R. Astron. Soc. 398(3), 1461–1467 (2009). 10.1111/j.1365-2966.2009.15199.x [DOI] [Google Scholar]
- 60.Clare R. M., Weddell S. J., Le Louarn M., “Mitigation of truncation effects in elongated Shack–Hartmann laser guide star wavefront sensor images,” Appl. Opt. 59(22), 6431–6442 (2020). 10.1364/AO.394751 [DOI] [PubMed] [Google Scholar]
- 61.Lardière O., Conan R., Bradley C., Jackson K., Herriot G., “A laser guide star wavefront sensor bench demonstrator for TMT,” Opt. Express 16(8), 5527–5543 (2008). 10.1364/OE.16.005527 [DOI] [PubMed] [Google Scholar]
- 62.Hecht E., “Optics,” Optics, 4th Edition (Addison Wesley Longman Inc, 1998). [Google Scholar]
- 63.Li Y., “Dependence of the focal shift on Fresnel number and f number,” J. Opt. Soc. Am. 72(6), 770–774 (1982). 10.1364/JOSA.72.000770 [DOI] [Google Scholar]
- 64.Li Y., Wolf E., “Three-dimensional intensity distribution near the focus in systems of different Fresnel numbers,” J. Opt. Soc. Am. A 1(8), 801–808 (1984). 10.1364/JOSAA.1.000801 [DOI] [Google Scholar]
- 65.Massin P., Erginay A., Haouchine B., Mehidi A. B., Paques M., Gaudric A., “Retinal thickness in healthy and diabetic subjects measured using optical coherence tomography mapping software,” Eur. J. Ophthalmol. 12(2), 102–108 (2002). 10.1177/112067210201200205 [DOI] [PubMed] [Google Scholar]
- 66.Wu P. C., Chen Y. J., Chen C. H., Chen Y. H., Shin S. J., Yang H. J., Kuo H. K., “Assessment of macular retinal thickness and volume in normal eyes and highly myopic eyes with third-generation optical coherence tomography,” Eye 22(4), 551–555 (2008). 10.1038/sj.eye.6702789 [DOI] [PubMed] [Google Scholar]
- 67.Fischer M. D., Huber G., Beck S. C., Tanimoto N., Muehlfriedel R., Fahl E., Grimm C., Wenzel A., Remé C. E., van de Pavert S. A., Wijnholds J., Pacal M., Bremner R., Seeliger M. W., “Noninvasive, in vivo assessment of mouse retinal structure using optical coherence tomography,” PLoS One 4(10), e7507 (2009). 10.1371/journal.pone.0007507 [DOI] [PMC free article] [PubMed] [Google Scholar]
- 68.Ferguson L. R., Dominguez Ii J. M., Balaiya S., Grover S., Chalam K. V., “Retinal thickness normative data in wild-type mice using customized miniature SD-OCT,” PLoS One 8(6), e67265 (2013). 10.1371/journal.pone.0067265 [DOI] [PMC free article] [PubMed] [Google Scholar]
- 69.Chong S. P., Zhang T., Kho A., Bernucci M. T., Dubra A., Srinivasan V. J., “Ultrahigh resolution retinal imaging by visible light OCT with longitudinal achromatization,” Biomed. Opt. Express 9(4), 1477–1491 (2018). 10.1364/BOE.9.001477 [DOI] [PMC free article] [PubMed] [Google Scholar]
- 70.Hee M. R., Izatt J. A., Swanson E. A., Huang D., Schuman J. S., Lin C. P., Fujimoto J. G., “Optical coherence tomography of the human retina,” Arch. Ophthalmol. 113(3), 325–332 (1995). 10.1001/archopht.1995.01100030081025 [DOI] [PubMed] [Google Scholar]
- 71.Schuman J. S., Pedut-Kloizman T., Hertzmark E., Hee M. R., Wilkins J. R., Coker J. G., Puliafito C. A., Fujimoto J. G., Swanson E. A., “Reproducibility of nerve fiber layer thickness measurements using optical coherence tomography,” Ophthalmology 103(11), 1889–1898 (1996). 10.1016/S0161-6420(96)30410-7 [DOI] [PMC free article] [PubMed] [Google Scholar]
- 72.Chen X., Hou P., Jin C., Zhu W., Luo X., Shi F., Sonka M., Chen H., “Quantitative analysis of retinal layer optical intensities on three-dimensional optical coherence tomography,” Invest. Ophthalmol. Visual Sci. 54(10), 6846–6851 (2013). 10.1167/iovs.13-12062 [DOI] [PMC free article] [PubMed] [Google Scholar]
- 73.Smith G., Atchison D. A., The Eye and Visual Optical Instruments (Cambridge University Press, 1997). [Google Scholar]
- 74.Li Y., “Encircled energy for systems of different Fresnel numbers,” Optik 63(3), 207–218 (1983). [Google Scholar]
- 75.Sheppard C. J. R., Török P., “Focal shift and the axial optical coordinate for high-aperture systems of finite Fresnel number,” J. Opt. Soc. Am. A 20(11), 2156–2162 (2003). 10.1364/JOSAA.20.002156 [DOI] [PubMed] [Google Scholar]
- 76.Born M., Wolf E., Principles of Optics, 6th (corrected) ed. (Pergamon Press, 1980). [Google Scholar]


