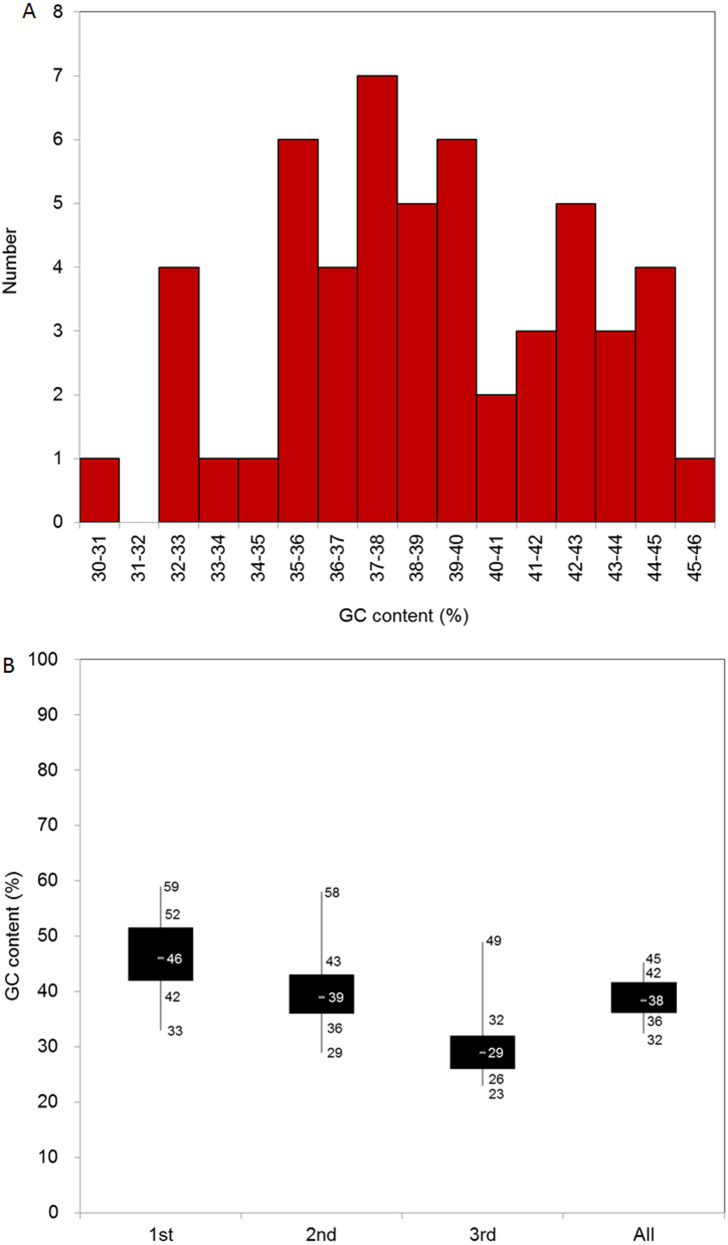
Figure 1. Base composition of D. grandiflorum cp genome.
(A) Distribution of genes with different GC contents; (B) Box plot of GC contents variation in different codon positions (1st, 2nd, 3rd and all (overall cp genome)). The numbers on the box plot from top to bottom represent GC content of the maximum, upper quartile (75%), middle quartile (50%), lower quartile (25%), and minimum, respectively.

