

Abstract
Objective
The objective of this study was to determine whether crowding influences treatment times and disposition decisions for emergency department (ED) patients.
Methods
We conducted a retrospective cohort study at 2 hospitals from January 1, 2014, to July 1, 2014. Adult ED visits with dispositions of discharge, admission, or transfer were included. Treatment times were modeled by linear regression with log‐transformation; disposition decisions (admission or transfer vs discharge) were modeled by logistic regression. Both models adjusted for chief complaint, Emergency Severity Index (ESI), and 4 crowding metrics in quartiles: waiting count, treatment count, boarding count, and National Emergency Department Overcrowding Scale.
Results
We included 21,382 visits at site A (12.9% excluded) and 29,193 at site B (15.0% excluded). Respective quartiles of treatment count increased treatment times by 7.1%, 10.5%, and 13.3% at site A (P < 0.001) and by 4.0%, 6.5%, and 10.2% at site B (P < 0.001). The fourth quartile of treatment count increased estimates of treatment time for patients with chest pain and ESI level 2 from 2.5 to 2.9 hours at site A (20 minutes) and from 3.0 to 3.3 hours at site B (18 minutes). Treatment times decreased with quartiles of waiting count by 5.6%, 7.2%, and 7.3% at site B (P < 0.001). Odds of admission or transfer increased with quartiles of waiting count by 8.7%, 9.6%, and 20.3% at site A (P = 0.011) and for the third (11.7%) and fourth quartiles (27.3%) at site B (P < 0.001).
Conclusions
Local crowding influenced ED treatment times and disposition decisions at 2 hospitals after adjusting for chief complaint and ESI.
Keywords: crowding, efficiency, emergency departments, hospitalization, length of stay, log‐linear models, logistic regression
1. INTRODUCTION
1.1. Background
Emergency department (ED) crowding is a widespread problem that occurs in health care systems around the world 1 , 2 , 3 and leads to adverse outcomes such as increased mortality, 4 , 5 , 6 , 7 , 8 , 9 decreased access to care, 10 , 11 , 12 , 13 , 14 , 15 and treatment delays. 16 , 17 , 18 , 19 The system dynamics governing interrelationships between ED crowding metrics are not fully understood, and further elucidating these relationships may guide planning and interventions to mitigate the deleterious effects of crowding.
Research on ED crowding remains a challenge because no criterion standard exists to define crowding. 20 Crowding may be framed as a multidimensional phenomenon or it may be broken down into input‐throughput‐output components as characterized by a widely adopted conceptual model. 21 Various crowding metrics have been used that can be subdivided into count‐based metrics (eg, waiting count, boarding count) and time‐based metrics (eg, waiting time, boarding time). 22 Multidimensional metrics for ED crowding have also been derived and validated, including the National Emergency Department Overcrowding Scale (NEDOCS). 23 A shared vocabulary to measure ED crowding was developed by the ED Benchmarking Alliance, with key time stamps and time intervals that collectively encompass the scope of ED visits in granular detail. 24
Reflecting this heterogenous definition, previous research on system dynamics in ED crowding adopted diverse outcome measures and used diverse statistical approaches. Several studies investigated the relationship between overall ED length of stay and other operational metrics, generally concluding that length of stay increased with both ED crowding metrics 25 , 26 , 27 , 28 , 29 , 30 as well as hospital crowding metrics. 25 , 31 , 32 , 33 , 34 Asaro et al 25 divided length of stay into its constituent elements of waiting time, treatment time, and boarding time and then estimated linear regression models that controlled for clinical characteristics. They found that length of stay, waiting time, and boarding time increased with crowding, yet treatment time did not. McCarthy et al 27 reached similar conclusions using similar covariates and outcome measures, but used different statistical methods with discrete‐time survival analysis. Wickman et al 28 controlled for chief complaint and acuity level, finding that the impact of crowding on length of stay varied among chief complaints.
At least 2 studies investigated the relationship between ED crowding and disposition decision: 30 , 35 Michelson et al 35 found that increasing ED crowding, defined by the occupancy rate, was associated with decreased likelihood of hospital admission in a pediatric ED. Chiu et al 30 reached a different conclusion, finding that ED crowding was associated with increased likelihood of hospital admission.
From these past studies, it appeared that the association between ED crowding and overall length of stay was well established but that opportunity existed to further characterize the interrelationships between crowding, treatment times, and disposition decisions.
1.2. Importance
Those managing patient flow, including medical directors, charge nurses, and attending physicians, should be aware of the complex relationships between factors influencing patient flow. Understanding associations between different operational metrics may facilitate the development and implementation of capacity management plans. It may also aid the creation of ED crowding models that predict the system's response to stress 36 and allow for early interventions to prevent anticipated declines in throughput.
The Bottom Line
In a retrospective review of 50,000 emergency department visits in 2 emergency departments, emergency department crowding negatively affected treatment times and dispositions. After adjusting for chief complaint and triage acuity level, as more patients were evaluated and managed simultaneously, treatment times increased for other patients, particularly those with chest pain and abdominal pain. Increases in waiting were associated with increased likelihood of admission or transfer.
1.3. Goals of this investigation
Our objective was to determine whether ED crowding affects patients’ treatment times and disposition decisions after controlling for chief complaint and triage acuity level. We hypothesize that ED crowding, measured at the time of a patient's placement in bed for treatment, will increase treatment times after adjusting for other factors. We further hypothesize that ED crowding, measured at the time of a patient's care completion, will decrease the likelihood of hospital admission.
2. METHODS
2.1. Study design and setting
We conducted a retrospective cohort study of operational data from ED visits at 2 study sites during the 6‐month interval from January 1, 2014, to July 1, 2014. Site A is a 32‐bed adult ED at an urban, academic level 1 trauma center with ≈60,000 annual ED visits and 596 inpatient beds. The ED capacity at site A includes 8 fast‐track beds, which are open from 9 am to 9 pm, and 12 critical care beds. Site B is a 45‐bed ED for adults and children at an urban, safety‐net county hospital that primarily serves socioeconomically vulnerable populations. Site B provides ≈85,000 ED visits annually with an inpatient capacity of 201 beds. Site B includes 7 fast‐track beds, which are staffed 24 hours per day by nurse practitioners and physician assistants, as well as 4 critical care beds staffed by emergency medicine faculty and residents.
The study was approved with waiver of informed consent by the local institutional review board. We conducted this work in accordance with the Strengthening the Reporting of Observational Studies in Epidemiology guidelines for observational research. 37
2.2. Selection of participants
Visits by adult ED patients aged 18 years and older were included in the primary data analysis when the final disposition was admission, discharge, or transfer. Multiple separate ED visits by individual patients were permitted. Visits were excluded if the patient left without being seen, left against medical advice, or expired (Figure 1). This exclusion was based on the rationale that analyzing treatment times and dispositions would not be meaningful when patients did not complete their intended ED courses. Visits were also excluded when missing data precluded calculation of necessary data elements, as defined in the Measurements and Outcomes sections.
FIGURE 1.
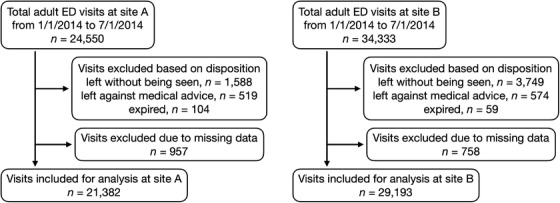
Flow diagram of included and excluded emergency department (ED) visits
Even when excluded from the primary data analysis, all ED patients were included when calculating crowding metrics, regardless of age or disposition, because these metrics must reflect all contemporaneous ED patients to avoid bias. At site A, children with major trauma were included in crowding metrics for the adult ED because pediatric trauma patients share resources with adult patients. Other children were not included in the crowding metrics because they are treated in a separate pediatric ED with dedicated staff and resources. At site B, all adults and children were included when calculating ED crowding metrics because they share resources regardless of the reason for visit.
2.3. Measurements
Data were obtained from electronic medical record systems at each hospital. Site A used software from Cerner Corporation (Kansas City, MO) and site B used software from Epic Systems Corporation (Verona, WI).
We adopted vocabulary from the ED Benchmarking Alliance for this work: 24 patients in the time span from arrival to roomed time are waiting, patients in the time span from roomed time to disposition decision are in treatment, and patients in the time span from disposition decision to departure are boarding if the chosen disposition was admission or transfer. The waiting, treatment, and boarding groups were mutually exclusive by this definition. At any time, most ED patients belonged to one of these groups, except for patients with dispositions selected other than admission or transfer who have yet to physically depart. The waiting count, treatment count, and boarding count were used as ED crowding metrics, defined by the number of patients within each group.
For each included ED visit, the following measurements were obtained: dates and times of arrival, patient roomed time, disposition decision, and departure; waiting time and treatment time in hours; chief complaint; the Emergency Severity Index (ESI); 38 and final disposition. The following 4 ED crowding metrics were calculated at 2 timepoints during each visit (at the time of bed placement and again at the time of care completion): the waiting count, treatment count, boarding count, and NEDOCS. 23 The NEDOCS is a composite metric of ED crowding that incorporates variables such as the number of boarding patients and the waiting time of the most recently roomed patient to obtain a score reflecting overall crowding conditions.
At each site, chief complaints were documented by the triage nurse using prespecified coding parameters; however, these codes differed between site A (182 options) and site B (581 options). For the purposes of this study, chief complaints were grouped according to the bundle of services anticipated to be necessary rather than categorizing them by organ system similar to previously described classifications. 39 This was necessary, due to the high cardinality and similarity between chief complaints, to make statistical analysis more feasible. Our goal was to group together chief complaints that were most similar in terms of resource use, with the intent of reducing heterogeneity of treatment times and dispositions within each group. For example, we would place chief complaints of “abdominal pain” and “vomiting” in separate groups because of the greater probability that “abdominal pain” would require complex resources such as advanced imaging or surgical consultation. The chief complaint groupings were determined by consensus between 3 of the authors (N.H., D.R., Y.C.), all of whom practice emergency medicine at both study sites. This reduced the total number of chief complaints to 25 common reasons for ED presentation. The chief complaint group mappings are shown in Appendixes 1 and 2.
2.4. Outcomes
There were 2 dependent variables of interest in this research: treatment time and ED disposition. Treatment times were measured in hours, defined for each patient as the time elapsed between bed placement and care completion. Disposition had 6 possible assigned values: admitted, discharged, expired, left against medical advice, left without being seen, or transferred.
2.5. Data analysis
Descriptive statistics were calculated using counts and percentages for categorical data and means with standard deviations or medians with interquartile ranges for numeric data.
The primary data analysis consisted of 2 multivariable regression models estimated at each study site using all ED visits meeting the inclusion criteria. The first model used ED treatment time as the dependent variable, which was log‐transformed to account for the right‐skewed nature of service time distributions. The independent variables in the model were waiting count, treatment count, boarding count, and NEDOCS at the time of bed placement, discretized into quartiles. 24 We fitted linear regression models to analyze ED treatment times after adjusting for covariates. Exponentiated coefficients and 95% confidence intervals were interpreted to assess the relative effects of each covariate on treatment times.
The second model used ED disposition as the dependent variable, and for the purpose of logistic regression, admission and transfer were assigned the value of 1, and discharge was assigned the value of 0. The independent variables were waiting count, treatment count, boarding count, and NEDOCS at the time of care completion, discretized into quartiles. 24 We fitted logistic regression models to analyze the relationship between disposition decisions and the covariates expressed in terms of odds ratios with 95% confidence intervals.
Both models adjusted for recoded chief complaints and ESI as anticipated confounding variables. We analyzed categorical data using dummy coding in both models, with the following reference categories: “simple complaint” for recoded chief complaints, level 3 for ESI, and the lowest quartile for each crowding metric.
The significance of each covariate was assessed using the Wald test with an α level of 0.05. The variance inflation factor was used to assess for multicollinearity between the covariates in each model. All statistical analyses were performed using R (version 4.0.2; http://www.r-project.org).
3. RESULTS
3.1. Characteristics of study subjects
At site A during the study period, 24,550 adult ED visits occurred, of which 21,382 were included in the analysis (9.0% excluded based on disposition and 3.9% due to missing data). At site B, 34,333 adult ED visits occurred, of which 29,193 were included in the analysis (12.8% excluded based on disposition and 2.2% due to missing data). Basic characteristics of the study population are shown in Table 1. The most common chief complaints at site A were minor trauma (16.5%), abdominal pain (9.5%), and extremity pain (8.4%). The most common chief complaints at site B were abdominal pain (12.2%), generalized illness (8.1%), and chest pain (7.2%). The median and interquartile range of treatment time was 2.7 hours (1.6–4.3 hours) at site A and 3.0 hours (1.5–5.2 hours) at site B. The hospital admission rate was 34.8% at site A and 20.9% at site B. Descriptive statistics for the ED crowding metrics at both sites are presented in Table 2.
TABLE 1.
Descriptive statistics of the included emergency department population at both sites
| Site A, n = 21,382 visits | Site B, n = 29,193 visits | |
|---|---|---|
| Chief complaint | ||
| Abdominal pain | 2022 (9.5) | 3568 (12.2) |
| Chest pain | 1484 (6.9) | 2113 (7.2) |
| Generalized illness | 1168 (5.5) | 2363 (8.1) |
| Pain, extremity | 1794 (8.4) | 1864 (6.4) |
| Trauma, minor | 3528 (16.5) | 1733 (5.9) |
| ESI | ||
| Level 1 | 593 (2.8) | 153 (0.5) |
| Level 2 | 6589 (30.8) | 8576 (29.4) |
| Level 3 | 11537 (54.0) | 13705 (46.9) |
| Level 4 | 2344 (11.0) | 6084 (20.8) |
| Level 5 | 319 (1.5) | 675 (2.3) |
| Disposition | ||
| Admission | 7448 (34.8) | 6089 (20.9) |
| Discharge | 13830 (64.7) | 22846 (78.3) |
| Transfer | 104 (0.5) | 258 (0.9) |
| Process metrics | ||
| Waiting time, hours | 0.3 (0.1–1.2) | 1.6 (0.2–4.6) |
| Treatment time, hours | 2.7 (1.6–4.3) | 3.0 (1.5–5.2) |
| Boarding time, hours | 1.7 (1.0–2.8) | 6.1 (3.0–12.4) |
Categorical data are shown as counts with percentages in parentheses. Numeric data are shown as medians with interquartile ranges in parentheses. The 5 most frequent recoded chief complaints, of 25 total, are shown. ESI, Emergency Severity Index.
TABLE 2.
Descriptive statistics of emergency department crowding metrics at both sites, calculated at hourly intervals throughout the study period
| Site A, n = 4334 hours | Site B, n = 4334 hours | |
|---|---|---|
| Waiting count, n | 7.1 ± 6.4 | 30.6 ± 21.5 |
| Treatment count, n | 17.6 ± 5.1 | 29.4 ± 8.1 |
| Boarding count, n | 4.6 ± 2.7 | 13.7 ± 5.8 |
| NEDOCS | 83.0 ± 30.6 | 184.2 ± 85.9 |
Data are provided as mean ± standard deviation. NEDOCS, National Emergency Department Overcrowding Scale.
3.2. Main results
A multivariable regression of log‐transformed treatment times showed that increasing treatment counts were associated with longer treatment times at both sites (P < 0.001 at sites A and B); this relationship increased with each quartile (for Q2, Q3, and Q4, respectively, at site A, exp(β) = 1.071, 1.105, 1.133; at site B, exp(β) = 1.040, 1.065, 1.102). Therefore, as more patients were evaluated and managed simultaneously, treatment times increased for other patients. At site B only, there was an inverse association between treatment times and waiting counts, which decreased with each quartile of the waiting count (for Q2, Q3, Q4, respectively, exp(β) = 0.944, 0.928, 0.927; P < 0.001); in other words, longer waiting room queues were associated with decreasing treatment times. At site B only, increases in the NEDOCS were associated with decreasing treatment times (for Q2, Q3, Q4, respectively, exp(β) = 0.960, 0.955, 0.939; P = 0.010). The other crowding metrics did not influence treatment times. Full results of this analysis of log‐transformed treatment times are presented in Table 3.
TABLE 3.
Results from the linear regression of log‐transformed treatment times
| Site A | Site B | |||||
|---|---|---|---|---|---|---|
| exp(β) | 95% CI | P Value | exp(β) | 95% CI | P Value | |
| Intercept | 1.806 | 1.698–1.921 | <0.001 | 2.127 | 2.015–2.245 | <0.001 |
| Waiting count | 0.433 | <0.001 | ||||
| First quartile | (Reference category) | (Reference category) | ||||
| Second quartile | 0.980 | 0.951–1.010 | 0.944 | 0.917–0.971 | ||
| Third quartile | 0.972 | 0.940–1.006 | 0.928 | 0.901–0.956 | ||
| Fourth quartile | 0.978 | 0.944–1.014 | 0.927 | 0.898–0.957 | ||
| Treatment count | < 0.001 | <0.001 | ||||
| First quartile | (Reference category) | (Reference category) | ||||
| Second quartile | 1.071 | 1.040–1.102 | 1.040 | 1.010–1.070 | ||
| Third quartile | 1.105 | 1.070–1.141 | 1.065 | 1.034–1.096 | ||
| Fourth quartile | 1.133 | 1.095–1.172 | 1.102 | 1.068–1.136 | ||
| Boarding count | 0.437 | 0.586 | ||||
| First quartile | (Reference category) | (Reference category) | ||||
| Second quartile | 1.006 | 0.975–1.038 | 1.004 | 0.975–1.034 | ||
| Third quartile | 1.007 | 0.979–1.036 | 1.005 | 0.972–1.038 | ||
| Fourth quartile | 1.027 | 0.994–1.060 | 0.983 | 0.945–1.022 | ||
| NEDOCS | 0.946 | 0.010 | ||||
| First quartile | (Reference category) | (Reference category) | ||||
| Second quartile | 1.008 | 0.976–1.040 | 0.960 | 0.931–0.989 | ||
| Third quartile | 1.005 | 0.969–1.041 | 0.955 | 0.923–0.988 | ||
| Fourth quartile | 1.001 | 0.960–1.042 | 0.939 | 0.903–0.976 | ||
| Chief complaint | <0.001 | <0.001 | ||||
| Abdominal pain | 1.759 | 1.648–1.878 | 1.860 | 1.763–1.963 | ||
| Acute hemorrhage | 1.219 | 1.094–1.358 | 1.206 | 1.072–1.357 | ||
| All others | 1.332 | 1.249–1.421 | 1.414 | 1.344–1.487 | ||
| Altered mental status | 1.661 | 1.514–1.822 | 1.535 | 1.384–1.702 | ||
| Cardiovascular problem | 1.256 | 1.137–1.387 | 1.098 | 0.999–1.206 | ||
| Chest pain | 1.228 | 1.147–1.314 | 1.187 | 1.119–1.258 | ||
| Dialysis evaluation | N/A | N/A | 2.297 | 2.128–2.480 | ||
| ENT problem | 1.247 | 1.132–1.374 | 1.070 | 0.989–1.158 | ||
| Fever | 1.390 | 1.279–1.510 | 1.362 | 1.264–1.469 | ||
| Gastrointestinal problem | 1.743 | 1.609–1.887 | 1.753 | 1.621–1.896 | ||
| Generalized illness | 1.552 | 1.445–1.666 | 1.446 | 1.366–1.531 | ||
| Genitourinary problem | 1.571 | 1.462–1.687 | 1.607 | 1.513–1.707 | ||
| Headache | 1.468 | 1.349–1.597 | 1.417 | 1.317–1.525 | ||
| Neurologic deficit | 1.023 | 0.940–1.113 | 1.188 | 1.070–1.320 | ||
| Ocular complaint | 1.332 | 1.212–1.464 | 1.615 | 1.460–1.786 | ||
| Pain (extremity) | 1.314 | 1.232–1.402 | 1.472 | 1.390–1.559 | ||
| Pain (spine) | 1.400 | 1.296–1.514 | 1.320 | 1.232–1.415 | ||
| Psychiatric disturbance | 2.154 | 1.932–2.401 | 2.422 | 2.170–2.702 | ||
| Respiratory problem | 1.167 | 1.059–1.285 | 1.181 | 1.091–1.277 | ||
| Seizure | 1.606 | 1.453–1.775 | 1.588 | 1.424–1.770 | ||
| Shortness of breath | 1.363 | 1.265–1.467 | 1.307 | 1.224–1.396 | ||
| Simple complaint | (Reference category) | (Reference category) | ||||
| Toxic exposure | 1.682 | 1.446–1.955 | 2.266 | 1.939–2.649 | ||
| Trauma (major) | 1.138 | 1.057–1.226 | 1.486 | 1.378–1.601 | ||
| Trauma (minor) | 1.295 | 1.218–1.376 | 1.331 | 1.254–1.413 | ||
| ESI | <0.001 | <0.001 | ||||
| Level 1 | 0.514 | 0.482–0.549 | 0.482 | 0.419–0.555 | ||
| Level 2 | 1.143 | 1.116–1.171 | 1.183 | 1.153–1.215 | ||
| Level 3 | (Reference category) | (Reference category) | ||||
| Level 4 | 0.491 | 0.474–0.509 | 0.590 | 0.572–0.608 | ||
| Level 5 | 0.339 | 0.312–0.369 | 0.366 | 0.340–0.394 | ||
Shown are exponentiated coefficients, including 95% CIs and corresponding P values by the Wald test. The intercept estimates the treatment time in hours for patients with a chief complaint of “simple complaint” and ESI level of 3, with each crowding metric in the lowest interval. Other coefficients represent the estimated multiplicative or percentage change in treatment times associated with each factor. CI, confidence interval; ENT, ear/nose/throat; ESI, Emergency Severity Index; N/A, not applicable; NEDOCS, National Emergency Department Overcrowding Scale.
At both sites, the logistic regression of disposition decisions showed that the odds ratio (OR) of admission or transfer increased with each quartile of the waiting count (for Q2, Q3, Q4, respectively, at site A, OR = 1.087, 1.096, 1.203 and P = 0.011; at site B, OR = 0.968, 1.117, 1.273 and P < 0.001). Other crowding metrics were not significantly associated with disposition decisions. Full results of this analysis are presented in Table 4.
TABLE 4.
Results from the logistic regression of disposition decisions
| Site A | Site B | |||||
|---|---|---|---|---|---|---|
| exp(β) | 95% CI | P Value | exp(β) | 95% CI | P Value | |
| Intercept | 0.084 | 0.062–0.113 | <0.001 | 0.058 | 0.044–0.076 | <0.001 |
| Waiting count | 0.011 | <0.001 | ||||
| First quartile | (Reference category) | (Reference category) | ||||
| Second quartile | 1.087 | 0.980–1.205 | 0.968 | 0.882–1.062 | ||
| Third quartile | 1.096 | 0.982–1.223 | 1.117 | 1.017–1.227 | ||
| Fourth quartile | 1.203 | 1.077–1.345 | 1.273 | 1.155–1.403 | ||
| Treatment count | 0.131 | 0.225 | ||||
| First quartile | (Reference category) | (Reference category) | ||||
| Second quartile | 1.102 | 0.991–1.225 | 1.092 | 0.994–1.200 | ||
| Third quartile | 1.144 | 1.021–1.281 | 1.088 | 0.994–1.192 | ||
| Fourth quartile | 1.088 | 0.969–1.222 | 1.059 | 0.963–1.164 | ||
| Boarding count | 0.798 | 0.135 | ||||
| First quartile | (Reference category) | (Reference category) | ||||
| Second quartile | 0.960 | 0.865–1.064 | 0.927 | 0.847–1.015 | ||
| Third quartile | 0.991 | 0.903–1.087 | 0.949 | 0.858–1.049 | ||
| Fourth quartile | 1.013 | 0.914–1.124 | 1.028 | 0.913–1.158 | ||
| NEDOCS | 0.177 | 0.676 | ||||
| First quartile | (Reference category) | (Reference category) | ||||
| Second quartile | 1.032 | 0.922–1.156 | 0.996 | 0.905–1.096 | ||
| Third quartile | 0.989 | 0.874–1.120 | 1.008 | 0.907–1.121 | ||
| Fourth quartile | 1.095 | 0.955–1.255 | 0.951 | 0.842–1.075 | ||
| Chief complaint | <0.001 | <0.001 | ||||
| Abdominal pain | 3.591 | 2.668–4.903 | 4.770 | 3.666–6.307 | ||
| Acute hemorrhage | 3.989 | 2.698–5.945 | 4.794 | 3.268–7.059 | ||
| All others | 3.477 | 2.578–4.757 | 3.876 | 2.978–5.125 | ||
| Altered mental status | 6.142 | 4.271–8.945 | 5.384 | 3.848–7.613 | ||
| Cardiovascular problem | 2.577 | 1.771–3.779 | 2.760 | 1.949–3.932 | ||
| Chest pain | 4.554 | 3.373–6.236 | 5.617 | 4.295–7.458 | ||
| Dialysis evaluation | N/A | N/A | 0.799 | 0.579–1.112 | ||
| ENT problem | 3.854 | 2.569–5.800 | 1.369 | 0.844–2.171 | ||
| Fever | 4.635 | 3.289–6.600 | 4.574 | 3.370–6.277 | ||
| Gastrointestinal problem | 3.308 | 2.379–4.653 | 4.605 | 3.393–6.320 | ||
| Generalized illness | 4.297 | 3.165–5.913 | 4.684 | 3.585–6.214 | ||
| Genitourinary problem | 1.067 | 0.767–1.500 | 1.521 | 1.131–2.069 | ||
| Headache | 1.838 | 1.289–2.642 | 1.820 | 1.309–2.547 | ||
| Neurologic deficit | 7.737 | 5.490–11.040 | 4.049 | 2.801–5.879 | ||
| Ocular complaint | 1.192 | 0.805–1.771 | 1.586 | 1.017–2.449 | ||
| Pain (extremity) | 4.273 | 3.151–5.875 | 3.033 | 2.240–4.150 | ||
| Pain (spine) | 2.509 | 1.736–3.648 | 2.169 | 1.520–3.102 | ||
| Psychiatric disturbance | 1.528 | 1.010–2.319 | 1.435 | 0.960–2.140 | ||
| Respiratory problem | 2.150 | 1.416–3.266 | 3.637 | 2.619–5.091 | ||
| Seizure | 2.027 | 1.383–2.989 | 1.200 | 0.807–1.782 | ||
| Shortness of breath | 5.357 | 3.917–7.424 | 6.205 | 4.705–8.302 | ||
| Simple complaint | (Reference category) | (Reference category) | ||||
| Toxic exposure | 2.434 | 1.474–4.026 | 2.083 | 1.278–3.360 | ||
| Trauma (major) | 6.426 | 4.681–8.939 | 2.499 | 1.823–3.459 | ||
| Trauma (minor) | 2.858 | 2.139–3.878 | 1.105 | 0.820–1.506 | ||
| ESI | <0.001 | <0.001 | ||||
| Level 1 | 40.934 | 28.788–60.431 | 23.698 | 15.370–37.969 | ||
| Level 2 | 4.400 | 4.097–4.726 | 3.328 | 3.104–3.570 | ||
| Level 3 | (Reference category) | (Reference category) | ||||
| Level 4 | 0.059 | 0.042–0.079 | 0.187 | 0.158–0.219 | ||
| Level 5 | 0.023 | 0.004–0.072 | 0.067 | 0.024–0.146 | ||
Shown are odds ratios, including 95% CI and corresponding P values by the Wald test. The intercept estimates the odds of admission or transfer for patients with a chief complaint of “simple complaint” and ESI level of 3, with each crowding metric in the lowest interval. Other coefficients represent the estimated multiplicative or percentage change in odds associated with each factor. CI, confidence interval; ENT, ear/nose/throat; ESI, Emergency Severity Index; N/A, not applicable; NEDOCS, National Emergency Department Overcrowding Scale.
Recoded chief complaints and ESI were significantly associated with treatment times (P < 0.001 at both sites) and disposition decisions (P < 0.001 at both sites), consistent with their anticipated roles as confounding variables. The variance inflation factor was <2.5 for all covariates in all models, so multicollinearity between crowding metrics did not appear to compromise the results.
3.3. Limitations
One limitation of this research is the fact that no criterion standard exists to define ED crowding. 22 However, quantifying crowding by the waiting count, treatment count, and boarding count is consistent with the input‐throughput‐output model of crowding, 21 and similar metrics have been used in other work. 25 , 27 The NEDOCS has been widely adopted and independently validated, 23 , 40 , 41 yet it likewise is not a criterion standard to define crowding. Two input variables for the NEDOCS—longest boarding time and waiting time of the last patient roomed—may affect the NEDOCS result to an unanticipated degree when outliers occur. Lastly, electronic medical record systems from different vendors may vary in how time stamps are defined, which may not be fully documented. Although we use electronic medical record systems from 2 vendors, we exercised caution to ensure the data at both sites matched the time stamps defined previously.
Another limitation is that this analysis was conducted at 2 urban, academic hospitals, so the results may not generalize to other sites. Although the sites had divergent traits, they also possess characteristics that may not apply to other sites. For example, site B provides a substantial amount of emergent dialysis care to patients with end‐stage renal disease who lack access to scheduled hemodialysis. Both sites hold psychiatric patients in ED treatment spaces for prolonged periods of time while awaiting hospitalization, which may not hold true for sites with dedicated psychiatric treatment spaces. Except as described in the Discussion section, neither site used a surge plan during the study interval; hospitals that alter operations in response to ED crowding, for example, by calling in additional nurses or staff, may find different results. Site B substantially revised its operations after the time period of this study due to changing community needs after Hurricane Harvey, 42 so the results at site B may no longer be replicable using current data at that site. However, it is possible that discrepant findings between sites may be attributed to differences in ED workflow, indicating meaningful differences in system dynamics.
4. DISCUSSION
We analyzed ED data from 2 dissimilar hospitals to evaluate the impact of crowding metrics on treatment times and disposition decisions while controlling for the ESI and chief complaint. The results showed associations that warrant further discussion, which may be facilitated by an explanation of how to interpret the data in Tables 3 and 4.
Due to the logarithmic transformation of treatment times, the exponentiated coefficients of the linear regression may be interpreted as a multiplicative (or percentage) change in the dependent variable. The intercept denotes the estimated treatment time in hours for patients with a chief complaint of “simple complaint” and ESI level of 3, with the lowest quartile for each crowding metric. The intercept can be multiplied by 1 or more other coefficients to calculate the effects of each factor on treatment times. For example, to estimate treatment time for patients at site A with abdominal pain and ESI level 2, one would multiply 1.806 × 1.759 × 1.143 to obtain an estimate of 3.6 hours. The odds ratios in Table 4 are interpreted similarly: the intercept represents the odds of admission or transfer versus discharge for patients with a simple complaint and ESI level of 3; the intercept may also be multiplied by other coefficients to estimate new odds given other circumstances. For the rest of the discussion, we refer to these values in terms of the percentage change estimated by each factor.
The results showed a positive association between ED treatment times and the number of patients simultaneously in treatment at both sites, which predicts a 13.3% increase in treatment times at site A and a 10.2% increase at site B when comparing the lowest and highest quartiles of treatment counts. For patients with ESI level 2 and abdominal pain, the increased crowding exposure predicts an increase in treatment time from 3.6 hours to 4.1 hours at site A (difference = 29 minutes) and from 4.7 hours to 5.2 hours at site B (difference = 29 minutes). For patients with ESI level 2 and chest pain, a similar increase in crowding exposure predicts an increase in treatment time from 2.5 to 2.9 hours at site A (difference = 20 minutes) and from 3.0 to 3.3 hours at site B (difference = 18 minutes). We explain this finding by observing that, when multiple patients need care simultaneously, this creates competing demands for necessary resources such as nursing time, physician time, and laboratory or radiology services. The results showed a negative association between ED treatment times and the waiting count at site B, an unanticipated finding. We attribute this to differences in workflow between the 2 sites: at site B, standing delegated orders for laboratory testing and basic imaging are frequently carried out while patients are in the waiting room, and this becomes increasingly common as the ED becomes crowded. Site B also employs a model of ED workflow with physician assistants and nurse practitioners in triage, 43 which by local policy will be deployed under specified crowding conditions. Therefore it is likely that, when waiting counts increase, treatment times may decrease by way of diagnostic results that were in process or completed when patients are roomed. Interpreting the relationship between the NEDOCS and treatment times at site B is more difficult in part due to the composite nature of this metric that reflects various aspects of ED operations. This finding is likely due to some aspect of crowding that was not otherwise captured by the waiting count, treatment count, and boarding count, yet was reflected in the NEDOCS.
Noting the relationship between increasing treatment counts and increasing treatment times, we suggest 2 possible interpretations. First, operational performance at these 2 sites varies across the crowding spectrum, and this may be a symptom of a stressed system. Second, this suggests an opportunity for intervention, where altering resources or workflow dynamically in response to crowding may improve stability of operations.
The analysis of disposition decisions at both sites showed that increases in the waiting count were associated with increased likelihood of admission or transfer, counter to our original hypothesis. The results predict an increase in the odds of admission or transfer by 20.3% at site A and 27.3% at site B when transitioning from the lowest to the highest quartile of waiting counts. For patients with abdominal pain and ESI level 2, this would increase the probability of admission from 57% to 61% at site A and from 48% to 54% at site B. In general, higher acuity patients are given higher priority for bed assignment in most crowding conditions (with exceptions in fast‐track areas) and are more likely to be admitted to the hospital. Our analysis does not address this specifically, but we propose that, as the number of waiting patients increases, lower acuity patients may wait longer and subsequently leave without being seen at increasing rates. Our analysis adjusted for ESI level, however, so other factors may account for this finding. It is possible that, during times of low crowding, ED physicians have more opportunity to offer definitive care to complex patients with the goal of providing a safe discharge, yet during times of high crowding, ED physicians might transition care to admitting teams more quickly to aid throughput. An example of such behavior would occur if a patient with intractable vomiting received additional rounds of antiemetic therapy, with the intent of achieving tolerance of oral intake followed by discharge, which may have been less feasible with a crowded waiting room.
We selected independent variables based on ED crowding metrics that were “non‐flow” measures (ie, patient counts) rather than “flow” measures (ie, time intervals). 22 We acknowledge that both types of crowding metrics offer useful perspectives. Our reason for not including both flow and non‐flow crowding metrics was that collinearity was expected to exist if, for example, both waiting counts and waiting times were included as independent variables in the model. This would be expected to adversely impact the mathematical assumptions of each regression model and might yield misleading results.
In summary, this analysis showed that ED treatment times increased with the treatment count at 2 sites. At site B, treatment times decreased when the waiting count and the NEDOCS increased. At both sites, the likelihood of hospital admission increased with the waiting count. It is unknown how these findings would generalize to other sites; however, the principle of reasoning about workflow in terms of system dynamics may help leaders tailor responses to ED crowding according to the needs of each hospital.
CONFLICT OF INTEREST
The authors declare no conflict of interest.
AUTHOR CONTRIBUTIONS
The study idea was originally conceived by Nathan R. Hoot and was further developed with Benjamin W. Voronin and Kimberly A. Chambers. The technique for consolidating chief complaints was developed by Nathan R. Hoot, David J. Robinson, and Yashwant Chathampally. All statistical analyses were performed by Nathan R. Hoot and Rosa C. Banuelos. The article was drafted by Nathan R. Hoot and Kimberly A. Chambers. All authors reviewed the article for important intellectual content and approved the final version. Nathan R. Hoot takes responsibility for this work as a whole.
Supporting information
Supporting Information
ACKNOWLEDGMENTS
The first author was supported by an Emergency Medicine Foundation Career Development Grant.
Biography
Nathan R. Hoot, MD, PhD is an Associate Professor of Emergency Medicine at the McGovern Medical School at the University of Texas Health Science Center at Houston, Houston, TX.

Hoot NR, Banuelos RC, Chathampally Y, Robinson DJ, Voronin BW, Chambers KA. Does crowding influence emergency department treatment time and disposition? JACEP Open. 2021;2:e12324 10.1002/emp2.12324
Funding and support: By JACEP Open policy, all authors are required to disclose any and all commercial, financial, and other relationships in any way related to the subject of this article as per ICMJE conflict of interest guidelines (see www.icmje.org). The authors have stated that no such relationships exist.
Supervising Editor: Chadd K. Kraus, DO, DrPH.
REFERENCES
- 1. Committee on the Future of Emergency Care in the United States Health System. Hospital‐Based Emergency Care: at the Breaking Point. Washington, D.C: National Academies Press, 2006. [Google Scholar]
- 2. Hoot NR, Aronsky D. Systematic review of emergency department crowding: causes, effects, and solutions. Ann Emerg Med. 2008;52(2):126‐136. [DOI] [PMC free article] [PubMed] [Google Scholar]
- 3. Morley C, Unwin M, Peterson GM, Stankovich J, Kinsman L. Emergency department crowding: a systematic review of causes, consequences and solutions. PLoS One. 2018;13(8):e0203316. [DOI] [PMC free article] [PubMed] [Google Scholar]
- 4. Begley CE, Chang Y, Wood RC, Weltge A. Emergency department diversion and trauma mortality: evidence from Houston Texas. J Trauma. 2004;57(6):1260‐1265. [DOI] [PubMed] [Google Scholar]
- 5. Guttmann A, Schull MJ, Vermeulen MJ, Stukel TA. Association between waiting times and short term mortality and hospital admission after departure from emergency department: population based cohort study from Ontario Canada. BMJ. 2011;342:d2983. [DOI] [PMC free article] [PubMed] [Google Scholar]
- 6. Singer AJ, Thode HC Jr, Viccellio P, Pines JM. The association between length of emergency department boarding and mortality. Acad Emerg Med. 2011;18(12):1324‐1329. [DOI] [PubMed] [Google Scholar]
- 7. Sun BC, Hsia RY, Weiss RE, et al. Effect of emergency department crowding on outcomes of admitted patients. Ann Emerg Med. 2013;61(6):605‐611. [DOI] [PMC free article] [PubMed] [Google Scholar]
- 8. McCusker J, Vadeboncoeur A, Lévesque JF, Ciampi A, Belzile E. Increases in emergency department occupancy are associated with adverse 30‐day outcomes. Acad Emerg Med. 2014;21(10):1092‐1100. [DOI] [PubMed] [Google Scholar]
- 9. Jo S, Jeong T, Jin YH, Lee JB, Yoon J, Park B. ED crowding is associated with inpatient mortality among critically ill patients admitted via the ED: post hoc analysis from a retrospective study. Am J Emerg Med. 2015;33(12):1725‐1731. [DOI] [PubMed] [Google Scholar]
- 10. Baker DW, Stevens CD, Brook RH. Patients who leave a public hospital emergency department without being seen by a physician. Causes and consequences. JAMA. 1991;266(8):1085‐1090. [PubMed] [Google Scholar]
- 11. Kyriacou DN, Ricketts V, Dyne PL, McCollough MD, Talan DA. A 5‐year time study analysis of emergency department patient care efficiency. Ann Emerg Med. 1999;34(3):326‐335. [DOI] [PubMed] [Google Scholar]
- 12. Schneider SM, Gallery ME, Schafermeyer R, Zwemer FL. Emergency department crowding: a point in time. Ann Emerg Med. 2003;42(2):167‐172. [DOI] [PubMed] [Google Scholar]
- 13. Polevoi SK, Quinn JV, Kramer NR. Factors associated with patients who leave without being seen. Acad Emerg Med. 2005;12(3):232‐236. [DOI] [PubMed] [Google Scholar]
- 14. Weiss SJ, Ernst AA, Derlet R, King R, Bair A, Nick TG. Relationship between the National ED Overcrowding Scale and the number of patients who leave without being seen in an academic ED. Am J Emerg Med. 2005;23(3):288‐294. [DOI] [PubMed] [Google Scholar]
- 15. Burt CW, McCaig LF, Valverde RH. Analysis of ambulance transports and diversions among US emergency departments. Ann Emerg Med. 2006;47(4):317‐326. [DOI] [PubMed] [Google Scholar]
- 16. Pines JM, Hollander JE, Localio AR, Metlay JP. The association between emergency department crowding and hospital performance on antibiotic timing for pneumonia and percutaneous intervention for myocardial infarction. Acad Emerg Med. 2006;13(8):873‐878. [DOI] [PubMed] [Google Scholar]
- 17. Hwang U, Richardson LD, Sonuyi TO, Morrison RS. The effect of emergency department crowding on the management of pain in older adults with hip fracture. J Am Geriatr Soc. 2006;54(2):270‐275. [DOI] [PubMed] [Google Scholar]
- 18. Pines JM, Hollander JE. Emergency department crowding is associated with poor care for patients with severe pain. Ann Emerg Med. 2008;51(1):1‐5. [DOI] [PubMed] [Google Scholar]
- 19. Gaieski DF, Agarwal AK, Mikkelsen ME, et al. The impact of ED crowding on early interventions and mortality in patients with severe sepsis. Am J Emerg Med. 2017;35(7):953‐960. [DOI] [PubMed] [Google Scholar]
- 20. Solberg LI, Asplin BR, Weinick RM, Magid DJ. Emergency department crowding: consensus development of potential measures. Ann Emerg Med. 2003;42(6):824‐834. [DOI] [PubMed] [Google Scholar]
- 21. Asplin BR, Magid DJ, Rhodes KV, Solberg LI, Lurie N. A conceptual model of emergency department crowding. Ann Emerg Med. 2003;42(2):173‐180. [DOI] [PubMed] [Google Scholar]
- 22. Hwang U, McCarthy ML, Aronsky D, et al. Measures of crowding in the emergency department: a systematic review. Acad Emerg Med. 2011;18(5):527‐538. [DOI] [PubMed] [Google Scholar]
- 23. Weiss SJ, Derlet R, Arndahl J, et al. Estimating the degree of emergency department overcrowding in academic medical centers: results of the National ED Overcrowding Study (NEDOCS). Acad Emerg Med. 2004;11(1):38‐50. [DOI] [PubMed] [Google Scholar]
- 24. Yiadom MYAB, Napoli A, Granovsky M, et al. Managing and measuring emergency department care: results of the fourth emergency department benchmarking definitions summit. Acad Emerg Med. 2020;27(7):600‐611. [DOI] [PubMed] [Google Scholar]
- 25. Asaro PV, Lewis LM, Boxerman SB. The impact of input and output factors on emergency department throughput. Acad Emerg Med. 2007;14(3):235‐242. [DOI] [PubMed] [Google Scholar]
- 26. Schull MJ, Kiss A, Szalai JP. The effect of low‐complexity patients on emergency department waiting times. Ann Emerg Med. 2007;49(3):257‐264. [DOI] [PubMed] [Google Scholar]
- 27. McCarthy ML, Zeger SL, Ding R, et al. Crowding delays treatment and lengthens emergency department length of stay, even among high‐acuity patients. Ann Emerg Med. 2009;54(4):492‐503. [DOI] [PubMed] [Google Scholar]
- 28. Wickman L, Svensson P, Djärv T. Effect of crowding on length of stay for common chief complaints in the emergency department: a STROBE cohort study. Medicine (Baltimore). 2017;96(44):e8457. [DOI] [PMC free article] [PubMed] [Google Scholar]
- 29. Perdahl T, Axelsson S, Svensson P, Djärv T. Patient and organizational characteristics predict a long length of stay in the emergency department—a Swedish cohort study. Eur J Emerg Med. 2017;24(4):284‐289. [DOI] [PubMed] [Google Scholar]
- 30. Chiu IM, Lin YR, Syue YJ, Kung CT, Wu KH, Li CJ. The influence of crowding on clinical practice in the emergency department. Am J Emerg Med. 2018;36(1):56‐60. [DOI] [PubMed] [Google Scholar]
- 31. Rathlev NK, Chessare J, Olshaker J, et al. Time series analysis of variables associated with daily mean emergency department length of stay. Ann Emerg Med. 2007;49(3):265‐271. [DOI] [PubMed] [Google Scholar]
- 32. Hillier DF, Parry GJ, Shannon MW, Stack AM. The effect of hospital bed occupancy on throughput in the pediatric emergency department. Ann Emerg Med. 2009;53(6):767‐776. [DOI] [PubMed] [Google Scholar]
- 33. Lucas R, Farley H, Twanmoh J, et al. Emergency department patient flow: the influence of hospital census variables on emergency department length of stay. Acad Emerg Med. 2009;16(7):597‐602. [DOI] [PubMed] [Google Scholar]
- 34. White BA, Biddinger PD, Chang Y, Grabowski B, Carignan S, Brown DF. Boarding inpatients in the emergency department increases discharged patient length of stay. J Emerg Med. 2013;44(1):230‐235. [DOI] [PubMed] [Google Scholar]
- 35. Michelson KA, Monuteaux MC, Stack AM, Bachur RG. Pediatric emergency department crowding is associated with a lower likelihood of hospital admission. Acad Emerg Med. 2012;19(7):816‐820. [DOI] [PubMed] [Google Scholar]
- 36. Hoot NR, LeBlanc LJ, Jones I, et al. Forecasting emergency department crowding: a discrete event simulation. Ann Emerg Med. 2008;52(2):116‐125. [DOI] [PMC free article] [PubMed] [Google Scholar]
- 37. von Elm E, Altman DG, Egger M, et al. The Strengthening the Reporting of Observational Studies in Epidemiology (STROBE) statement: guidelines for reporting observational studies. Lancet. 2007;370(9596):1453‐1457. [DOI] [PubMed] [Google Scholar]
- 38. Wuerz RC, Milne LW, Eitel DR, Travers D, Gilboy N. Reliability and validity of a new five‐level triage instrument. Acad Emerg Med. 2000;7(3):236‐242. [DOI] [PubMed] [Google Scholar]
- 39. Schneider D, Appleton L, McLemore T. A reason for visit classification for ambulatory care. Vital Health Stat 2. 1979(78):i‐63. [PubMed] [Google Scholar]
- 40. Jones SS, Allen TL, Flottemesch TJ, Welch SJ. An independent evaluation of four quantitative emergency department crowding scales. Acad Emerg Med. 2006;13(11):1204‐1211. [DOI] [PubMed] [Google Scholar]
- 41. Hoot NR, Zhou C, Jones I, Aronsky D. Measuring and forecasting emergency department crowding in real time. Ann Emerg Med. 2007;49(6):747‐755. [DOI] [PMC free article] [PubMed] [Google Scholar]
- 42. Chambers K, Rogg J, Sharma K, Vierling A. How Hurricane Harvey spurred a Houston hospital to rethink emergency care. Harvard Business Review. https://hbr.org/2018/05/how-hurricane-harvey-spurred-a-houston-hospital-to-rethink-emergency-care. Published May 7, 2018. Accessed June 15, 2020.
- 43. Han JH, France DJ, Levin SR, Jones ID, Storrow AB, Aronsky D. The effect of physician triage on emergency department length of stay. J Emerg Med. 2010;39(2):227‐233. [DOI] [PubMed] [Google Scholar]
Associated Data
This section collects any data citations, data availability statements, or supplementary materials included in this article.
Supplementary Materials
Supporting Information