Abstract
Ethanol solubilizes cell membranes, making it useful for various ablation applications. We examined the effect of time and alcohol type on the extent of ablation, quantified as Euclidean distances between color coordinates.
We obtained biopsy punch samples (diameter, 6 mm) of left atrial appendage, atrial, ventricular, and septal tissue from porcine hearts and placed them in transwell plates filled with ethanol or methanol for 10, 20, 30, 40, 50, or 60 min. Control samples were taken for each time point. At each time point, samples were collected, cut transversely, and photographed. With use of a custom MATLAB program, all images were analyzed in the CIELAB color space, which is more perceptually uniform than the red-green-blue color space. Euclidean distances were calculated from CIELAB coordinates. The mean and standard error of these distances were analyzed. Two-way analysis of variance was used to test for differences among time points, and 2-tailed t tests, for differences between the alcohol datasets at each time point.
Generally, Euclidean distances differed significantly between all time points, except for those immediately adjacent, and methanol produced larger Euclidean distances than ethanol did. Some tissue showed a plateauing effect, potentially indicating transmurality.
Mean Euclidean distances effectively indexed alcohol ablation in cardiac tissue. Furthermore, we found that methanol ablated tissue more effectively than ethanol did. With ethanol, the extent of ablation for atrial tissue was largest at 60 min. We conclude that to achieve full transmurality in clinical applications, ethanol must remain in contact with atrial tissue for at least one hour.
Keywords: Ablation techniques/methods; ethanol/therapeutic use; methanol/therapeutic use; image processing, computer-assisted
Ethanol (EtOH) is a short-chain, water-soluble alcohol that can cross cell membranes.1,2 In high concentrations, EtOH can solubilize cell membranes and ultimately cause cell death.2 This property of EtOH, among other alcohols, makes it an attractive candidate for tissue ablation. In fact, EtOH is currently used in tumor ablation and in cardiac procedures such as alcohol septal ablation (ASA).3–5 Alcohol septal ablation is used to treat hypertrophic cardiomyopathy, a condition in which blood flow is obstructed because of abnormally thick heart muscle.6 In ASA, the direct injection of absolute EtOH into the septal wall triggers cell death in cardiac tissue, thus improving blood flow.7 Through a similar mechanism, intratumoral EtOH injection has proved effective in treating hepatocellular carcinomas as well as cystic thyroid nodules.3,4
Apart from ASA and tumor ablation, alcohol may have other ablative applications, such as ablation of the left atrial appendage (LAA). The LAA is a source of the conduction defects associated with atrial fibrillation, so electrically isolating the LAA could be therapeutic.8 However, current electrical isolation methods, such as radiofrequency ablation and cryoablation, are difficult to implement in the LAA because of its irregular anatomy.9 When used as an adjunct to radiofrequency ablation, alcohol injection into the left atrium through the vein of Marshall has been shown to be safe and to reduce procedure time.10
Alcohol ablation is more cost effective than radiofrequency ablation and cryoablation. Furthermore, being a fluid, alcohol takes the shape of its container and can thus provide maximum coverage for ablation. However, there is a high risk of leakage into nontargeted parts of the heart. Therefore, alcohol should remain in the LAA only as long as necessary to ensure transmurality.
It has been assumed that the penetration rates of EtOH and methanol (MeOH) are similar because both molecules share a functional group; however, no reported evidence supports this.11 In this study, we aimed to quantify the effects of alcohol type and time on the extent of alcohol ablation in various cardiac tissues—LAA, atrium, ventricle, and septum—as an index for how long alcohol ablation procedures must last to ensure maximum transmurality.
Materials and Methods
Tissue Source
Fresh porcine hearts were purchased from Animal Technologies, Inc. (Tyler, Tex). Ethical approval was therefore not required.
Tissue Sampling
Four types of cardiac tissue—LAA, atrial, ventricular, and septal—were sampled for examination at 6 different time points: 10, 20, 30, 40, 50, and 60 min. For each tissue type, a total of 36 test samples (n=3 for EtOH and n=3 for MeOH per time point) were taken with a 6-mm-diameter biopsy punch to standardize the cross-sectional area that would be in contact with the alcohol. In addition, for each time point, one control sample of each tissue was taken with the biopsy punch.
Transwell Plate Setup
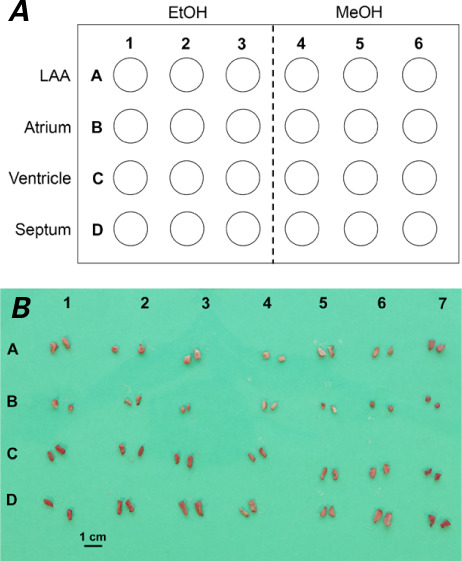
Test and control samples for each time point were placed in separate 24-well transwell plates. For test samples, the 24-well transwell plate provided the tissue-alcohol interface, as follows. First, the transwell insert was removed. Then, 12 wells of the plate were filled with 350 μL of 100% EtOH, and the other 12 wells were filled with 350 μL of 100% MeOH. Finally, the test samples were placed and organized, as shown in Figure 1A. The test and control plates were sealed with laboratory wax and placed in an incubator set at 37 °C. The test samples remained in contact with the alcohol until the applicable time point was reached. At that time, the tissue samples were removed, and excess liquid was blotted with a paper towel.
Fig. 1.

A) Graphic shows the organization of 24-well transwell plates containing test samples by tissue and alcohol type. B) Example of final digital image taken for MATLAB color space analysis. The organization of samples corresponds to that of the transwell plate in A, with the addition of control samples in the 7th column.
EtOH = ethanol; LAA = left atrial appendage; MeOH = methanol
Then, a straight-edged razor was used to cut all samples transversely to obtain a rectangular cross section. In addition, the razor was used to cut off the rounded bottom edge of each sample to create a flat surface on which the sample could rest. By the same organizational scheme shown in Figure 1A, the test samples for each time point were laid flat in 6 columns on a green imaging sheet, along with a ruler. The control samples were placed to the right of the MeOH samples in an additional 7th column (Fig. 1B). Finally, the samples were photographed with a digital camera.
Creation of Average RGB Coordinates
A MATLAB (Mathworks) code was created to quantify the extent of ablation in the tissue by measuring the degree of difference between the colors of the test and control tissue samples in digital images. For each test sample and each control sample, the code generated average red-green-blue (RGB) coordinates, which were used later to determine the relative separation between the colors. The RGB color space contains an array of colors defined by varying chromaticities of red, blue, and green light. A color can be represented by an RGB coordinate defined by 3 integer values. The integer values for red, green, and blue are based on the intensity of the respective color and accordingly assigned a value between 0 and 255.
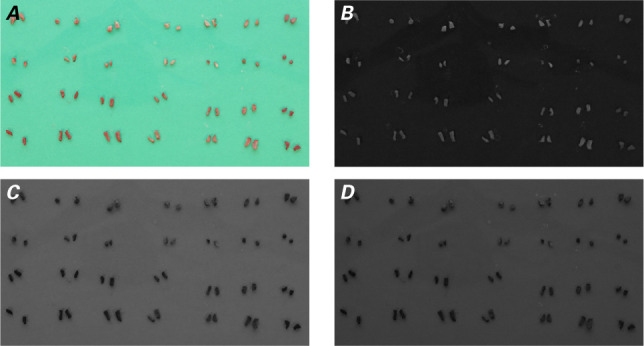
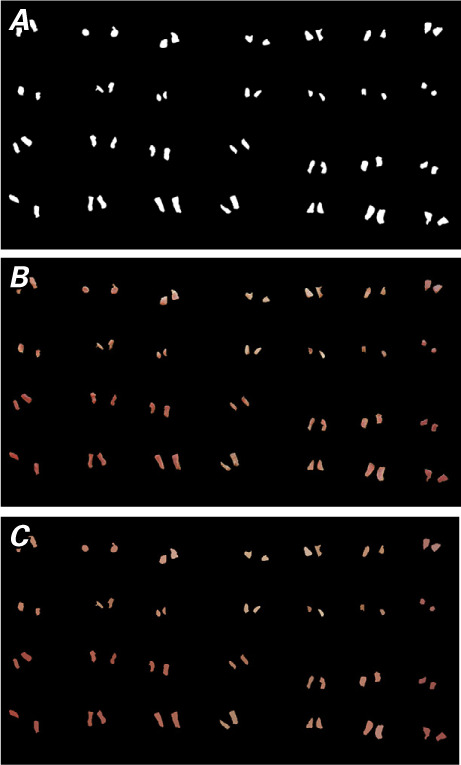
To begin, a binary mask had to be applied to each image to isolate the tissue from the green background. A binary mask defines the region of interest (ROI) of an image. A mask pixel value of one indicates that the image pixel belongs to the ROI, whereas a value of 0 indicates that the image pixel belongs to the background. To create the mask, the individual red, green, and blue color channels were extracted from the original image (Fig. 2). Then, the red channel was subtracted from the average of the green and blue channels. All segments of the ROI were labeled. The labeled segments were further refined by filtering out segments of smaller areas erroneously labeled as tissue. The area of each segment was calculated as the sum of all ones in the segment. The segments were relabeled to create the final binary mask. Superimposing this mask on the original image (Fig. 3) removed the green background and extracted only the images of tissue samples. From the masked image, the color of each tissue sample was approximated by averaging the RGB values found in each sample. The average RGB coordinates were then exported to MS Excel 2016 (Microsoft) for further analysis.
Fig. 2.

Steps in the process of creating the binary mask from A) the original digital image by extracting the B) red, C) green, and D) blue color channels.
Fig. 3.

Steps in the process of obtaining average red-green-blue (RGB) coordinates for samples by superimposing A) the binary mask on B) the original image to create C) an image showing average RGB colors.
CIELAB Analysis
Colors perceived by the human eye are better represented in the CIELAB color space,12 defined by the International Commission on Illumination (CIE), than in the RGB color space. Each color is expressed by a coordinate of 3 integer values (L*a*b*), representing the lightness of the color (L*), its position between red and green (a*), and its position between yellow and blue (b*). A mathematical transformation can be applied to RGB coordinates to convert them to CIELAB coordinates.
In MS Excel 2016, the RGB coordinates were converted first into XYZ coordinates13 and then into CIELAB coordinates because the CIELAB model more closely matches the human perception of lightness.14 The spatial distance between 2 colors in the CIELAB coordinate system is equivalent to a color difference as perceived by the human eye. The Euclidean distance (ED) is a metric used to quantify the spatial difference between 2 coordinates. Calculating the ED between the CIELAB coordinates of nonablated and ablated tissue is a means to quantify the perceptible color difference seen in tissue ablation. Similar techniques have been used in analysis of stained tissue to separate healthy cells from cancerous cells.15,16
The ED between the CIELAB coordinates of each test sample and its corresponding control sample17 was calculated as follows:
where Δ is the difference between coordinates; E*ab is the ED; and L*, a*, and b* are the respective CIELAB coordinates.
The final EDs thus calculated quantified an otherwise qualitative result and were used to analyze the effects of time and alcohol type on the progression of ablation in the different cardiac tissues. For each type of cardiac tissue examined, the EDs from each test sample's CIELAB coordinates to the respective control's CIELAB coordinates were averaged and then plotted over time.
Statistical Analysis
Two-way analysis of variance (ANOVA) was done in MS Excel 2016 to test for statistically significant differences in the EDs among the different time points. Two-tailed t tests were used to test for significant differences between the alcohol types for each individual time point. A P value <0.05 was considered statistically significant. Four samples were removed from analysis because of fat content in the tissue, which would have significantly skewed the CIELAB values necessary for analysis. To compensate for these missing data points, the affected datasets were analyzed by fitting a mixed model, rather than by repeated-measures ANOVA.
Results
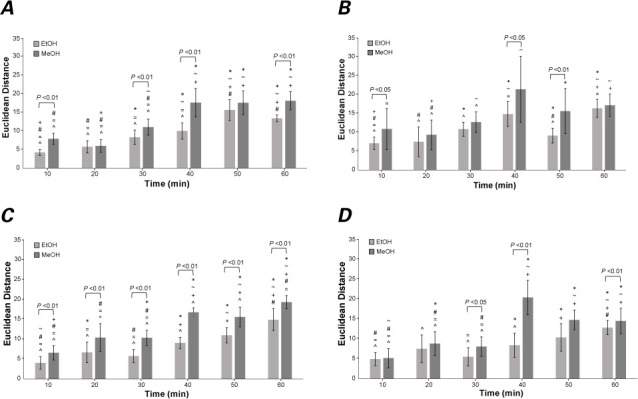
The mean EDs between the CIELAB coordinates of alcohol-treated and control cardiac tissue samples at most time points were significantly different from those at all other time points, except for immediately adjacent ones (that is, ±10 min) (Fig. 4). The brackets spanning some groups of data in Figure 4 denote significant differences (P <0.05) between mean EDs from the EtOH and MeOH datasets. For most tissue, longer alcohol exposure resulted in significant differences between the 2 alcohol datasets. For ventricular tissue, mean EDs from the EtOH and MeOH datasets differed significantly at all time points (P <0.01). Thinner tissue (for example, LAA) also showed significant differences at shorter alcohol exposure time points.
Fig. 4.

Bar graphs show mean Euclidean distances (EDs) between 2 colors in the CIELAB coordinate system (E*ab ) computed for A) left atrial appendage, B) atrial, C) ventricular, and D) septal tissues in contact with ethanol (EtOH) and methanol (MeOH) for the time periods indicated. Positive and negative standard error bars are shown for each data point. The symbols directly above each dataset (*, ~, +, #, =, and ^) correspond to time points 10, 20, 30, 40, 50, and 60 min, respectively, and indicate significant differences (P <0.01) between EDs in pairs of time points. The brackets above pairs of bar graphs indicate significant differences ( P <0.05) between the EtOH and MeOH results for particular time points.
Discussion
Alcohol can discolor tissue. Therefore, in this study, we quantified the amount of tissue discoloration as a measure of the extent of ablation. We hypothesized that the EDs would increase with longer exposure to alcohol and that the greatest ED would be seen at the 60-min time point. In general, the data from the longer time points (40, 50, and 60 min) did show larger EDs, but the increase was not always linear. This finding is probably due to some of the high variances we saw in the data, particularly in the data from atrial tissue.
A previous study revealed that MeOH has a faster penetration rate than EtOH.18 Therefore, we hypothesized that MeOH would produce larger EDs than EtOH at all time points. In all tissue types and at all time points, the EDs in the MeOH samples were greater than those in the corresponding EtOH samples, often significantly. In thinner tissue (for example, LAA), the MeOH samples appeared to show a plateauing of the EDs, potentially indicating a threshold for transmurality at some time before 40 min. To that end, EDs from the MeOH dataset generally seemed to be more constant at the longer time points. In contrast, EDs from the EtOH dataset still appeared to be increasing after 60 min across all tissue types, implying that the threshold for transmurality is probably more than an hour for this type of alcohol.
Our statistical analysis shows that, within this time frame, the ablative effect on tissues increases with time, which implies that the longer the alcohol is allowed to remain in a tissue, the larger the resulting lesion will be. This finding is particularly applicable to alcohol ablation procedures performed on the myocardium.
Our comparison of the effects of EtOH and MeOH indicates that MeOH may in fact be more effective for this type of procedure. However, because MeOH poses toxic risks to other organ systems, it cannot be used. Fortunately, the results presented here indicate that, especially in thinner tissues, the same lesions can be achieved with EtOH if it is allowed to remain in the tissue longer.
Limitations
Our study has some limitations. First, it was done in an ex vivo system in which we assumed that alcohol would be in contact with the tissue at all times during the tested time periods. We did not consider the effects of dilution of the alcohol by blood or the rate at which the alcohol would diffuse through vessel walls, both of which would be concerns in ASA. Second, we defined increasing transmurality as an increasing ED between a test sample's average CIELAB coordinates and those of the corresponding control sample. Using average color coordinates enabled us to represent each of the samples with a single uniform color.
Conclusion
This study shows that color coordinate analysis can be used to index the progression of alcohol ablation in cardiac tissue. The ED provided a quantitative metric of color change due to prolonged alcohol contact. The EDs obtained from the CIELAB coordinates for all tissue types increased over time, thus showing quantitatively the greater change in tissue color with longer alcohol contact.
In addition, different types of alcohol elicit different rates of color change in cardiac tissue. On the whole, MeOH typically produced greater EDs than EtOH did at the same time point. This finding builds on studies that highlight the variability of the effects of different types of alcohol.
Finally, obtaining a constant ED after a particular time point potentially indicates transmurality in tissue of a given thickness. One could infer that once the change in color has ceased, the entirety of the tissue has been ablated. Clinically, this information could be used to determine an approximate threshold of time needed to achieve transmurality in alcohol ablation applications, such as ASA or tumor ablation. We conclude that when EtOH is used for ablation, achieving full transmurality requires that thinner tissues (for example, LAA or atrial) remain in contact with EtOH for at least one hour, and thicker tissues for longer periods.
References
- 1.Goldstein DB. Effect of alcohol on cellular membranes. Ann Emerg Med . 1986;15(9):1013–8. doi: 10.1016/s0196-0644(86)80120-2. [DOI] [PubMed] [Google Scholar]
- 2.Schurmann P, Penalver J, Valderrabano M. Ethanol for the treatment of cardiac arrhythmias. Curr Opin Cardiol . 2015;30(4):333–43. doi: 10.1097/HCO.0000000000000183. [DOI] [PMC free article] [PubMed] [Google Scholar]
- 3.Morhard R, Nief C, Barrero Castedo C, Hu F, Madonna M, Mueller JL, et al. Development of enhanced ethanol ablation as an alternative to surgery in treatment of superficial solid tumors. Sci Rep . 2017;7(1):8750. doi: 10.1038/s41598-017-09371-2. [DOI] [PMC free article] [PubMed] [Google Scholar]
- 4.Sung JY, Baek JH, Kim YS, Jeong HJ, Kwak MS, Lee D, Moon WJ. One-step ethanol ablation of viscous cystic thyroid nodules. AJR Am J Roentgenol . 2008;191(6):1730–3. doi: 10.2214/AJR.08.1113. [DOI] [PubMed] [Google Scholar]
- 5.McKay J, Nagueh SF. Alcohol septal ablation to reduce heart failure. Interv Cardiol Clin . 2017;6(3):445–52. doi: 10.1016/j.iccl.2017.03.012. [DOI] [PubMed] [Google Scholar]
- 6.Raj MA, Bansal P, Goyal A. StatPearls [Internet] Treasure Island (FL): StatPearls Publishing; 2020. Hypertrophic obstructive cardiomyopathy. [PubMed] [Google Scholar]
- 7.El Masry H, Breall JA. Alcohol septal ablation for hypertrophic obstructive cardiomyopathy. Curr Cardiol Rev . 2008;4(3):193–7. doi: 10.2174/157340308785160561. [DOI] [PMC free article] [PubMed] [Google Scholar]
- 8.Takahashi Y, Sanders P, Rotter M, Haissaguerre M. Disconnection of the left atrial appendage for elimination of foci maintaining atrial fibrillation. J Cardiovasc Electrophysiol . 2005;16(8):917–9. doi: 10.1046/j.1540-8167.2005.40804.x. [DOI] [PubMed] [Google Scholar]
- 9.Pellman J, Sheikh F. Atrial fibrillation: mechanisms, therapeutics, and future directions. Compr Physiol . 2015;5(2):649–65. doi: 10.1002/cphy.c140047. [DOI] [PMC free article] [PubMed] [Google Scholar]
- 10.Valderrabano M, Liu X, Sasaridis C, Sidhu J, Little S, Khoury DS. Ethanol infusion in the vein of Marshall: adjunctive effects during ablation of atrial fibrillation. Heart Rhythm . 2009;6(11):1552–8. doi: 10.1016/j.hrthm.2009.07.036. [DOI] [PMC free article] [PubMed] [Google Scholar]
- 11.Carson FL, Cappellano CH. 4th ed. Chicago: American Society for Clinical Pathology; 2015. Histotechnology: a self instructional text. [Google Scholar]
- 12.International Organization for Standardization. ISO 11664-4:2019 Colorimetry -- Part 4: CIE 1976 L*a*b* colour space. Available from: https://www.iso.org/standard/74166.html [2019].
- 13.International Electrotechnical Commission. IEC 61966-2-1: 1999 Multimedia systems and equipment - Colour measurement and management - Part 2-1: Colour management - Default RGB colour space - sRGB. Available from: https://webstore.iec.ch/publication/6169 [1999].
- 14.Connolly C, Fleiss T. A study of efficiency and accuracy in the transformation from RGB to CIELAB color space. IEEE Trans Image Process . 1997;6(7):1046–8. doi: 10.1109/83.597279. [DOI] [PubMed] [Google Scholar]
- 15.Sieren JC, Weydert J, Bell A, De Young B, Smith AR, Thiesse J et al. An automated segmentation approach for highlighting the histological complexity of human lung cancer. Ann Biomed Eng . 2010;38(12):3581–91. doi: 10.1007/s10439-010-0103-6. [DOI] [PMC free article] [PubMed] [Google Scholar]
- 16.Phukpattaranont P, Boonyaphiphat P. Computer-aided analysis of nuclear stained breast cancer cell images. Proceedings of the 2008 5th International Conference on Electrical Engineering/Electronics, Computer, Telecommunications and Information Technology; IEEE; 2008. In: [Google Scholar]
- 17.Hanbury A, Serra J. Mathematical morphology in the CIELAB space. Image Anal Stereol . 2002;21(3):201–6. [Google Scholar]
- 18.Steicke M, Yang G, Dinh TN, Dunster-Jones M, Sargisson O, Ahmady F et al. The penetration of methanol into bovine cardiac and hepatic tissues is faster than ethanol and formalin. Eur J Histochem . 2018;62(1):2880. doi: 10.4081/ejh.2018.2880. [DOI] [PMC free article] [PubMed] [Google Scholar]


