

Supplemental Digital Content is available in the text.
Keywords: cardiomyopathies, genotype, heart diseases, mutation, proteomics, treatment, tubulin
Background:
Hypertrophic cardiomyopathy (HCM) is the most common genetic heart disease. While ≈50% of patients with HCM carry a sarcomere gene mutation (sarcomere mutation-positive, HCMSMP), the genetic background is unknown in the other half of the patients (sarcomere mutation-negative, HCMSMN). Genotype-specific differences have been reported in cardiac function. Moreover, HCMSMN patients have later disease onset and a better prognosis than HCMSMP patients. To define if genotype-specific derailments at the protein level may explain the heterogeneity in disease development, we performed a proteomic analysis in cardiac tissue from a clinically well-phenotyped HCM patient group.
Methods:
A proteomics screen was performed in cardiac tissue from 39 HCMSMP patients, 11HCMSMN patients, and 8 nonfailing controls. Patients with HCM had obstructive cardiomyopathy with left ventricular outflow tract obstruction and diastolic dysfunction. A novel MYBPC32373insG mouse model was used to confirm functional relevance of our proteomic findings.
Results:
In all HCM patient samples, we found lower levels of metabolic pathway proteins and higher levels of extracellular matrix proteins. Levels of total and detyrosinated α-tubulin were markedly higher in HCMSMP than in HCMSMN and controls. Higher tubulin detyrosination was also found in 2 unrelated MYBPC3 mouse models and its inhibition with parthenolide normalized contraction and relaxation time of isolated cardiomyocytes.
Conclusions:
Our findings indicate that microtubules and especially its detyrosination contribute to the pathomechanism of patients with HCMSMP. This is of clinical importance since it represents a potential treatment target to improve cardiac function in patients with HCMSMP, whereas a beneficial effect may be limited in patients with HCMSMN.
What Is New?
This study shows that the most prominent derailment at the protein level in cardiac tissue obtained during myectomy of patients with hypertrophic cardiomyopathy (HCM) in an advanced disease stage is reduced levels of proteins involved in metabolic pathways. This is common for all genotypes.
The study further demonstrates that increased levels of detyrosinated tubulin are specific for sarcomere mutation-positive patients with HCM.
The increase in tubulin detyrosination is resembled in a mouse model with the Dutch founder mutation MYBPC32373insG. Pharmacological inhibition of tubulin detyrosination normalizes contractile function in isolated cardiomyocytes.
What are the Clinical Implications?
Recent and ongoing clinical trials investigate the therapeutic effect of targeting the energy metabolism in patients with HCM, which is supported by our proteomic data showing metabolic derailment.
Lowering tubulin detyrosination presents a potential novel treatment strategy that may improve contractile function in patients with sarcomere mutation positive HCM. Since HCM is characterized by diastolic dysfunction, enhancing cardiomyocyte relaxation by lowering detyrosination of microtubules is considered to be beneficial for patients with HCM.
This study provides evidence that there is a need for genotype-specific treatment in HCM. Due to differences in pathomechanism, not every therapeutic strategy may be beneficial in all patient groups.
See Editorial by Margulies and Prosser
Hypertrophic cardiomyopathy (HCM) is characterized by diastolic dysfunction and asymmetrical left ventricular (LV) hypertrophy, which leads to LV outflow tract obstruction in the majority of cases.s1 Mutations in genes encoding sarcomere proteins cause HCM and are identified in more than half of the patients (sarcomere mutation-positive [HCMSMP]). The heterogeneity in genetic background of HCM is large with >1500 identified HCM-causing mutations.2 Approximately 80% of mutations are located in MYH7 and MYBPC3. Less frequent are mutations in TNNT2 and TNNI3.3,4 Previous research in HCM mouse models and humans showed genotype-specific differences in cellular characteristics and cardiac remodeling and function. Gene-specific differences in cellular redox and mitochondrial function were reported in mice harboring a MYH7 or TNNT2 mutation.5 In accordance with studies in HCM mouse models, studies on patient myectomy samples reported gene-specific differences in the response to calcium, ADP (adenosine diphosphate), protein kinase A, and length-dependent activation (LDA) of myofilaments compared with nonfailing cardiomyocytes.6,7 Also, a comparison of 2 different patient-specific induced pluripotent stem cell-derived cardiomyocyte cell lines, carrying either a mutation in MYBPC3 or TPM1, showed differences in calcium handling and electrophysiological properties.8 These in vitro studies are strengthened by clinical patient studies, which revealed a more severe decline in myocardial efficiency in MYH7 than in MYBPC3 mutation carriers,9 accompanied by a different response to therapy.10 Notably, there is also a large patient population in which a disease-causing mutation cannot be identified, the so-called sarcomere mutation-negative patients (HCMSMN). While the cause of the disease in these patients is unknown, they present with the same clinical phenotype as HCMSMP patients albeit at older age.3 Moreover, recent data from the SHaRe registry (the sarcomeric human cardiomyopathy registry) indicate that HCMSMP has a 2-fold greater risk of adverse outcomes than HCMSMN.11 Whereas LV outflow tract obstruction can be invasively corrected by surgical myectomy, other symptoms can only be managed by pharmacological therapies, which do not halt or reverse cardiac disease.1 Knowledge about the cellular changes that cause cardiac dysfunction and hypertrophy in patients with HCM is needed to design new therapies.
The main goal of this study was to define HCM- and genotype-specific derailments at the protein level, which may explain the heterogeneity in cardiac characteristics and disease initiation and progression. Therefore, we used an unbiased proteomics approach in a large number of myectomy samples from a clinically well-characterized HCM patient group with (HCMSMP) and without (HCMSMN) sarcomere mutations. We show that lower levels of metabolic pathway proteins and higher levels of ECM (extracellular matrix) proteins are the most prominent genotype-independent HCM-specific disease characteristics at the time of myectomy. However, abundance and detyrosination of α-tubulin were significantly higher in HCMSMP than in nonfailing controls, with intermediate levels in HCMSMN. Recent studies in human heart failure identified a central role for detyrosinated microtubules in regulating cardiomyocyte function and demonstrated the functional benefit upon reversal of this modification.12,13 Our study in a European HCM patient cohort and genetic HCM mouse models strengthens the concept that targeting the microtubule network represents a therapeutic strategy to correct impaired function and extends it to HCM caused by sarcomere mutations.
Methods
The proteomics data have been deposited to the ProteomeXchange Consortium via the PRIDE partner repository with the dataset identifier PXD012467 and are publicly available (http://proteomecentral.proteomexchange.org/cgi/GetDataset?ID=PXD012467).
Human Cardiac Samples
Tissue of the interventricular septum (IVS) of 50 patients with HCM was obtained during myectomy surgery to relieve LV outflow tract obstruction or after heart transplantation (1 sample, HCM 164). Samples of IVS from 8 healthy nonfailing donors (5 males, 3 females; mean age 45.9±9.7 years) with no history of cardiac abnormalities was obtained from the Sydney Heart Bank (HREC Univ Sydney 2012/030) and served as controls. The parameters of all HCM and nonfailing individuals are summarized in Table I in the Data Supplement. In this table, we organized patients with HCM based on their genotype into 5 subgroups: patients with the Dutch MYBPC3 founder mutation (2373insG), where the truncating mutation resulted in MYBPC3 haploinsufficiency14; patients with MYBPC3 mutations other than the 2373insG mutation of which 81.8% were truncating mutations as well; patients with MYH7 mutations; patients with mutations in less frequently affected sarcomere genes (TNNT2, TNNI3, and MYL2); and HCMSMN patients. In line with studies in other cohorts,15 almost all mutations in MYBPC3 were truncating mutations, whereas mutations in other sarcomeric proteins were missense except the truncating mutation c.814C>T in TNNT2.
Proteomics Analysis
Tissue Homogenization
Pulverized frozen tissue was homogenized in 40 μL/mg tissue 1× reducing sample buffer (106 mmol/L Tris-HCl, 141 mmol/L Tris-base, 2% lithium dodecyl sulfate, 10% glycerol, 0.51 mmol/L ethylenediaminetetraacetic acid, 0.22 mmol/L SERVA Blue G250, 0.18 mmol/L Phenol Red, and 100 mmol/L dithiothreitol) using a glass tissue grinder. Proteins were denatured by heating to 99 °C for 5 minutes, after which samples were sonicated and heated again. Debris was removed by centrifugation at maximum speed for 10 minutes in a microcentrifuge (Sigma, 1-15K).
Protein Fractionation
Proteins were separated using 1D SDS-PAGE. Samples from each group were loaded alternating on the gels to avoid bias. Equal volumes of sample (30 μL protein homogenate per sample, containing ≈20–30 μg of protein) were loaded on a precast 4% to 12% NuPAGE Novex Bis-Tris 1.5 mm mini gel (Invitrogen). Electrophoresis was performed at 200 V in NuPAGE MES SDS running buffer until the dye front reached the bottom of the gel. Gels were fixed in a solution of 50% ethanol and 3% phosphoric acid and stained with 0.1% coomassie brilliant blue G-250 solution (containing 34% methanol, 3% phosphoric acid, and 15% ammonium sulfate). Images of all gels are provided in Figure I in the Data Supplement.
In-Gel Digestion and Nano-LC-MS/MS
Each gel lane was cut into 5 pieces, and in-gel digestion was performed as described previously.16 Samples were measured by liquid chromatography-mass spectrometry (LC-MS) per gel band starting at the high molecular weight fraction for all samples, before continuing with the next gel band until the last (low molecular weight fraction) band. Injections alternated between all different group samples to minimize experimental bias between groups. Analysis of the experiment was performed as described in Piersma et al.17 Peptides were separated using an Ultimate 3000 Nano LC-MS/MS system (Dionex LC-Packings, Amsterdam, The Netherlands) equipped with a 40 cm × 75 μm ID fused-silica column custom packed with 1.9 μm,120 Å ReproSil Pur C18 aqua (Dr Maisch GMBH, Ammerbuch-Entringen, Germany). Eluting peptides were ionized at a potential of +2 kV into a Q Exactive mass spectrometer (Thermo Fisher, Bremen, Germany). MS/MS spectra were acquired at resolution 17 500 (at m/z 200) in the orbitrap using an AGC target value of 1×10⁶ charges, a maxIT of 60 ms, and an underfill ratio of 0.1%. Dynamic exclusion was applied with a repeat count of 1 and an exclusion time of 30 s (additional details to in-gel-digestion and nano-LC-MS/MS are provided in the Data Supplement).
Data Analysis
MS/MS spectra were searched against a Uniprot human reference proteome FASTA file (Swissprot_2017_03_human_canonical_and_isoform.fasta, 42161 entries) using MaxQuant version 1.5.4.1 (details to search settings are provided in the Data Supplement). The mass spectrometry proteomics data are provided in Table V in the Data Supplement, and the raw data have been deposited to the ProteomeXchange Consortium via the PRIDE18 partner repository with the data set identifier PXD012467. Beta-binominal statistics were used to assess differential protein expression between groups, after normalization on the sum of the counts for each sample.19 Proteins with a P value below 0.05 were considered significantly differentially expressed. Proteins which were present in <25% of the samples or had an average normalized count of <1.4 were excluded from further functional analysis. Principal component analysis was performed in R. Therefore, quantile normalization and log2 transformation were performed on the normalized counts. The 95th percentile was taken, the data median centered, and the principal components calculated. Hierarchical clustering was performed after a statistical multigroup comparison. Proteins with a raw P<0.05 were selected for the pathway analysis. Protein networks were generated using the STRING database (Search Tool for the Retrieval of Interacting Genes/Proteins) and visualized with Cytoscape software.20 Protein interaction networks were generated with ClusterONE and gene ontology (GO) analysis was performed using the BiNGO application in cytoscape.21,22 Heatmaps for a specific GOs were created with ToppGene Suite23 and Graphpad Prism v7 software. Venn diagrams were created with InteractiVenn tool24 and the layout modified if needed.
Animal Experiments
The MYBPC32373insG mouse model was engineered using CRISPR/Cas9 (clustered regularly interspaced short palindromic repeats/CRISPR associated protein 9, details are provided in the Data Supplement). Echocardiographic phenotyping (Vevo 2100, Visualsonics) was performed on 7 homozygous MYBPC32373insG mice (3 females and 4 males) and 8 wild-type (WT) littermates (3 females and 5 males). The age of the mice ranged from 20 to 28 weeks. Group size of 7 was determined by a power calculation to achieve a power of 0.8 and an α of 0.05 and to detect an effect size of 20% in echocardiography.
The MYBPC3772G>A mice were developed previously25 and maintained on a blackswiss genetic background. Western blot analysis was performed of the cytosolic fraction of LV tissue in 6 homozygous MYBPC3772G>A mice (2 females and 4 males) and 6 WT littermates (2 females and 4 males). The age of these mice was 55 to 59 weeks.
Intact Cardiomyocyte Isolation and Measurements
Intact adult cardiomyocytes were isolated from 4 WT and 6 homozygous MYBPC32373insG mice as described previously.26 Cells were suspended in plating medium composed of medium 199 (Lonza), 1% penicillin/streptomycin, and 5% bovine serum and plated on a laminin-coated dish (10 μg/mL, Sigma-Aldrich). The cells were incubated for 1 hour at 37 °C in humidified air with 5% CO2 to let them attach to the coated dish. Afterwards, nonattached cells were removed by washing cells with preheated culture medium (medium 199 [Lonza], 1% penicillin/streptomycin, 1×ITS supplement [Sigma-Aldrich], and 0.5 μmol/L cytochalasin D [Life technologies]). Cells were incubated with dimethyl sulfoxide (0.1% v/v) or 10 µmol/L parthenolide (Sigma) for 2 hours. Contractility measurements were performed in tyrode solution (HEPES (4-(2-hydroxyethyl)-1-piperazineethanesulfonic acid) 10 mmol/L, NaCl 133.5 mmol/L, KCl 5 mmol/L, NaH2PO4 1.2 mmol/L, MgSO4 1.2 mmol/L, glucose 11.1 mmol/L, sodium pyruvate 5 mmol/L; pH 7.4 at 37 °C) at 37 °C using the MultiCell system (CytoCypher, the Netherlands). The dish was field-stimulated at 2 Hz, 25 V, and a 4 ms pulse duration. Changes in sarcomere length were recorded with a high-speed camera and Ionoptix software (Ionoptix, Westwood, MA). The contractility profiles were analyzed with the automated batch analysis software CytoSolver (CytoCypher, Amsterdam, NL). An R2 for peak and recovery fit >0.95 was selected as inclusion criteria for contraction data.
For protein analysis, cells were incubated with dimethyl sulfoxide (0.1% v/v) or 10 µmol/L parthenolide (Sigma) for 2 hours, washed with PBS, and directly lysed in loading buffer.
Study Approval
The study protocol for the human tissue samples was approved by the local medical ethics review committees, and written informed consent was obtained from each patient before surgery.
Animal experiments were performed in accordance with the Guide for the Animal Care and Use Committee of the VU University Medical Center and with approval of the Animal Care Committee of the VU University Medical Center (CCD-number AVD114002016700) and conform the guidelines from Directive 2010/63/EU of the European Parliament on the protection of animals used for scientific purposes.
Extended methods section in the Data Supplement.
Results
No Major Genotype-Specific Protein Changes
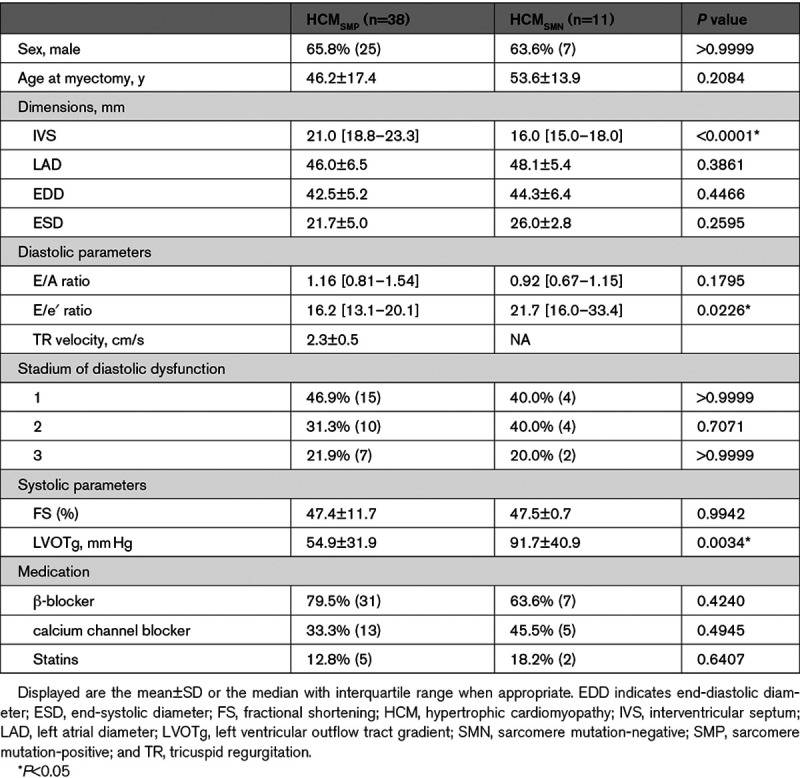
We performed an unbiased proteomics approach to compare the protein expression profile of 50 IVS samples from patients with HCM at the time of myectomy with 8 nonfailingIVS samples (Table, Table I in the Data Supplement; patient characteristics). Patient characteristics are shown in the Table. Echochardiographic parameters were assessed as described previously.27 All patients with HCM had obstructive HCM and showed impaired diastolic function evident from increased LV filling pressure indicated by an E/e′ ratio >15 and atrial dilation indicated by increased left atrial diameter compared with reference values.28,29 IVS thickness was higher in HCMSMP compared with HCMSMN. We identified 3811 proteins of which we included 2127 into our analysis after applying our inclusion criteria of an average normalized count of >1.4 and the protein being detected in >25% of samples. This filtered out low-level proteins that could not be reliably quantified. Samples were grouped based on their genotype and protein expression changes were analyzed in different group-wise comparisons. Table II in the Data Supplement lists all group-wise comparisons and the corresponding number of significantly deregulated proteins that contributed to the subsequent cluster and GO analysis. An unbiased principal component analysis of the protein expression data revealed separate clustering of the nonfailingIVS and HCM samples, indicating different protein expression profiles between controls and patients (Figure 1A). Supervised hierarchical clustering of a multigroup comparison revealed separate clusters for nonfailingIVS and HCM samples (Figure 1B). However, in both analyses, the HCM samples did not cluster according to their genotypes, indicating that the protein profile at the time of myectomy surgery is relatively homogeneous with differences between genotypes that are not sufficiently large to distinguish them with cluster analysis. Sample HCM 83 did not cluster with any of the other HCM or nonfailingIVS samples and turned out to have a very high serum albumin content. This implicated contamination with blood and, therefore, we excluded this sample from all further analyses. Sample HCM 164 also showed a unique protein expression pattern. It may reflect the infant proteome due to the young age (2 months), or the very severe disease stage since this is the only sample obtained from a heart transplantation. Since the variation in this sample is due to a biological reason, we did not exclude it.
Figure 1.
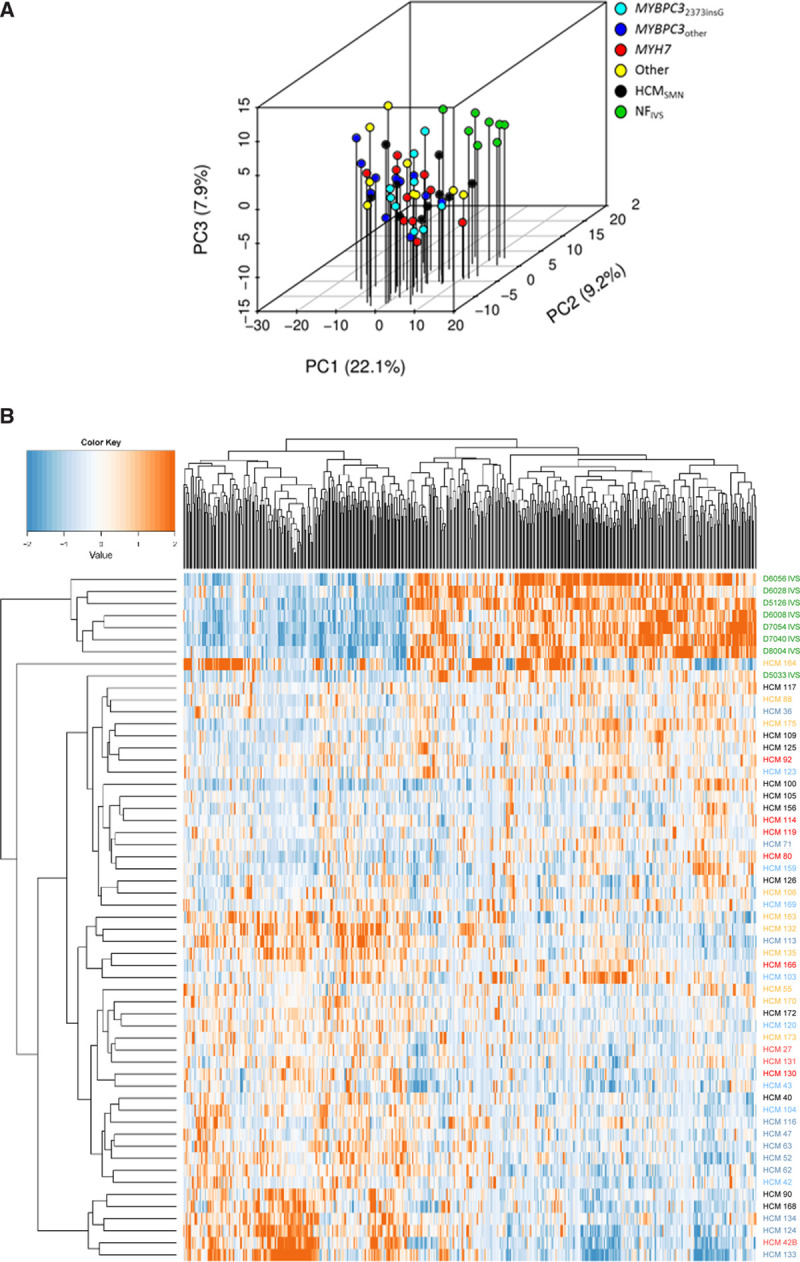
Clustering of proteome of controls and patient samples. A, Principal component (PC) analysis of the filtered protein expression data reveals separate clustering of the nonfailing interventricular septum (NFIVS) samples (n=8) and the hypertrophic cardiomyopathy (HCM) samples (n=50) showing that the overall protein expression profile between NFIVS and HCM samples differs. HCM samples did not form separate clusters based on genotypes, indicating that genotype does not lead to major changes in protein expression profile. Also sarcomere mutation-positive (HCMSMP) and sarcomere mutation-negative (HCMSMN) samples do not show major differences at the overall protein expression profile as they cluster together. B, Hierarchical clustering of a multigroup comparison of all proteins that are differently expressed at P<0.05 when comparing all HCM (HCMall) with NFIVS. Hierarchical clustering of all significantly different proteins between HCMall and NFIVS shows that the NFIVS samples cluster together and are most different from the HCM samples. Also among this selection of proteins, the HCM samples do not cluster based on genotype or based on presence or absence of mutation (HCMSMP and HCMSMN).
Table.
Clinical Characteristics of the HCMSMP and HCMSMN Patient Group
To validate our experimental approach, we checked the expression of proteins involved in pathways that are known to be altered in HCM (Figure II and Table III in the Data Supplement). Fibrosis, characterized by an increase in ECM components, is a well-established feature of HCM as shown by data from myectomy biopsies and cardiac magnetic resonance imaging of patients.27,30 In line with the presence of fibrosis in patients, we found increased levels of fibronectin, thrombospondin 4, and periostin (Figures IIA through IIC in the Data Supplement). Since hypertrophy is a morphological hallmark of HCM, we checked FHL2 (four and a half LIM domains protein 2) expression as a negative regulator of hypertrophy.31 In line with prohypertrophic signaling, reduced FHL2 protein expression was observed (Figure IID in the Data Supplement). The hypertrophic phenotype was also evident from reduced (alpha-myosin heavy chain) α-MHC encoded by MYH6 and increased CSRP3 (cysteine and glycine rich protein 3) expression in HCM samples (Figure IIE and IIF in the Data Supplement).32,33 Finally, MYBPC3 (cardiac myosin-binding protein C) haploinsufficiency was confirmed in samples with a mutation in MYBPC3 irrespective of whether the mutation is a truncation or missense mutation (Figure IIG and IIH and Table IV in the Data Supplement).14,34
Additionally, we performed RNA sequencing in a subset of samples. Similar to the proteomics data, the principal component analysis plot of the RNA data did not show clustering based on genotype (Figure IIIA in the Data Supplement). The MA-plot depicts all genes with the differentially expressed genes in red (Figure IIIB in the Data Supplement).Gene set enrichment analysis of the proteomics and transcriptomics data revealed a significant correlation of upregulated proteins with genes that showed higher expression levels in HCM compared with nonfailingIVS (false discovery rate (FDR)<0.001), whereas less expressed proteins are positively correlated with genes that showed lower expression levels in HCM (FDR=0.008). This observation suggested that protein expression changes were well correlated with the mRNA expression changes between HCM and nonfailingIVS (Figure IIIC and IIID in the Data Supplement).
HCM-Specific Protein Changes
To identify HCM disease-specific protein expression patterns at the time of myectomy, we grouped all HCM samples and compared them to nonfailingIVS. We identified clusters of interacting proteins for higher and lower expressed proteins separately.
Analysis of all significantly lower expressed proteins of all HCM compared with nonfailingIVS uncovered the highest enrichment in oxidative phosphorylation, generation of precursor metabolites and energy, NAD metabolic process, translation, fatty acid catabolic process, regulated exocytosis, and neutrophil degranulation (Figure 2A, more extensive list in Figure IV in the Data Supplement). This shows that the major changes in tissue of patients with HCM are in metabolic pathways related to energy metabolism including both glucose and fatty acid metabolism. We selected all significantly lower expressed proteins annotated to the pathways and created a heatmap displaying the log2-fold change for a detailed visualization of protein changes in the pathway. We included RNA expression data of the corresponding genes to check if the protein changes coincide with changes at the RNA level. Strikingly, most of these proteins are not changed on RNA level (Figure V in the Data Supplement).
Figure 2.
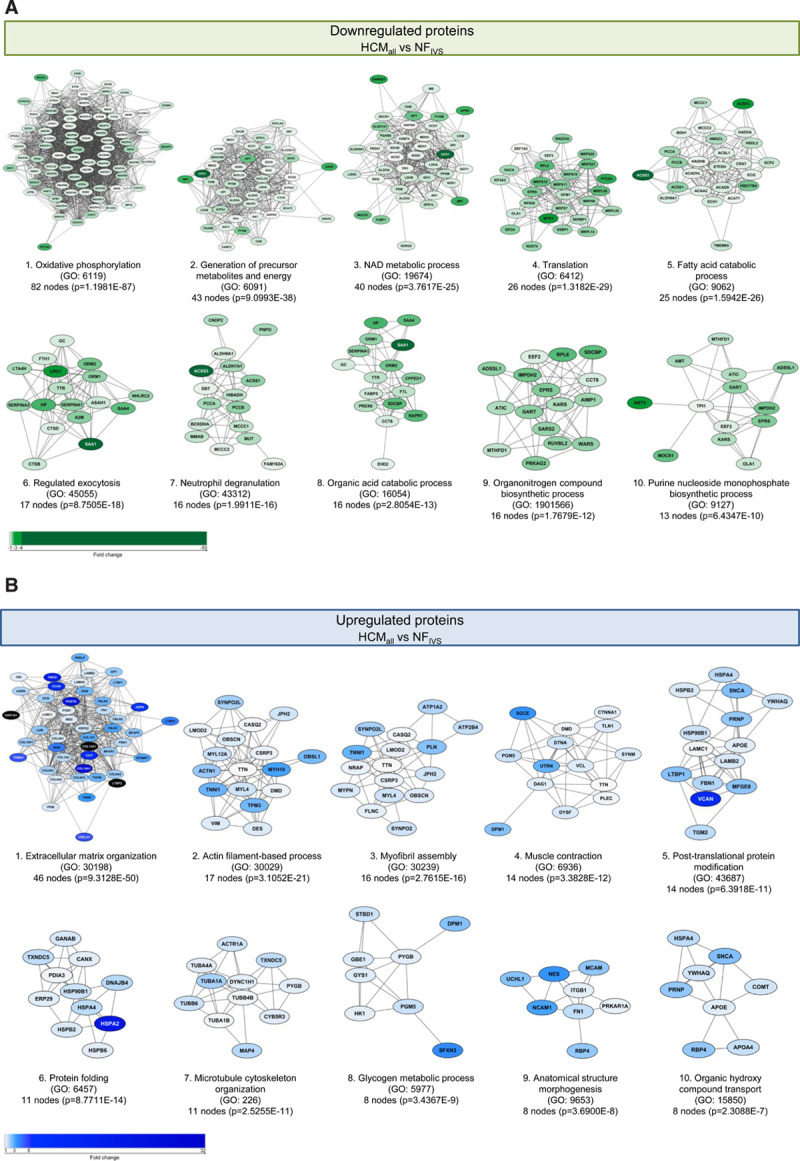
Hypertrophic cardiomyopathy (HCM)-specific changes in biological processes. Protein interaction cluster of significantly different proteins between all HCM (HCMall) and nonfailing interventricular septum (NFIVS) were identified and are displayed with the most significant corresponding gene ontology (GO) term. A, Top 10 downregulated protein interaction cluster based on cluster size with the most significant biological process related to this cluster. B, Top 10 upregulated protein interaction cluster based on cluster size with the most significant biological process related to this cluster. The color gradient from light to dark indicates an increase in fold change.
The top clusters of the higher expressed proteins are associated with the GO terms ECM organization, actin filament-based process, myofibril assembly, muscle contraction, post-translational protein modification, protein folding, and microtubule cytoskeleton organization (Figure 2B, more extensive list in Figure VI in the Data Supplement). The biggest cluster of more abundant proteins is ECM organization representing different collagens that are components of fibrotic tissue. Interestingly, many of these genes showed unaltered RNA levels compared with nonfailingIVS. The same was observed for the other top clusters of higher expressed proteins, namely actin filament-based process, myofibril assembly, and muscle contraction, where RNA levels were unaltered or even lower than in nonfailingIVS (Figure VII in the Data Supplement).
Since HCM at the time of myectomy is characterized by pronounced hypertrophy of the myocardium, we expected a protein cluster related to hypertrophy among the significantly increased proteins. Surprisingly, we did not find this. This could be because the myocardium is not in a state of active hypertrophic growth at the time of sample collection, or because we did not detect low abundant hypertrophy promoting signaling proteins. It is also known that several signaling proteins are regulated by post-translational modifications rather than by abundance on which our proteomics screen was based. Western blot analysis of the expression and phosphorylation of AKT (protein kinase B) and ERK (extracellular signal-regulated kinase), 2 well-known inducers of hypertrophy,35,36 showed higher AKT and ERK phosphorylation in all HCM samples, indicating activation of hypertrophic signaling (Figure VIII in the Data Supplement).
Subsequently, we repeated the cluster and GO analysis restricted to proteins that are higher and lower expressed if all 5 genotype HCM groups are compared individually to nonfailingIVS to extract the most consistent and robust changes. Venn diagrams (Figures IX and X in the Data Supplement) were made to identify overlapping protein changes (76 higher and 92 lower expressed), which were subsequently used as analysis input.
The results confirmed the findings from the initial analysis showing that the major HCM-specific protein changes include reduced metabolism, increased ECM remodeling, and pathways, including muscle-related processes.
Specific Changes for HCMSMP and HCMSMN
To study the pathways that are characteristic for HCMSMP or HCMSMN and might explain sarcomere mutation-specific changes in cardiac function, we created a Venn diagram of significantly different proteins in HCMSMP and HCMSMN compared with nonfailingIVS. The Venn diagrams (Figure 3 and Figure XI in the Data Supplement) illustrate that the majority of significantly different proteins are similar in HCMSMP and HCMSMN (191 lower and 121 higher expressed proteins). However, a substantial number of proteins is only changed in either HCMSMP or HCMSMN, when compared with nonfailingIVS.
Figure 3.
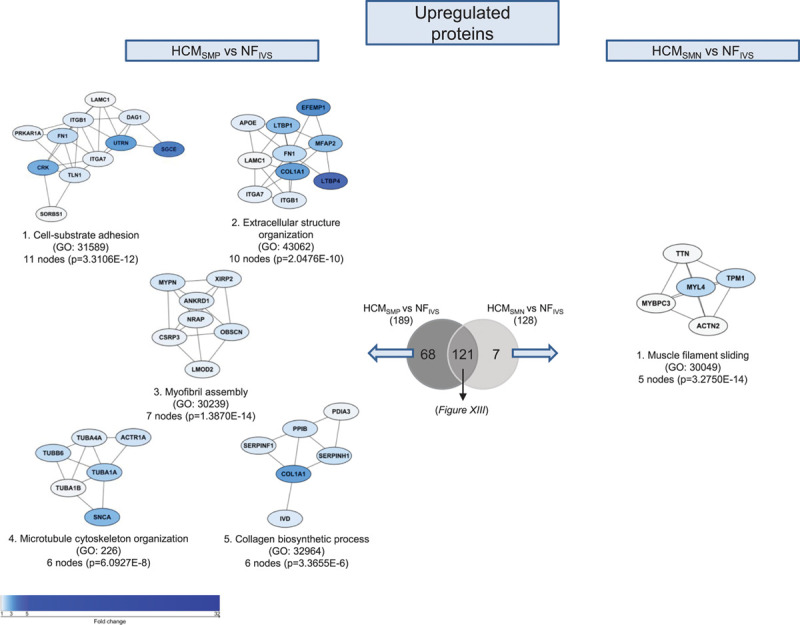
Differences in upregulated proteins between patients with hypertrophic cardiomyopathy sarcomere mutation-positive (HCMSMP) and sarcomere mutation-negative (HCMSMN). Protein interaction cluster of proteins that are only significantly upregulated for the HCMSMP vs nonfailing interventricular septum (NFIVS) or the HCMSMN vs NFIVS comparison were identified and are displayed with the most significant corresponding gene ontology (GO) term. The top 5 protein interaction clusters of upregulated proteins are displayed The color gradient from light to dark indicates an increase in fold change.
The 130 proteins that are specifically less abundant in HCMSMP overlap to a large degree with the biological processes of the 194 proteins that are significantly less abundant in both HCMSMP and HCMSMN when compared with nonfailingIVS (Figure XII in the Data Supplement). Analysis of the 62 proteins that are specifically less expressed in HCMSMN results in clusters related to stress granule assembly, translational initiation, and protein folding (Figure XI in the Data Supplement).
The majority of the shared higher expressed proteins involve ECM organization (Figure XIII in the Data Supplement). GO analysis of the 68 proteins that are specifically more abundant in HCMSMP identified among others a protein clusters related to microtubule cytoskeleton organization (Figure 3).
This cluster representing tubulin subunits is solely more abundant in HCMSMP when compared with nonfailingIVS and is also among the functional protein cluster of proteins that are significantly upregulated in HCMSMP when directly compared with HCMSMN (Figure XIV in the Data Supplement). Since the tubulin network is highly regulated by post-translational modifications, we determined the levels of total α-tubulin, tyrosinated, and detyrosinated tubulin by Western blot (Figure 4, Figure XVA in the Data Supplement). In line with the proteomics data, we found an increase in total α-tubulin which is more prominent in HCMSMP than in HCMSMN (Figure 4A). We validated this with another primary antibody and obtained very comparable results (Figure XVA in the Data Supplement). A post-translational modification of tubulin that leads to increased stiffness of cardiomyocytes is detyrosination of α-tubulin.12 We found markedly elevated detyrosinated tubulin only in HCMSMP samples (Figure 4C), while levels of tyrosinated tubulin were slightly increased in both HCMSMP and HCMSMN (Figure 4B). Within the HCMSMP group, levels of α-tubulin tend to be highest in the MYBPC3other group and lowest in the MYH7 group, whereas desmin levels tend to be highest in MYH7. Levels of tyrosinated and detyrosinated tubulin do not show any genotype-specific differences. Levels of tyrosinated and detyrosinated tubulin normalized to total α-tubulin are depicted in Figure XVB and XVC in the Data Supplement. Our data show that high levels of tubulin in HCMSMP represent mostly the detyrosinated form. We also determined desmin protein levels by Western blot since this protein is associated with microtubules in cardiomyocytes. Accordingly, desmin levels were elevated in HCM with the largest increase in HCMSMP (Figure 4D).
Figure 4.
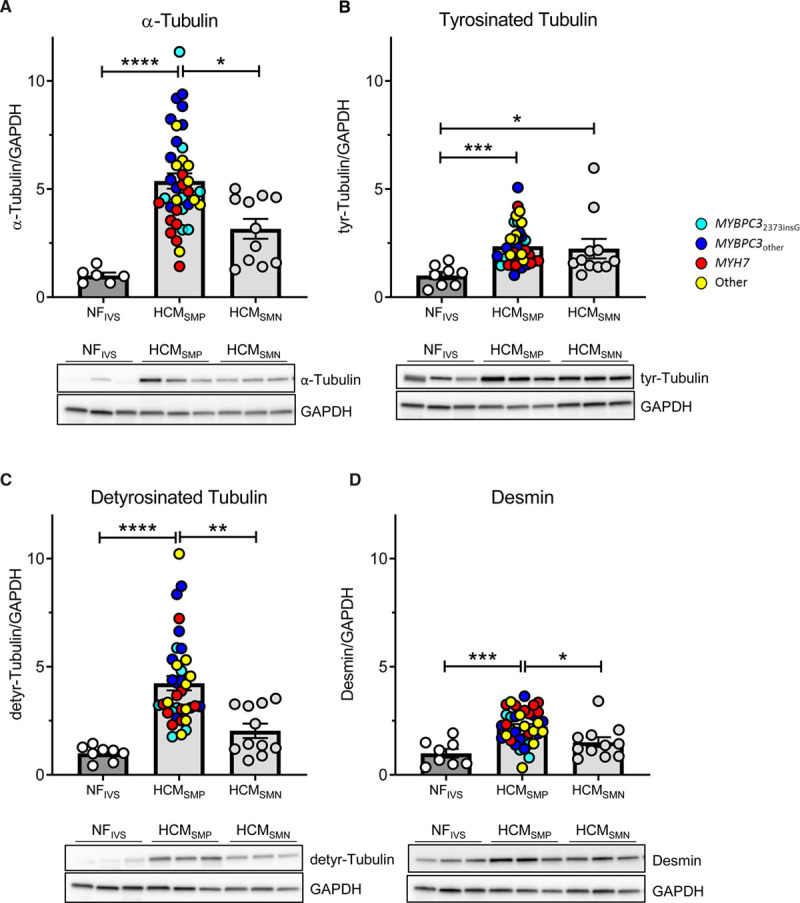
Tubulin expression and post-translational modifications in patients with hypertrophic cardiomyopathy (HCM). Protein levels of α-tubulin (A), its tyrosinated (B) and detyrosinated forms (C) and desmin (D), all normalized to GAPDH, in tissue of patients with HCM. Kruskal-Wallis test with Dunn's multiple comparisons test, ****P<0.0001, ***P=0.0003 in (B), ***P=0.0009 in (D), **P=0.0074, *P=0.0437 in (A), *P=0.0499 in (B) and *P=0.0357 in (D). Average of the control group is set to 1. n(nonfailing interventricular septum [NFIVS]/HCMSMP/HCMSMN)=6/38/11 for (A), 8/36/11 for (B and C), 8/37/11 for (D). SMN indicates sarcomere mutation-negative; and SMP, sarcomere mutation-positive.
Inhibition of Tubulin Detyrosination Corrects Cardiomyocyte Dysfunction in MYBPC32373insG Mice
Based on previous studies in human heart failure,13 our data in human myectomy samples indicate that microtubules may represent a treatment target to correct cardiac dysfunction in HCM. To provide proof for a role of tubulin in modulating cardiomyocyte function in HCM caused by a sarcomere gene mutation, we generated a HCM knockin mouse model of the Dutch founder mutation c.2373insG in MYBPC3 (Figure XVIA and XVIB in the Data Supplement). This mutation introduces a new splice donor site in exon 25 leading to a frameshift and premature stop codon resulting in an expected truncated protein of 95 kDa.37 As no truncated protein is found in patients with HCM carrying this mutation at the heterozygous state,14 degradation of mutant mRNA and protein is likely. Accordingly, Western blot analysis did not reveal any truncated MYBPC3 protein in homozygous MYBPC32373insG mice (Figure XVIC in the Data Supplement).
Levels of total and tyrosinated α-tubulin did not differ between the groups, whereas the detyrosinated tubulin and desmin levels were markedly higher in MYBPC32373insG than in WT mice (Figure 5A -5D, loading control to Figure 5A shown in Figure XVD in the Data Supplement). To evaluate whether these findings were specific to this model, we assessed the levels of total and detyrosinated tubulin in a second HCM mouse model carrying a different MYBPC3 mutation.25 Homozygous MYBPC3772G>A mice showed a strong accumulation of α-tubulin and no difference in tyrosinated tubulin compared with their WT littermates. In addition, a trend to higher levels of detyrosinated tubulin was observed (Figure 5E through 5G). Overall, these mouse models consistently show tubulin changes in cardiomyopathy caused by MYBPC3 gene mutations.
Figure 5.
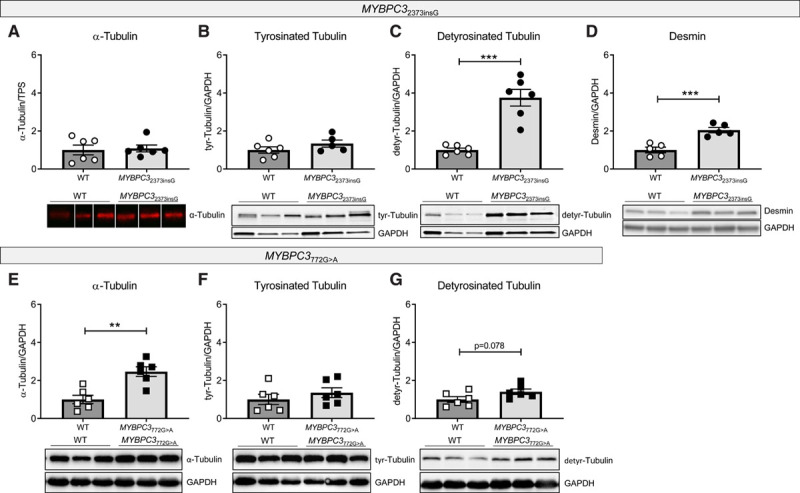
Tubulin composition in MYBPC32373insG and MYBPC3772G>A mouse models. Quantification and representative Western blot images of (A) α-tubulin, (B) tyrosinated tubulin, (C) detyrosinated tubulin, and (D) desmin in MYBPC32373insG mice and (E) α-tubulin, (F) tyrosinated tubulin and (G) detyrosinated tubulin in MYBPC3772G>A mice, respectively. A is normalized to total protein stain (TPS, image provided in Figure XVD in the Data Supplement). B–G are normalized to GAPDH. Lanes in A were run on the same gel but were noncontiguous. n(wild type [WT]/MYBPC32373insG/MYBPC3 772G>A)=6/6 (4 females, 2 males/3 females, 3 males of 20–27 wk for MYBPC32373insG and the corresponding WT; 2 females, 4 males for of 55–59 wk for MYBPC3772G>A and the corresponding WT) for (A, C, and E–G), 6/5 (4 females, 2 males/3 females, 2 males; 20–27 wk) for (B) and 5/5 (3 females, 2 males/2 females, 3 males; 20–27 wk) for (D), unpaired 2-tailed t test, ***P=0.0001 in (C) and P=0.009 in (D), **P=0.0014.
MYBPC32373insG mice had a severe cardiac phenotype characterized by higher ventricular weight to body weight ratio, increased LV anterior wall diameter and IVS thickness, lower ejection fraction, increased LV internal diameter and longer isovolumetric relaxation time than WT mice (Figure 6A through 6F). Single cardiomyocytes from MYBPC32373insG hearts showed contractile deficits compared with WT as shown by an increase in time to peak of contraction and an impaired relaxation shown by an increase in time to baseline (Figure 6G and 6H). Inhibition of detyrosination by treatment with parthenolide reduced levels of detyrosinated tubulin by 36% (Figure 6J) and normalized the contraction and relaxation times in MYBPC32373insG mice to baseline WT levels (Figure 6G and 6H), whereas it had no effect on calcium release and reuptake time in MYBPC32373insG mice (Figure XVIIA and XVIIB in the Data Supplement), indicating a direct effect on myofilament function.
Figure 6.
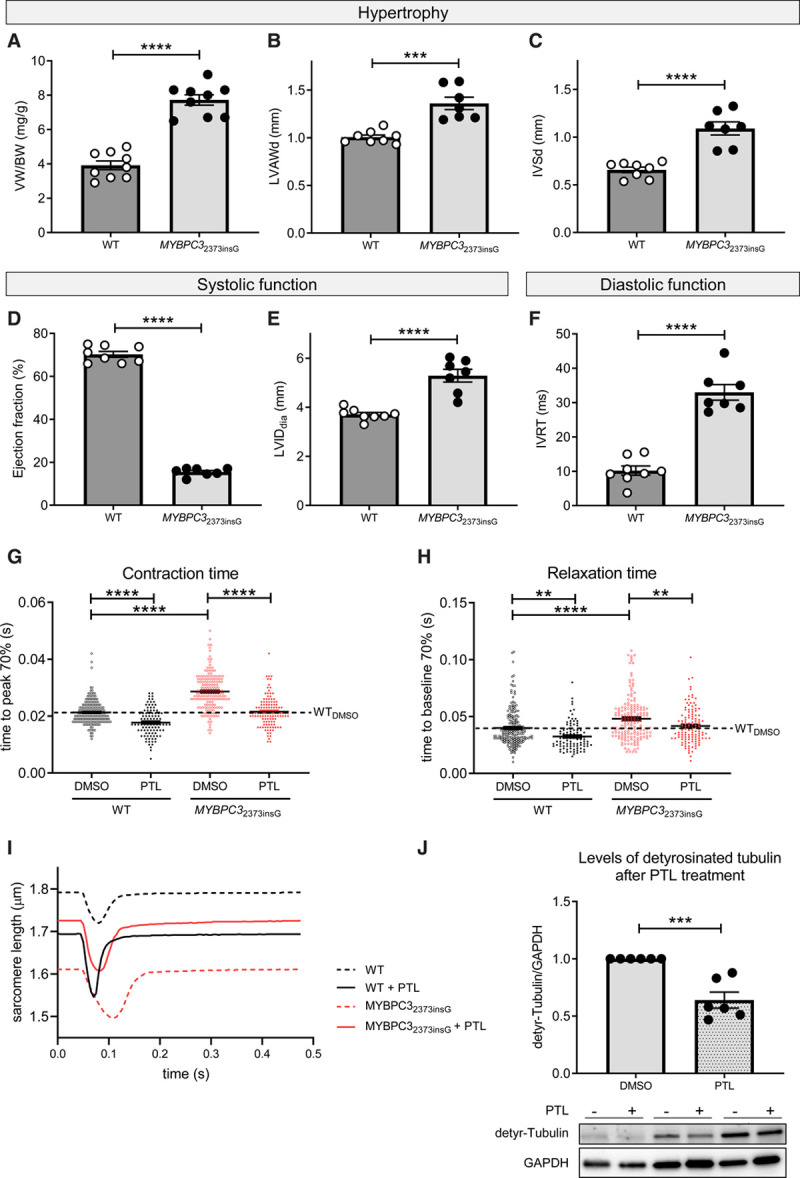
Morphometric and phenotypic analysis of MYBPC32373insG mice and contractile function of isolated MYBPC32373insG cardiomyocytes upon inhibition of tubulin detyrosination. Quantification of the hypertrophy parameters (A) ventricle weight (VW)/body weight (BW) ratio and (B) anterior wall thickness in diastole (LWADd) and (C) interventricular septum thickness in diastole (IVSd) measured by echocardiography. D and E show parameters of systolic function measured by ejection fraction and left ventricular internal diameter (LVID) and (F) displays diastolic function assessed by isovolumetric relaxation time (IVRT). n(wild type [WT]/MYBPC32373insG)=9/9 (4 females, 5 males; 20–27 wk) for (A) and 8/7 (3 females, 5 resp. 4 males; 25–27 wk) for (B–F), unpaired 2-tailed t test, ****P<0.0001, ***P=0.0001. G displays the effect of tubulin detyrosination inhibition by parthenolide (PTL) on the contractile parameter time to peak 70% and (H) on the diastolic parameter time to baseline 70%. The dotted line visualizes the WT baseline level. I shows example force transients for each condition of the single-cell measurements. For (G and H) N(WT mice)=4 (2 females and 2 males, 13–33 wk) with total n(cells dimethyl sulfoxide [DMSO]/PTL)=191/99 and N(MYBPC32373insG mice)=6 (2 females and 4 males, 13–35 wk) with total n(cells DMSO/PTL)=169/123. G and H were analyzed by 2-way ANOVA, **P<0.01, ****P<0.0001. J, Levels of detyrosinated tubulin normalized to GAPDH in isolated MYBPC32373insG cardiomyocytes upon inhibition of tubulin detyrosination by PTL. Every PTL treated sample was normalized to the DMSO control condition from the same animal. N(MYBPC32373insG mice)=6 (2 females, 4 males, 13–19 wk); J was analyzed with an unpaired 2-tailed t test, ***P=0.0004.
Discussion
In this study, we compared the protein profile of cardiac tissue from patients with HCM with different disease-causing gene mutations to identify common HCM disease changes as well as genotype-specific protein changes at the time of myectomy. The majority of detected protein changes were common for all HCM samples and independent of the underlying gene mutation. Our approach revealed different protein profiles in the presence or absence of a sarcomere gene mutation. While hypertrophic remodeling in HCMSMP is characterized by an increase in the levels of proteins involved in microtubule cytoskeleton organization, HCMSMN samples show reduced levels of proteins involved in protein translation.
Deregulated Energy Metabolism Proteome
Our analysis revealed that the majority of deregulated proteins are related to energy metabolism and show a consistent lower expression of proteins involved in oxidative phosphorylation, glycolysis, and fatty acid oxidation. Especially subunits of mitochondrial respiratory chain complex I, that are part of cluster 1 in Figure 2A, are consistently lower expressed. This is in line with another recent proteomics study of HCM tissue samples in which reduced levels of energy metabolism proteins was one of the main findings.38 It also matches observations of energy deficiency in animal models39 and human studies.40,41 Energy deficiency has been proposed as the primary mutation-induced pathomechanism leading to compensatory hypertrophy,42 which is supported by the fact that even asymptomatic mutation carriers without hypertrophy display reduced cardiac energetic status.9,41 The reduced cardiac efficiency was larger in MYH7 mutation carriers compared with MYBPC3 mutation carriers pointing towards genotype-specific functional differences.9 Our proteomic analyses did not show gene-dependent differences in proteins involved in cardiac energy metabolism. This indicates that the deregulated energy metabolism proteome is a secondary consequence due to cellular stress that is similar in patients with advanced HCM.
Protein Homeostasis Differs Between HCMSMP and HCMSMN
Interestingly, proteins involved in protein translation are less abundant, particularly in HCMSMN patient tissue when compared with nonfailingIVS, implying that the protein translation system is either more impaired or differently regulated in HCMSMN. Among the more abundant proteins, we observed a protein cluster related to protein folding. Protein-folding proteins (chaperones) are needed for correct folding of de novo synthesized proteins as well as for refolding of misfolded mutant or damaged proteins. Since our data show downregulation of protein translation, it is unlikely that protein-folding proteins are upregulated for folding of newly synthesized proteins. Instead, we speculate that their expression is upregulated to repair or remove misfolded (mutant) proteins.43 This is in line with recent data describing an upregulation of protein-folding proteins specifically in HCMSMP samples.44 Protein-folding proteins represent potential treatment targets since boosting their expression has already shown beneficial effects in animal models of other cardiac diseases and in cardiomyopathies.45–47
Impact of Increased Tubulin Network on Cardiomyocyte Function in HCM
A striking observation was the specific upregulation of microtubule subunits and post-translational modification detyrosination in HCMSMP compared with HCMSMN, when comparing both to nonfailingIVS. Previous studies indicated important regulatory roles of microtubules in cardiomyocyte function.48 Recent reports showed that the translation of the sarcomere proteins is localized to the myofilaments which points to a role of microtubules in the transportation of mRNA to the myofilament.49,50 Increased expression of tubulin subunits strengthens the microtubule network and facilitates the transportation of mRNAs to the sarcomere and concomitant increasing cardiomyocyte stability. In addition to tubulins, desmin protein level was significantly higher in HCMSMP than in HCMSMN. In the healthy heart, desmin is localized at the Z-discs forming a striated pattern and playing a central role in cardiomyocyte mechanical stability.51 Overall, these protein changes suggest a compensatory mechanism of the cell to ensure sarcomere stability in the presence of a sarcomere gene mutation.
Furthermore, microtubules and their post-translational modifications play an important role in cardiomyocyte mechanics, especially in regulating cardiomyocyte stiffness.52,53 Detyrosinated tubulin stabilizes microtubules by inhibiting disassembly54 and can anchor microtubules to the Z-discs of the sarcomere, most likely via desmin, and enhance stability and stiffness of the myofilaments and the microtubular network.52 The TUBA4A transcript is directly synthesized in it is detyrosinated form and an upregulation could at least partly explain the increase in detyrosinated tubulin. In our RNA sequencing data, the TUBA4A transcript is, however, significantly downregulated when comparing HCM with nonfailingIVS, and it is not differentially expressed in the direct comparison of HCMSMP and HCMSMN.
Tubulin detyrosination is enzymatically regulated by the tubulin tyrosine ligase and tubulin carboxypeptidases that have detyrosinating activity and also the TUBA4A transcript can undergo these reactions.55 Recently, vasohibins have been identified as the first tubulin detyrosinating enzymes56,57 and act in complex with SVBP (small vasohibin-binding protein). In accordance with findings by Robison et al12 in explanted hearts of heart failure and cardiomyopathy patients,12 we observed a specific upregulation of tubulins and enhanced detyrosination in our genetically well-characterized HCM myectomy samples. Notably, we found the increase in tubulin detyrosination specific for HCMSMP samples. Although levels of detyrosinated tubulin are equal between HCMSMP and HCMSMN when normalized to total levels of α-tubulin, the absolute levels of α-tubulin and detyrosinated tubulin are much higher in HCMSMP and thereby have a much greater impact on contractile function in these patients. Chen et al13 have already demonstrated the reversibility of tubulin detyrosination in isolated cardiomyocytes from explanted HCM hearts associated with an improvement of contractile function.58 Here, we performed proof-of-concept studies in HCM mouse models to define the impact of tubulin detyrosination in the presence of a sarcomere mutation. Homozygous MYBPC32373insG mice replicated the tubulin detyrosination without an increase in total α-tubulin levels, whereas homozygous MYBPC3772G>A mice display an increase in total α-tubulin with a trend to increased tubulin detyrosination. Considering the age difference of the mice with the MYBPC3772G>A mice being much older than the MYBPC32373insG mice at the time of analysis, we speculate that the increase in tubulin detyrosination is an early disease change together with an increase in desmin protein levels, which is followed by an increase of total α-tubulin during disease progression and ageing. In MYBPC32373insG mice, we showed that the increase in tubulin detyrosination is accompanied by reduced contraction and relaxation kinetics in isolated intact cardiomyocytes. Inhibition of tubulin detyrosination by parthenolide restored contraction and relaxation kinetics to WT levels in MYBPC32373insG cardiomyocytes. The used concentration of parthenolide has already been proven to be sufficient to reduce detyrosination of tubulin12,59 and Chen et al13 and Robison et al12 have demonstrated that the parthenolide-induced effects on kinetics of contraction are the same as obtained by overexpression of tubulin tyrosine ligase, which specifically lowers tubulin detyrosination. The positive effect of parthenolide on cardiomyocyte function of MYBPC32373insG cardiomyocytes is, therefore, explained by a decrease in cardiomyocyte stiffness due to lower levels of detyrosinated tubulin.
Overall, our findings in a European patient with HCM cohort strengthens the evidence that increased detyrosination of microtubules contributes to cardiomyocyte stiffness and dysfunction in HCM. Importantly, we show that this is especially true in the presence of a sarcomere mutation.
Study Limitations and Clinical Implications
We sex- and age-matched our experimental groups as good as the availability of human samples allowed us. As seen in the Table, sex and age, as well as most clinical parameters, are not statistically different between groups. We cannot exclude that differences in disease progression, as displayed by the difference in IVS thickness, E/e′ ratio and LVOTg between HCMSMP and HCMSMN, may influence the results. However, collection of patient heart tissue is only possible at the time of myectomy. Therefore, all our samples have the same clinical end point, that is, time of myectomy. This is likely the cause for the low number of genotype-specific protein changes and we cannot exclude that genotype-specific differences might have occurred at earlier disease stages. Due to unavailability of myocardial biopsies from asymptomatic mutation carriers, animal models, and human-derived cardiomyocyte muscle models should provide insight into gene-specific pathomechanisms at early disease stages.
Most of the patients in this study have been on drug therapy, therefore, we cannot exclude that some of the proteomic changes are caused by medication. However, some of the main findings, for example, energy deficiency, have also been observed in animal models,39 and the number of patients on the most commonly used drugs does not differ between HCMSMP and HCMSMN (Table). Therefore, it is more likely that the observed changes are driven by disease rather than medication.
Although we detected and quantified a large number of proteins in this study, we do not reach full coverage of the proteome as this method only reliably quantifies the more abundant proteins. Therefore, our list of differentially expressed proteins is not comprehensive. Also, we did not assess post-translational modifications in the proteomics study which have important regulatory functions. The changes at the protein level reflect whole tissue alterations and cannot be solely assigned to the mutation-carrying cardiomyocytes but might also arise from other cell types. However, cardiomyocytes are responsible for most of the tissue volume and, therefore, drive most of the protein changes.
Homozygous MYBPC32373insG mice do not fully resemble human HCM patients since patients typically carry heterozygous mutations. While both patients and the homozygous MYBPC32373insG mouse model show hypertrophy and diastolic dysfunction, the prominent LV systolic dysfunction as observed in the homozygous MYBPC32373insG mice is not seen in most patients with HCM. But due to the lack of phenotype in heterozygous mice they provide a suitable genetic model of loss of MYBPC3 protein levels.
In our proteomic screen in a large set of human HCM samples, we identified reduced levels of proteins involved in metabolic pathways as the most prominent derailment. This finding supports recent and ongoing clinical trials investigating the therapeutic effect of targeting the metabolism in HCM. Based on the proteomic data and functional studies in a novel HCM mouse model, we propose that an increase in detyrosinated tubulin contributes to the clinical and cellular differences that we see between HCMSMP and HCMSMN samples (Figure 7). Detyrosinated microtubules may represent a target for therapeutic intervention in genetic heart disease because reducing detyrosination improves contractile function in isolated cardiomyocytes. Since the increase in detyrosinated tubulin is largest in HCMSMP, this treatment strategy is proposed to be most beneficial in mutation-positive HCM patients. A specific inhibitor of detyrosination needs to be developed due to the known off-target effects of parthenolide. As sarcomere mutation carriers are identified before disease onset, targeting the microtubules may represent a preventive treatment option.
Figure 7.
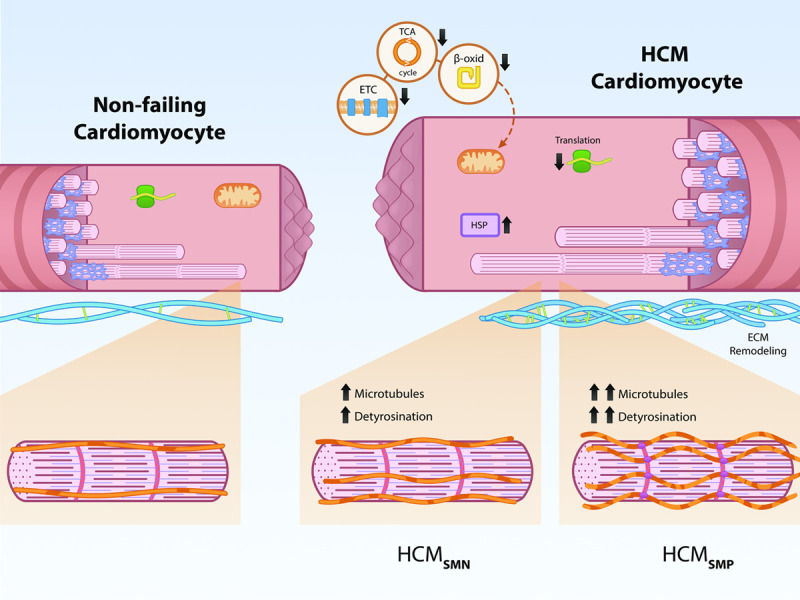
Schematic representation of genotype-independent changes in hypertrophic cardiomyopathy (HCM) and genotype-specific differences in the microtubular system. Our analysis shows that all patients with HCM display downregulation of metabolic pathways (electron transport chain [ETC], tricarboxylic acid [TCA] cycle, β-oxidation [β-oxid]) and ribosomal proteins (translation), as well as an upregulation of protein-folding proteins (HSPs [heat shock proteins]) and ECM (extracellular matrix) proteins. HCMSMP patients have a large increase in microtubules and levels of its detyrosinated form, whereas HCMSMN patients only have a slight increase compared with nonfailing controls.
Acknowledgments
We thank Ruud Zaremba, Valentijn Jansen, and Max Goebel for technical assistance. We thank Feng Zhang for providing the Addgene plasmid no. 42230.
Sources of Funding
We acknowledge the support from the Netherlands Cardiovascular Research Initiative: An initiative with support of the Dutch Heart Foundation, CVON2014-40 DOSIS and NWO (NWO-ZonMW; 91818602 VICI grant to Dr van der Velden). Dr Asselbergs is supported by UCL Hospitals NIHR Biomedical Research Centre. Dr Harakalova is supported by NWO VENI grant (no. 016.176.136). Drs Carrier and Schlossarek are supported by the German Centre for Cardiovascular Research (DZHK), the German Ministry of Research Education (BMBF), the Deutsche Herzstiftung and the Helmut und Charlotte Kassau Stiftung.
Disclosures
None.
Supplemental Material
Supplemental Methods
Tables I–VI
Figures I–XVII
Supplementary Material
Nonstandard Abbreviations and Acronyms
- ECM
- extracellular matrix
- GO
- gene ontology
- HCM
- hypertrophic cardiomyopathy
- IVS
- interventricular septum
- LV
- left ventricular
- SMN
- sarcomere mutation-negative
- SMP
- sarcomere mutation-positive
- WT
- wild type
Drs van der Velden and Kuster contributed equally to this work.
The Data Supplement is available at https://www.ahajournals.org/doi/suppl/10.1161/CIRCHEARTFAILURE.120.007022.
For Sources of Funding and Disclosures, see page 53 and 54
Contributor Information
Maike Schuldt, Email: m.schuldt@amsterdamumc.nl.
Jiayi Pei, Email: J.Pei-2@umcutrecht.nl.
Magdalena Harakalova, Email: m.harakalova@umcutrecht.nl.
Larissa M. Dorsch, Email: l.dorsch@amsterdamumc.nl.
Saskia Schlossarek, Email: sschlossarek@uke.de.
Michal Mokry, Email: m.mokry@umcutrecht.nl.
Jaco C. Knol, Email: j.knol@amsterdamumc.nl.
Thang V. Pham, Email: t.pham@amsterdamumc.nl.
Tim Schelfhorst, Email: t.schelfhorst@nki.nl.
Sander R. Piersma, Email: S.Piersma@vumc.nl.
Cris dos Remedios, Email: crisdosremedios@gmail.com.
Michiel Dalinghaus, Email: m.dalinghaus@erasmusmc.nl.
Michelle Michels, Email: m.michels@erasmusmc.nl.
Folkert W. Asselbergs, Email: f.w.asselbergs@umcutrecht.nl.
Marie-Jo Moutin, Email: moutinm@univ-grenoble-alpes.fr.
Lucie Carrier, Email: l.carrier@uke.de.
Connie R. Jimenez, Email: c.jimenez@amsterdamumc.nl.
References
- 1.Michels M, Olivotto I, Asselbergs FW, van der Velden J. Life-long tailoring of management for patients with hypertrophic cardiomyopathy: awareness and decision-making in changing scenarios. Neth Heart J. 2017;25:186–199. doi: 10.1007/s12471-016-0943-2 [DOI] [PMC free article] [PubMed] [Google Scholar]
- 2.Ingles J, Burns C, Barratt A, Semsarian C. Application of genetic testing in hypertrophic cardiomyopathy for preclinical disease detection. Circ Cardiovasc Genet. 2015;8:852–859. doi: 10.1161/CIRCGENETICS.115.001093 [DOI] [PubMed] [Google Scholar]
- 3.Elliott PM, Anastasakis A, Borger MA, Borggrefe M, Cecchi F, Charron P, Hagege AA, Lafont A, Limongelli G, Mahrholdt H, et al. ; Authors/Task Force. 2014 ESC Guidelines on diagnosis and management of hypertrophic cardiomyopathy: the Task Force for the Diagnosis and Management of Hypertrophic Cardiomyopathy of the European Society of Cardiology (ESC). Eur Heart J. 2014;35:2733–2779. doi: 10.1093/eurheartj/ehu284 [DOI] [PubMed] [Google Scholar]
- 4.Richard P, Charron P, Carrier L, Ledeuil C, Cheav T, Pichereau C, Benaiche A, Isnard R, Dubourg O, Burban M, et al. ; EUROGENE Heart Failure Project. Hypertrophic cardiomyopathy: distribution of disease genes, spectrum of mutations, and implications for a molecular diagnosis strategy. Circulation. 2003;107:2227–2232. doi: 10.1161/01.CIR.0000066323.15244.54 [DOI] [PubMed] [Google Scholar]
- 5.Vakrou S, Fukunaga R, Foster DB, Sorensen L, Liu Y, Guan Y, Woldemichael K, Pineda-Reyes R, Liu T, Tardiff JC, et al. Allele-specific differences in transcriptome, miRNome, and mitochondrial function in two hypertrophic cardiomyopathy mouse models. JCI Insight. 2018;3doi: 10.1172/jci.insight.94493 [DOI] [PMC free article] [PubMed] [Google Scholar]
- 6.Sequeira V, Wijnker PJ, Nijenkamp LL, Kuster DW, Najafi A, Witjas-Paalberends ER, Regan JA, Boontje N, Ten Cate FJ, Germans T, et al. Perturbed length-dependent activation in human hypertrophic cardiomyopathy with missense sarcomeric gene mutations. Circ Res. 2013;112:1491–1505. doi: 10.1161/CIRCRESAHA.111.300436 [DOI] [PMC free article] [PubMed] [Google Scholar]
- 7.Sequeira V, Najafi A, Wijnker PJ, Dos Remedios CG, Michels M, Kuster DW, van der Velden J. ADP-stimulated contraction: a predictor of thin-filament activation in cardiac disease. Proc Natl Acad Sci USA. 2015;112:E7003–E7012. doi: 10.1073/pnas.1513843112 [DOI] [PMC free article] [PubMed] [Google Scholar]
- 8.Ojala M, Prajapati C, Pölönen RP, Rajala K, Pekkanen-Mattila M, Rasku J, Larsson K, Aalto-Setälä K. Mutation-specific phenotypes in hiPSC-derived cardiomyocytes carrying either myosin-binding protein C Or α-tropomyosin mutation for hypertrophic cardiomyopathy. Stem Cells Int. 2016;2016:1684792 doi: 10.1155/2016/1684792 [DOI] [PMC free article] [PubMed] [Google Scholar]
- 9.Witjas-Paalberends ER, Güçlü A, Germans T, Knaapen P, Harms HJ, Vermeer AM, Christiaans I, Wilde AA, Dos Remedios C, Lammertsma AA, et al. Gene-specific increase in the energetic cost of contraction in hypertrophic cardiomyopathy caused by thick filament mutations. Cardiovasc Res. 2014;103:248–257. doi: 10.1093/cvr/cvu127 [DOI] [PubMed] [Google Scholar]
- 10.Ho CY, Lakdawala NK, Cirino AL, Lipshultz SE, Sparks E, Abbasi SA, Kwong RY, Antman EM, Semsarian C, González A, et al. Diltiazem treatment for pre-clinical hypertrophic cardiomyopathy sarcomere mutation carriers: a pilot randomized trial to modify disease expression. JACC Heart Fail. 2015;3:180–188. doi: 10.1016/j.jchf.2014.08.003 [DOI] [PMC free article] [PubMed] [Google Scholar]
- 11.Ho CY, Day SM, Ashley EA, Michels M, Pereira AC, Jacoby D, Cirino AL, Fox JC, Lakdawala NK, Ware JS, et al. Genotype and lifetime burden of disease in hypertrophic cardiomyopathy: insights from the sarcomeric human cardiomyopathy registry (SHaRe). Circulation. 2018;138:1387–1398. doi: 10.1161/CIRCULATIONAHA.117.033200 [DOI] [PMC free article] [PubMed] [Google Scholar]
- 12.Robison P, Caporizzo MA, Ahmadzadeh H, Bogush AI, Chen CY, Margulies KB, Shenoy VB, Prosser BL. Detyrosinated microtubules buckle and bear load in contracting cardiomyocytes. Science. 2016;352:aaf0659 doi: 10.1126/science.aaf0659 [DOI] [PMC free article] [PubMed] [Google Scholar]
- 13.Chen CY, Caporizzo MA, Bedi K, Vite A, Bogush AI, Robison P, Heffler JG, Salomon AK, Kelly NA, Babu A, et al. Suppression of detyrosinated microtubules improves cardiomyocyte function in human heart failure. Nat Med. 2018;24:1225–1233. doi: 10.1038/s41591-018-0046-2 [DOI] [PMC free article] [PubMed] [Google Scholar]
- 14.van Dijk SJ, Dooijes D, dos Remedios C, Michels M, Lamers JM, Winegrad S, Schlossarek S, Carrier L, ten Cate FJ, Stienen GJ, et al. Cardiac myosin-binding protein C mutations and hypertrophic cardiomyopathy: haploinsufficiency, deranged phosphorylation, and cardiomyocyte dysfunction. Circulation. 2009;119:1473–1483. doi: 10.1161/CIRCULATIONAHA.108.838672 [DOI] [PubMed] [Google Scholar]
- 15.Alfares AA, Kelly MA, McDermott G, Funke BH, Lebo MS, Baxter SB, Shen J, McLaughlin HM, Clark EH, Babb LJ, et al. Results of clinical genetic testing of 2,912 probands with hypertrophic cardiomyopathy: expanded panels offer limited additional sensitivity. Genetics Med. 2015;17:880 doi: 10.1038/gim.2014.205 [DOI] [PubMed] [Google Scholar]
- 16.Warmoes M, Jaspers JE, Pham TV, Piersma SR, Oudgenoeg G, Massink MP, Waisfisz Q, Rottenberg S, Boven E, Jonkers J, et al. Proteomics of mouse BRCA1-deficient mammary tumors identifies DNA repair proteins with potential diagnostic and prognostic value in human breast cancer. Mol Cell Proteomics. 2012;11:M111.013334 doi: 10.1074/mcp.M111.013334 [DOI] [PMC free article] [PubMed] [Google Scholar]
- 17.Piersma SR, Broxterman HJ, Kapci M, de Haas RR, Hoekman K, Verheul HM, Jiménez CR. Proteomics of the TRAP-induced platelet releasate. J Proteomics. 2009;72:91–109. doi: 10.1016/j.jprot.2008.10.009 [DOI] [PubMed] [Google Scholar]
- 18.Perez-Riverol Y, Csordas A, Bai J, Bernal-Llinares M, Hewapathirana S, Kundu DJ, Inuganti A, Griss J, Mayer G, Eisenacher M, et al. The PRIDE database and related tools and resources in 2019: improving support for quantification data. Nucleic Acids Res. 2019;47:D442–D450. doi: 10.1093/nar/gky1106 [DOI] [PMC free article] [PubMed] [Google Scholar]
- 19.Pham TV, Piersma SR, Warmoes M, Jimenez CR. On the beta-binomial model for analysis of spectral count data in label-free tandem mass spectrometry-based proteomics. Bioinformatics. 2010;26:363–369. doi: 10.1093/bioinformatics/btp677 [DOI] [PubMed] [Google Scholar]
- 20.Shannon P, Markiel A, Ozier O, Baliga NS, Wang JT, Ramage D, Amin N, Schwikowski B, Ideker T. Cytoscape: a software environment for integrated models of biomolecular interaction networks. Genome Res. 2003;13:2498–2504. doi: 10.1101/gr.1239303 [DOI] [PMC free article] [PubMed] [Google Scholar]
- 21.Maere S, Heymans K, Kuiper M. BiNGO: a Cytoscape plugin to assess overrepresentation of gene ontology categories in biological networks. Bioinformatics. 2005;21:3448–3449. doi: 10.1093/bioinformatics/bti551 [DOI] [PubMed] [Google Scholar]
- 22.Nepusz T, Yu H, Paccanaro A. Detecting overlapping protein complexes in protein-protein interaction networks. Nat Methods. 2012;9:471–472. doi: 10.1038/nmeth.1938 [DOI] [PMC free article] [PubMed] [Google Scholar]
- 23.Chen J, Bardes EE, Aronow BJ, Jegga AG. ToppGene Suite for gene list enrichment analysis and candidate gene prioritization. Nucleic Acids Res. 2009;37Web Server issueW305–W311. doi: 10.1093/nar/gkp427 [DOI] [PMC free article] [PubMed] [Google Scholar]
- 24.Heberle H, Meirelles GV, da Silva FR, Telles GP, Minghim R. InteractiVenn: a web-based tool for the analysis of sets through Venn diagrams. BMC Bioinformatics. 2015;16:169 doi: 10.1186/s12859-015-0611-3 [DOI] [PMC free article] [PubMed] [Google Scholar]
- 25.Vignier N, Schlossarek S, Fraysse B, Mearini G, Krämer E, Pointu H, Mougenot N, Guiard J, Reimer R, Hohenberg H, et al. Nonsense-mediated mRNA decay and ubiquitin-proteasome system regulate cardiac myosin-binding protein C mutant levels in cardiomyopathic mice. Circ Res. 2009;105:239–248. doi: 10.1161/CIRCRESAHA.109.201251 [DOI] [PubMed] [Google Scholar]
- 26.Najafi A, Schlossarek S, van Deel ED, van den Heuvel N, Güçlü A, Goebel M, Kuster DW, Carrier L, van der Velden J. Sexual dimorphic response to exercise in hypertrophic cardiomyopathy-associated MYBPC3-targeted knock-in mice. Pflugers Arch. 2015;467:1303–1317. doi: 10.1007/s00424-014-1570-7 [DOI] [PubMed] [Google Scholar]
- 27.Nijenkamp LLAM, Bollen IAE, van Velzen HG, Regan JA, van Slegtenhorst M, Niessen HWM, Schinkel AFL, Krüger M, Poggesi C, Ho CY, et al. Sex Differences at the Time of Myectomy in Hypertrophic Cardiomyopathy. Circ Heart Fail. 2018;11:e004133 doi: 10.1161/CIRCHEARTFAILURE.117.004133 [DOI] [PubMed] [Google Scholar]
- 28.Nagueh SF, Appleton CP, Gillebert TC, Marino PN, Oh JK, Smiseth OA, Waggoner AD, Flachskampf FA, Pellikka PA, Evangelista A. Recommendations for the evaluation of left ventricular diastolic function by echocardiography. J Am Soc Echocardiogr. 2009;22:107–33. doi: 10.1016/j.echo.2008.11.023 [DOI] [PubMed] [Google Scholar]
- 29.Lang RM, Bierig M, Devereux RB, Flachskampf FA, Foster E, Pellikka PA, Picard MH, Roman MJ, Seward J, Shanewise JS, et al. ; Chamber Quantification Writing Group; American Society of Echocardiography’s Guidelines and Standards Committee; European Association of Echocardiography. Recommendations for chamber quantification: a report from the American Society of Echocardiography’s Guidelines and Standards Committee and the Chamber Quantification Writing Group, developed in conjunction with the European Association of Echocardiography, a branch of the European Society of Cardiology. J Am Soc Echocardiogr. 2005;18:1440–1463. doi: 10.1016/j.echo.2005.10.005 [DOI] [PubMed] [Google Scholar]
- 30.Maron MS, Appelbaum E, Harrigan CJ, Buros J, Gibson CM, Hanna C, Lesser JR, Udelson JE, Manning WJ, Maron BJ. Clinical profile and significance of delayed enhancement in hypertrophic cardiomyopathy. Circ Heart Fail. 2008;1:184–191. doi: 10.1161/CIRCHEARTFAILURE.108.768119 [DOI] [PubMed] [Google Scholar]
- 31.Purcell NH, Darwis D, Bueno OF, Muller JM, Schule R, Molkentin JD. Extracellular signal-regulated kinase 2 interacts with and is negatively regulated by the LIM-only protein FHL2 in cardiomyocytes. Mol Cell Biol. 2004;24:1081–1095. doi: 10.1128/mcb.24.3.1081-1095.2004 [DOI] [PMC free article] [PubMed] [Google Scholar]
- 32.Lowes BD, Minobe W, Abraham WT, Rizeq MN, Bohlmeyer TJ, Quaife RA, Roden RL, Dutcher DL, Robertson AD, Voelkel NF, et al. Changes in gene expression in the intact human heart. Downregulation of alpha-myosin heavy chain in hypertrophied, failing ventricular myocardium. J Clin Invest. 1997;100:2315–2324. doi: 10.1172/JCI119770 [DOI] [PMC free article] [PubMed] [Google Scholar]
- 33.Nakao K, Minobe W, Roden R, Bristow MR, Leinwand LA. Myosin heavy chain gene expression in human heart failure. J Clin Invest. 1997;100:2362–2370. doi: 10.1172/JCI119776 [DOI] [PMC free article] [PubMed] [Google Scholar]
- 34.Marston S, Copeland O, Gehmlich K, Schlossarek S, Carrier L. How do MYBPC3 mutations cause hypertrophic cardiomyopathy? J Muscle Res Cell Motil. 2012;33:75–80. doi: 10.1007/s10974-011-9268-3 [DOI] [PubMed] [Google Scholar]
- 35.Heineke J, Molkentin JD. Regulation of cardiac hypertrophy by intracellular signalling pathways. Nat Rev Mol Cell Biol. 2006;7:589–600. doi: 10.1038/nrm1983 [DOI] [PubMed] [Google Scholar]
- 36.Matsui T, Nagoshi T, Rosenzweig A. Akt and PI 3-kinase signaling in cardiomyocyte hypertrophy and survival. Cell Cycle. 2003;2:220–223. [PubMed] [Google Scholar]
- 37.Moolman JA, Reith S, Uhl K, Bailey S, Gautel M, Jeschke B, Fischer C, Ochs J, McKenna WJ, Klues H, et al. A newly created splice donor site in exon 25 of the MyBP-C gene is responsible for inherited hypertrophic cardiomyopathy with incomplete disease penetrance. Circulation. 2000;101:1396–1402. doi: 10.1161/01.cir.101.12.1396 [DOI] [PubMed] [Google Scholar]
- 38.Coats CJ, Heywood WE, Virasami A, Ashrafi N, Syrris P, Dos Remedios C, Treibel TA, Moon JC, Lopes LR, McGregor CGA, et al. Proteomic analysis of the myocardium in hypertrophic obstructive cardiomyopathy. Circ Genom Precis Med. 2018;11:e001974 doi: 10.1161/CIRCGEN.117.001974 [DOI] [PubMed] [Google Scholar]
- 39.Luedde M, Flögel U, Knorr M, Grundt C, Hippe HJ, Brors B, Frank D, Haselmann U, Antony C, Voelkers M, et al. Decreased contractility due to energy deprivation in a transgenic rat model of hypertrophic cardiomyopathy. J Mol Med (Berl). 2009;87:411–422. doi: 10.1007/s00109-008-0436-x [DOI] [PubMed] [Google Scholar]
- 40.Guclu A, Knaapen P, Harms HJ, Parbhudayal RY, Michels M, Lammertsma AA, van Rossum AC, Germans T, van der Velden J. Disease stage-dependent changes in cardiac contractile performance and oxygen utilization underlie reduced myocardial efficiency in human inherited hypertrophic cardiomyopathy. Circ Cardiovasc Imaging. 2017;10:e005604 doi: 10.1161/CIRCIMAGING.116.005604 [DOI] [PubMed] [Google Scholar]
- 41.Crilley JG, Boehm EA, Blair E, Rajagopalan B, Blamire AM, Styles P, McKenna WJ, Ostman-Smith I, Clarke K, Watkins H. Hypertrophic cardiomyopathy due to sarcomeric gene mutations is characterized by impaired energy metabolism irrespective of the degree of hypertrophy. J Am Coll Cardiol. 2003;41:1776–1782. doi: 10.1016/s0735-1097(02)03009-7 [DOI] [PubMed] [Google Scholar]
- 42.Ashrafian H, Redwood C, Blair E, Watkins H. Hypertrophic cardiomyopathy:a paradigm for myocardial energy depletion. Trends Genet. 2003;19:263–268. doi: 10.1016/S0168-9525(03)00081-7 [DOI] [PubMed] [Google Scholar]
- 43.Tarone G, Brancaccio M. Keep your heart in shape: molecular chaperone networks for treating heart disease. Cardiovasc Res. 2014;102:346–361. doi: 10.1093/cvr/cvu049 [DOI] [PubMed] [Google Scholar]
- 44.Dorsch LM, Schuldt M, dos Remedios CG, Schinkel AFL, de Jong PL, Michels M, Kuster DWD, Brundel B, van der Velden J. Protein quality control activation and microtubule remodeling in hypertrophic cardiomyopathy. Cells. 2019;8:741 doi: 10.3390/cells8070741 [DOI] [PMC free article] [PubMed] [Google Scholar]
- 45.Dorsch LM, Schuldt M, Knezevic D, Wiersma M, Kuster DWD, van der Velden J, Brundel B. Untying the knot: protein quality control in inherited cardiomyopathies. Pflugers Arch. 2018;471:795–806. doi: 10.1007/s00424-018-2194-0 [DOI] [PMC free article] [PubMed] [Google Scholar]
- 46.Sanbe A, Daicho T, Mizutani R, Endo T, Miyauchi N, Yamauchi J, Tanonaka K, Glabe C, Tanoue A. Protective effect of geranylgeranylacetone via enhancement of HSPB8 induction in desmin-related cardiomyopathy. PLoS One. 2009;4:e5351 doi: 10.1371/journal.pone.0005351 [DOI] [PMC free article] [PubMed] [Google Scholar]
- 47.Bhuiyan MS, Pattison JS, Osinska H, James J, Gulick J, McLendon PM, Hill JA, Sadoshima J, Robbins J. Enhanced autophagy ameliorates cardiac proteinopathy. J Clin Invest. 2013;123:5284–5297. doi: 10.1172/JCI70877 [DOI] [PMC free article] [PubMed] [Google Scholar]
- 48.Grimes KM, Prasad V, McNamara JW. Supporting the heart: Functions of the cardiomyocyte’s non-sarcomeric cytoskeleton. J Mol Cell Cardiol. 2019;131:187–196. doi: 10.1016/j.yjmcc.2019.04.002 [DOI] [PMC free article] [PubMed] [Google Scholar]
- 49.Lewis YE, Moskovitz A, Mutlak M, Heineke J, Caspi LH, Kehat I. Localization of transcripts, translation, and degradation for spatiotemporal sarcomere maintenance. J Mol Cell Cardiol. 2018;116:16–28. doi: 10.1016/j.yjmcc.2018.01.012 [DOI] [PubMed] [Google Scholar]
- 50.Scholz D, Baicu CF, Tuxworth WJ, Xu L, Kasiganesan H, Menick DR, Cooper GT. Microtubule-dependent distribution of mRNA in adult cardiocytes. Am J Physiol Heart Circ Physiol. 2008;294:H1135–H1144. doi: 10.1152/ajpheart.01275.2007 [DOI] [PubMed] [Google Scholar]
- 51.Thottakara T, Friedrich FW, Reischmann S, Braumann S, Schlossarek S, Kramer E, Juhr D, Schluter H, van der Velden J, Munch J, et al. The E3 ubiquitin ligase Asb2beta is downregulated in a mouse model of hypertrophic cardiomyopathy and targets desmin for proteasomal degradation. J Mol Cell Cardiol. 2015;87:214–24. doi: 10.1016/j.yjmcc.2015.08.020 [DOI] [PubMed] [Google Scholar]
- 52.Robison P, Prosser BL. Microtubule mechanics in the working myocyte. J Physiol. 2017;595:3931–3937. doi: 10.1113/JP273046 [DOI] [PMC free article] [PubMed] [Google Scholar]
- 53.Zile MR, Koide M, Sato H, Ishiguro Y, Conrad CH, Buckley JM, Morgan JP, Cooper G., 4th. Role of microtubules in the contractile dysfunction of hypertrophied myocardium. J Am Coll Cardiol. 1999;33:250–260. doi: 10.1016/s0735-1097(98)00550-6 [DOI] [PubMed] [Google Scholar]
- 54.Infante AS, Stein MS, Zhai Y, Borisy GG, Gundersen GG. Detyrosinated (Glu) microtubules are stabilized by an ATP-sensitive plus-end cap. J Cell Sci. 2000;113pt 223907–3919. [DOI] [PubMed] [Google Scholar]
- 55.Nieuwenhuis J, Brummelkamp TR. The tubulin detyrosination cycle: function and enzymes. Trends Cell Biol. 2019;29:80–92. doi: 10.1016/j.tcb.2018.08.003 [DOI] [PubMed] [Google Scholar]
- 56.Aillaud C, Bosc C, Peris L, Bosson A, Heemeryck P, Van Dijk J, Le Friec J, Boulan B, Vossier F, Sanman LE, et al. Vasohibins/SVBP are tubulin carboxypeptidases (TCPs) that regulate neuron differentiation. Science. 2017;358:1448–1453. doi: 10.1126/science.aao4165 [DOI] [PubMed] [Google Scholar]
- 57.Nieuwenhuis J, Adamopoulos A, Bleijerveld OB, Mazouzi A, Stickel E, Celie P, Altelaar M, Knipscheer P, Perrakis A, Blomen VA, et al. Vasohibins encode tubulin detyrosinating activity. Science. 2017;358:1453–1456. doi: 10.1126/science.aao5676 [DOI] [PubMed] [Google Scholar]
- 58.Kerr JP, Robison P, Shi G, Bogush AI, Kempema AM, Hexum JK, Becerra N, Harki DA, Martin SS, Raiteri R, et al. Detyrosinated microtubules modulate mechanotransduction in heart and skeletal muscle. Nat Commun. 2015;6:8526 doi: 10.1038/ncomms9526 [DOI] [PMC free article] [PubMed] [Google Scholar]
- 59.Swiatlowska P, Sanchez-Alonso JL, Wright PT, Novak P, Gorelik J. Microtubules regulate cardiomyocyte transversal Young’s modulus. Proc Natl Acad Sci USA. 2020;117:2764–2766. doi: 10.1073/pnas.1917171117 [DOI] [PMC free article] [PubMed] [Google Scholar]
- 60.Dobin A, Davis CA, Schlesinger F, Drenkow J, Zaleski C, Jha S, Batut P, Chaisson M, Gingeras TR. STAR: ultrafast universal RNA-seq aligner. Bioinformatics. 2013;29:15–21. doi: 10.1093/bioinformatics/bts635 [DOI] [PMC free article] [PubMed] [Google Scholar]
- 61.Tarasov A, Vilella AJ, Cuppen E, Nijman IJ, Prins P. Sambamba: fast processing of NGS alignment formats. Bioinformatics. 2015;31:2032–2034. doi: 10.1093/bioinformatics/btv098 [DOI] [PMC free article] [PubMed] [Google Scholar]
- 62.Aransay AM, Lavín Trueba JL. Field Guidelines for Genetic Experimental Designs in High-Throughput Sequencing. 2016. http://link.springer.com/book/10.1007/978-3-319-31350-4 [Google Scholar]
- 63.Robinson MD, McCarthy DJ, Smyth GK. edgeR: a Bioconductor package for differential expression analysis of digital gene expression data. Bioinformatics. 2010;26:139–140. doi: 10.1093/bioinformatics/btp616 [DOI] [PMC free article] [PubMed] [Google Scholar]
- 64.Love MI, Huber W, Anders S. Moderated estimation of fold change and dispersion for RNA-seq data with DESeq2. Genome Biol. 2014;15:550 doi: 10.1186/s13059-014-0550-8 [DOI] [PMC free article] [PubMed] [Google Scholar]
- 65.Afgan E, Baker D, Batut B, van den Beek M, Bouvier D, Cech M, Chilton J, Clements D, Coraor N, Grüning BA, et al. The Galaxy platform for accessible, reproducible and collaborative biomedical analyses: 2018 update. Nucleic Acids Res. 2018;46W1W537–W544. doi: 10.1093/nar/gky379 [DOI] [PMC free article] [PubMed] [Google Scholar]
- 66.Subramanian A, Tamayo P, Mootha VK, Mukherjee S, Ebert BL, Gillette MA, Paulovich A, Pomeroy SL, Golub TR, Lander ES, et al. Gene set enrichment analysis: a knowledge-based approach for interpreting genome-wide expression profiles. Proc Natl Acad Sci USA. 2005;102:15545–15550. doi: 10.1073/pnas.0506580102 [DOI] [PMC free article] [PubMed] [Google Scholar]
- 67.Cong L, Ran FA, Cox D, Lin S, Barretto R, Habib N, Hsu PD, Wu X, Jiang W, Marraffini LA, et al. Multiplex genome engineering using CRISPR/Cas systems. Science. 2013;339:819–823. doi: 10.1126/science.1231143 [DOI] [PMC free article] [PubMed] [Google Scholar]
Associated Data
This section collects any data citations, data availability statements, or supplementary materials included in this article.