



Abstract
Cell-free Xenopus egg extract is a widely used and biochemically tractable model system that allows recapitulation and elucidation of fundamental cellular processes. Recently, the introduction of microfluidic extract manipulation has enabled compartmentalization of bulk extract and a newfound ability to study organelles on length scales that recapitulate key features of cellular morphology. While the microfluidic confinement of extracts has produced a compelling platform for the in vitro study of cell processes at physiologically-relevant length scales, it also imposes experimental limitations by restricting dynamic control over extract properties. Here, we introduce photodegradable polyethylene glycol (PEG) hydrogels as a vehicle to passively and selectively manipulate extract composition through the release of proteins encapsulated within the hydrogel matrix. Photopatterned PEG hydrogels, passive to both extract and encapsulated proteins, serve as protein depots within microfluidic channels, which are subsequently flooded with extract. Illumination by ultraviolet light (UV) degrades the hydrogel structures and releases encapsulated protein. We show that an engineered fluorescent protein with a nuclear localization signal (GST-GFP-NLS) retains its ability to localize within nearby nuclei following UV-induced release from hydrogel structures. When diffusion is considered, the kinetics of nuclear accumulation are similar to those in experiments utilizing conventional, bulk fluid handling. Similarly, the release of recombinant cyclin B Δ90, a mutant form of the master cell cycle regulator cyclin B which lacks the canonical destruction box, was able to induce the expected cell cycle transition from interphase to mitosis. This transition was confirmed by the observation of nuclear envelope breakdown (NEBD), a phenomenological hallmark of mitosis, and the induction of mitosis-specific biochemical markers. This approach to extract manipulation presents a versatile and customizable route to regulating the spatial and temporal dynamics of cellular events in microfluidically confined cell-free extracts.
Graphical Abstract

Introduction
Xenopus cell-free egg extracts are a versatile and powerful biological model system for elucidating mechanisms fundamental to cell division 1–8. The model system confers several advantages over other traditional cell biological approaches, including the ability to recapitulate specific cell cycle events, e.g. nucleus and mitotic spindle assembly 9, 10, and exquisite control of progression through stages of the cell cycle 1, 2, 11, 12. The cell-free nature of these extracts also allows for straightforward manipulation of the system in terms of composition and physical perturbation as reagents can be added directly to extract in the test tube and assembled structures can be physically probed easily using microneedles 5, 13–15
Historically, Xenopus egg extracts have been manipulated as bulk solutions in the test tube 5, 7, but more recently different containment platforms have been used to study cellular processes in extracts under confinement. For example, Ferrell and colleagues used extracts confined in capillary tubes to study mitotic trigger wave propagation 16, 17. PDMS devices sealed or bonded to coverslips have been used to create wells or confining reservoirs, facilitating the study of mitotic spindle and nucleus assembly dynamics 18, 19. In addition to these continuous phase studies, microfluidics devices have also been used to produce monodisperse extract-in-oil emulsion droplets 20, a combination that provides a powerful approach to study the effects of cytoplasmic volume on intracellular processes and scaling phenomenology 21–23. Though greatly increasing the utility of the system in terms of addressable scientific questions, confinement inherently requires sacrificing the open nature of the system.
Microfluidic platforms have long been regarded for their ability to study subtle responses in dynamic biological systems 24–26. The widespread use of gas-permeable PDMS microfluidic devices supports long term cell growth 24, 27, and devices can be readily bonded to coverslips to facilitate high-resolution fluorescent imaging 21, 27. The facile introduction and manipulation of fluids within microfluidic devices provides a significant advantage over stencils and capillaries. The formation of static 28–30 or dynamic 31–33 gradients under laminar flow or quiescent conditions presents a unique opportunity directly manipulate biochemical environments with precise spatial and temporal control. These systems have been used to study bacterial chemotaxis to a substrate 33, neutrophil migration 34–36, 37, paracrine signaling 38, and drug screening against cultured cells 39–41. These techniques for molecular exchange with a sample of interest, while diverse, all rely upon the stable or sequential manipulation of microfluidic flows. Experimental work with extracts, however, has been fundamentally limited to steady state behavior under quiescent conditions because flow would disturb spatially determined processes and the integrity of formed structures. In many instances, flows would completely displace or replace the sample volume of interest. This imposition prevents the biochemical manipulation of the desired state including cell cycle regulation in cell-free extracts. Device platforms capable of dynamically modifying the biochemical environment would therefore introduce the ability to examine a variety of new and fundamental questions that could be explored with microfluidic devices.
Here, we introduce an approach that allows for controlled light-activated release of molecules into confined extracts. This technique exploits photodegradable poly(ethylene glycol) (PEG)-based hydrogels that display excellent compatibility with complex biological systems due to their high water content, mechanical similarity to tissues, and resistance to protein adsorption 42, 43. Their biocompatibility has made PEG hydrogels an attractive material as cell scaffolds for tissue engineering 44 and regenerative medicine applications 45. The synthetic versatility of PEG macromers has produced hydrogels with exquisite and reconfigurable spatial and temporal properties that have been shown to influence cell motility 46, 47, stem cell differentiation 48, and tissue morphogenesis 49, 50.
Photodegradable PEG hydrogels have also been designed with programmed degradability to retain and release therapeutic molecules 51, proteins 52, and nucleic acids 53 with quantifiably predictable 54 schedules. Techniques to manipulate extracellular environments have focused on demonstrations of dynamic biochemical presentation55 and mechanical restructuring of materials56. The feasibility of molecular delivery systems has also been shown for hydrophobic small molecules57, gene silencing nucleic acids58, and therapeutic proteins59. Photoactivated molecules have previously been used to facilitate imaging in cytoplasmic extracts60, but the use of photolabile depots has not been demonstrated with Xenopus model systems.
The ease of hydrogel crosslinking by photopolymerization has led to a host of hydrogel miniaturization strategies based upon photolithographic patterning within microfluidic channels. Active 61 and passive 62 hydrogel microfluidic flow control elements, as well as hydrogel sensors 63 have been integrated into microsystems by in situ fabrication techniques. Microfluidic-integrated antibody-decorated hydrogels have also been formed by photopolymerization-enabled micromolding for the capture and release of rare cells from flowing samples 64. Recently, photodegradable PEG hydrogels have been introduced 65 and photopatterned 48, 50 to produce complex, photodynamic structures. Partial or complete degradation of these materials can be utilized to achieve the controlled and on-demand release of large solutes upon light-activated erosion. In the current work, we encapsulate a mitosis-inducing protein within photodegradable PEG structures that are formed within microfluidic channels. Channels are subsequently flooded with Xenopus egg extract and the PEG structures are eroded to induce the onset of mitosis. The developed platform allows for dynamic reconfiguration of the biochemical environment of Xenopus egg extracts by the selective addition of functional proteins combining the versatility and convenience of Xenopus egg extracts with microfluidic manipulation techniques for deliberate, temporal control over cellular processes.
Experimental
Microfluidic Fabrication
Microfluidic devices were fabricated using standard soft lithography techniques 66–68. Briefly, a silicon wafer (Silicon Inc. USA) was photolithographically patterned with SU-8 50 negative photoresist (MicroChem, MA, USA) with a thickness of 50 μm. Features were polymerized by exposure to collimated ultraviolet light (Omnicure S2000, USA) through a photomask (CAD/Art Services, OR) and uncured photoresist was removed with developer (propylene glycol monomethyl ether acetate, Sigma-Aldrich, USA). Polydimethylsiloxane (PDMS, Dow Corning, MI) was cast upon the photopatterned silicon wafer and cured at 70°C for at least four hours. The cured elastomer replica was removed from the silicon mold, trimmed, and punched with a sharpened 20G dispensing needle (Brico Medical Supplies, Inc., USA) to fashion inlet and outlet holes. Finished devices were created by bonding PDMS replicas to glass cover slips (1.0 Fisher) following exposure to an oxygen plasma 69. A second channel was bonded to the top of the fluidic PDMS layer for the purposes of nitrogen purging. This channel was punched with a single inlet port and coupled to a nitrogen source at a pressure of 15 psig.
Macromolecular Synthesis
Poly(ethylene glycol) di-photodegradable acrylate (PEGdiPDA, Mn ~4,070 Da) was synthesized as previously reported 65, 70. Briefly, an acryalted o-nitrobenzyl ether was synthesized and coupled to poly(ethylene glycol) bisamine (Mn ~3400 Da). The resulting photolabile monomer was capable of photopolymerization in the presence of photoinitiator (lithium phenyl-2,4,6-trimethylbenzoylphosphinate, LAP) 71 and UV light in the 400 – 500 nm range and photodegradation by irradiation with UV light at 365 nm.
PEG Micro-patterning & Protein Encapsulation and Release
Two hydrogel forming monomer solutions were formed by combining PEGdiPDA, LAP, the selected proteins, and 1X CSF-XB buffer (100 mM KCl, 0.1 mM CaCl2, 1 mM MgCl2, 50 mM Sucrose, 10 mM Hepes, and 5 mM EGTA at pH 7.7). A control solution of 8.2 wt% PEGdiPDA and 0.8 wt% LAP was mixed in 1X CSF-XB buffer. A protein-containing solution of 8.2 wt% PEGdiPDA, 0.8 wt% LAP and 26.6 µM cyclin B Δ90 mixed in 1X CSF-XB buffer. To form hydrogel post arrays, the hydrogel-forming monomer solution was introduced into a prepared microfluidic device and placed on the microscope stage. Devices were subsequently purged with nitrogen gas for 10 min before proceeding.
An Olympus IX71 microscope with an automated shutter, stage, and fluorescent light source was utilized to form hydrogel posts. The iris in the microscope’s field aperture was adjusted to project the desired illumination area, and therefore polymerization region, upon photoirradiation. Hydrogel posts were photopolymerized by exposing the precursor solution to UV light, passed through a 405 nm long pass filter. A custom journal created in MetaMorph® 7.7 software (Molecular Devices) was used to create a staggered pattern of hydrogel posts along the length of the channel. This journal exposed a region for 280 ms to polymerize a post, moved the stage to the next location for polymerization, and repeated the process until all posts needed were formed, occupying a volume fraction of 2.36% within the devices.
Once the posts were formed the device was gently flushed with CSF-XB buffer to remove any unpolymerized hydrogel forming solution. Devices were protected from light and soaked in CSF-XB buffer for a minimum of 2 hours before use to prevent water loss from the extract by permeation into and through the PDMS device 72 (Fig. 1a). After soaking, devices were filled with cell-free egg extract containing interphase nuclei (Fig. 1b) and were subsequently exposed to UV light (λ~365 nm at an intensity of 15,000 µW/cm2 at a working distance of 15 cm) for three 1 min pulses separated by a 30s pause using a Black-Ray UV Lamp (UVP Blak-Ray™) or by exposing through a DAPI filter on a confocal or widefield microscope with two 30 sec exposures separated by a 30s pause) to degrade the posts releasing the content of the post (Fig. 1c).
Figure 1.
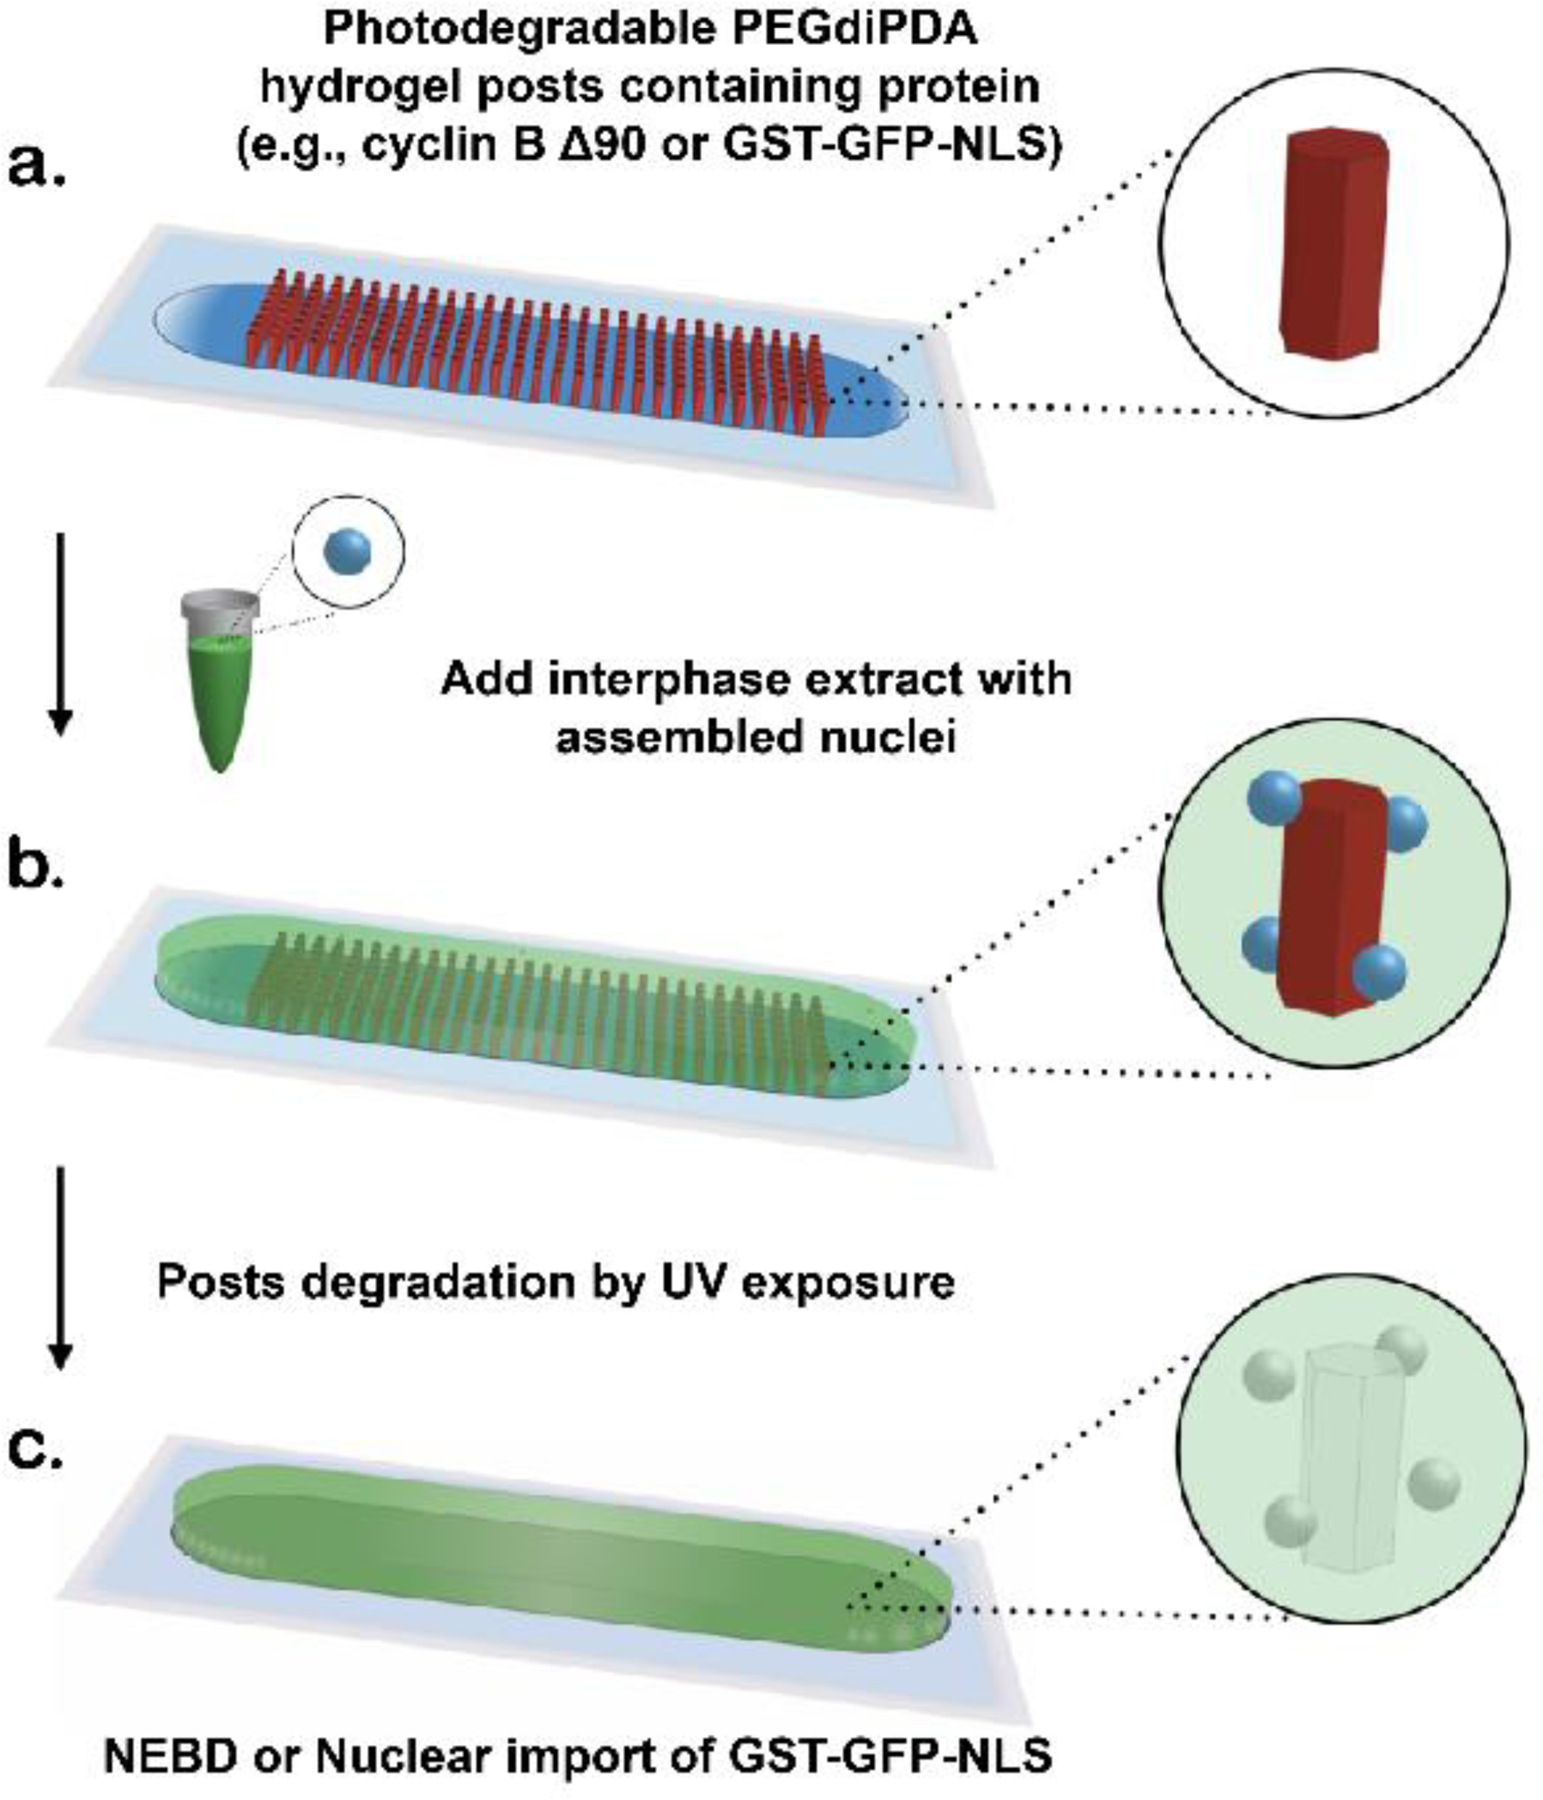
Schematic showing device concept and overview of light-mediated control of protein release from hydrogel structures (not drawn to scale). a) Microfluidic chambers are filled with protein-laden hydrogel posts using photopatterned illumination (red). b) Unpolymerized PEGdiPDA-protein solution is flushed out and replaced with interphase extract (green) containing assembled nuclei (blue). c) Illumination with 365 nm UV light is used to degrade the hydrogel structures, releasing the protein into the surrounding interphase extract where it accumulates in nuclei (in the case of GST-GFP-NLS) or initiates NEBD and cycles the extract into biochemical mitosis (in the case of cyclin B ∆90).
Nuclear assembly in Xenopus egg extract
Xenopus egg extracts were prepared from oocytes arrested in meiotic metaphase (cytostatic factor –arrested extracts, CSF extracts) as described elsewhere 5, 10, 73. To assemble interphase nuclei, the arrested egg extract was supplemented with calcium (0.4 mM) and de-membraneted Xenopus sperm nuclei ~200 sperm nuclei/µL 74 and was then incubated at 16°C for a total duration of 80 min. To block protein synthesis and reentry of interphase extracts into mitosis, cycloheximide (100 µg/mL) was added before calcium addition to these extracts. During the incubation period, GST-mCherry-NLS or FITC-labeled 150 kDa dextran (Sigma), antibody against nuclear pore complex proteins MAb414 (BioLegend) with Alexa Fluor 568 labeled secondary antibody (Abcam) were added to the extract to monitor the permeability of the nuclei and visualization of the nuclear membrane, respectively. Extracts were also supplemented with Hoechst 33258 (Sigma) at 1 µg/ml to visualize nuclear DNA upon nuclear envelope break down (NEBD).
Recombinant protein expression and purification
A pET3b expression vector for non-degradable cyclin B from sea urchin (cyclin B Δ90) was used to express and purify cyclin B Δ90 as previously described 75 with the following modifications. The expression vector was transformed into BL21(DE3) pLysS E.coli competent cells and was grown at 37°C to O.D600 0.6. Cyclin B Δ90 protein expression was induced for 4 hours by adding IPTG (0.5 mM). The cells were pelleted by centrifugation at 6,000 rpm for 20 min in JA-10 rotor using a Beckman J2–21M centrifuge. The supernatant was discarded, and the cell pellet was washed in 0.9% NaCl and then again pelleted and resuspended in 25 mL of buffer A (10mM Tris, 50mM NaCl, 1 mM EDTA, pH- 8.0) also containing 5 mM DTT, 0.05% Nonidet P-40 and 10ug/ml Chymostatin, Pepstatin and Leupeptin. The extract was sonicated for 4 min on ice and then centrifuged at 12,000 rpm for 15 min in a JA-20 rotor. The pellet was washed in 25 mL of buffer A containing 0.5 M NaCl and resuspended again in 20 mL of buffer A containing 8 M Urea and 5 mM DTT and incubated at room temperature for 30 min. Afterwards, 20 mL of buffer B (50 mM Tris, 100 mM KCl, 5 mM MgCl2 and 5 mM DTT) was added slowly to the solution and centrifuged at 12,000 rpm for 5 min. The supernatant containing cyclin B Δ90 was dialyzed buffer exchanged into 1X CSF-XB buffer overnight at 4°C using Spectra/Por 1 dialysis tubing with 6–8 kDa MWCO (Spectra/Por®) and concentrated to 2.12 mg/mL using Amicon Ultra - 15 centrifugal filter devices with 50,000 NMWL (Millipore).
A pGEX-4T-1 expression vector for GST-GFP-NLS (nuclear localization sequence derived from SV40) was used to express and purify GST-GFP-NLS as described previously 76 with the following modifications. The expression vector was transformed into Rosetta™ 2(DE3)pLysS competent cells (# 71401, Novagen) and was grown at 20 °C to O.D600 0.7. The GST-GFP-NLS expression was induced for 15 hours by adding IPTG (1 mM) and purified on glutathione-agarose resin (#G4510, Sigma). Fractions were collected, and dialyzed buffer exchanged into 1X CSF-XB buffer overnight at 4°C using Spectra/Por 1 dialysis tubing with 6–8 kDa MWCO (Spectra/Por®) and concentrated to 7.9 mg/mL using Amicon Ultra - 15 centrifugal filter devices with 100,000 NMWL (Millipore).
Characterization of nuclear import dynamics and nuclear envelope breakdown
Interphase extract with assembled interphase nuclei was prepared as described above and then pumped into the microfluidics devices with post arrays containing either cyclin B Δ90, CSF-XB buffer, or GST-GFP-NLS. Where indicated, posts were degraded either by exposure to ultraviolet light (λ~365 nm) at an intensity of 15,000 µW/cm2 at a working distance of 15 cm) for three 1 min pulses separated by a 30s pause using a Black-Ray UV Lamp (UVP Blak-Ray™) or by exposing through a DAPI filter on a confocal or widefield microscope with two 30 sec exposures separated by a 30s pause. For the latter method, the size of the exposed region was controlled using the field aperture. Nuclei were visualized and imaged using an Olympus PlanN 2x (0.06 Numerical Aperture), UPlanFLN 4x (0.13 Numerical Aperture), and UPlanSApo 20x (0.75 Numerical Aperture) objectives mounted on an Olympus IX81 microscope equipped with a spinning-disc confocal head (CSU-X1; Yokogawa) and ILE4 laser launch (Spectral Applied Research) or an Olympus IX71 epi-fluorescence microscope equipped with a Lumen 200 fluorescence illumination system (Prior Scientific). Both imaging systems were fully automated to facilitate multi-mode time-lapse imaging and were equipped with automated shutters and stages (Ludl Electronic Products) and sCMOS digital cameras (Orca Flash 2.8 and 4.0 respectively; Hamamatsu).
To monitor the extent of NEBD the dynamics of nuclear import, images of nuclei were acquired at indicated time intervals using Metamorph 7.7 software (Molecular Devices). Post-acquisition image analysis was perfor med using ImageJ (National Institutes of Health; http://rsb.info.nih.gov/ij/). Import dynamics of GST-GFP-NLS were measured as the background subtracted mean fluorescence intensity of green fluorescence signal within the nucleoplasm, whereas the extent of NEBD was determined by measuring the mean fluorescence intensities of FITC-labeled dextran (150 kDa) inside the nuclei (nucleoplasm) and outside the nuclei (cytoplasm). The ratio of these measurements was used to determine the relative amount of nuclear influx of FITC-labeled dextran and, by proxy, the extent of NEBD.
Biochemical characterization of the interphase to mitosis transition
Egg extracts were collected by aspiration from microfluidics devices following the indicated experimental treatments. For each condition, 0.5 µl of extract was diluted in 10 µl of 3X Laemmli sample buffer (Bio-Rad) 77 and boiled at 95°C for 5 min. Equal volumes of samples were loaded into wells of a 4–15% Gradient SDS-PAGE gel (Bio-Rad) along with a protein standards (Bio-Rad) and separated by protein gel electrophoresis apparatus (BioRad). The proteins were then transferred from the gel to nitrocellulose membrane (Bio-Rad) by wet electroblotting apparatus (BioRad). The nitrocellulose membranes were then blocked in PBS containing 5% w/v nonfat dry milk and further incubated with the indicated primary antibodies and secondary antibodies for western blot analysis. Primary antibodies used included anti-GST (#2622; Cell Signaling Technology), anti-phospho-H3 (Ser10) (#06–570; Millipore), anti-Histone H3 (#ab1791; Abcam), anti-phospho-MAPK (#9106; Cell Signaling Technology), anti-β-Tubulin (sc-58884; Santa Cruz), and anti-Cyclin B1 (#AP11096c, Abgent). Secondary antibodies used were IRDye-680RD conjugated anti-mouse-IgG (#925–68070; Li-Cor) and IRDye-800CW-conjugated anti-rabbit-IgG (#925–32211; Li-Cor). Membranes were scanned using a Li-Cor Odyssey CLx Imager. Band intensities were normalized to loading controls (total H3 or β-Tubulin levels) and quantified in ImageJ.
Results and Discussion
Protein retention and release from hydrogels
To characterize the retention and release of proteins from photodegradable hydrogels, fluorescent protein (GST-GFP-NLS ~ 55 kDa) was encapsulated into the network as a model protein. The hydrogel forming monomer solution was mixed to have 8.2 wt% PEGdiPDA, 0.8 wt% LAP, and 6.18 µM of GST-GFP-NLS. The hydrogel-forming solution was flowed into the microfluidic channel and polymerized into a series of posts by exposing an octagonal area generated by the small opening of the fully restricted microscope field aperture to UV light (λ > 405 nm) and then repeating the same exposure at different stage positions. In order to minimize the channel surface area required to encapsulate the target amount of protein, the volume of each post was maximized by polymerizing through the full depth of the channel. To achieve this, channels were purged with nitrogen to eliminate oxygen from the PDMS. Since oxygen inhibits the free radical-initiated photopolymerization of PEGDA and PDMS provides a continuous flux of oxygen under ambient conditions 78, purging was required to achieve polymerization at the PDMS interface. Devices were then flushed to remove excess hydrogel forming solution and soaked in CSF-XB buffer until use. A combination of 20x air objective and aperture were used to fabricate a total of 10 posts with a diameter of 150 µm, spaced 500 µm apart, so as to not interact with each other, in two separate devices.
To assess the ability of the hydrogel posts to retain protein in the absence of photodegradation, a device containing a set of 5 GST-GFP-NLS containing posts was filled with cell-free Xenopus egg extract and imaged every 15 mins for 2.5 hours (Fig. 2a and 2b). No appreciable decrease in the fluorescence intensity of the posts was observed during the first 30 min, however, at longer time points there was a significant but small reduction in fluorescent intensity, likely attributable to photobleaching of the GST-GFP-NLS signal. The relative contributions of protein loss from the posts and photobleaching to the observed reduction in the fluorescence signal over time were determined in a series of control experiments (Fig. S1 and S2), which validate our assertion that signal loss is indeed attributable to photobleaching and not from protein prematurely leaching from the posts. Overall, these data demonstrate that the approach allows for either the quantitative global or local manipulation of protein concentrations within extract-filled microfluidic channels.
Figure 2.
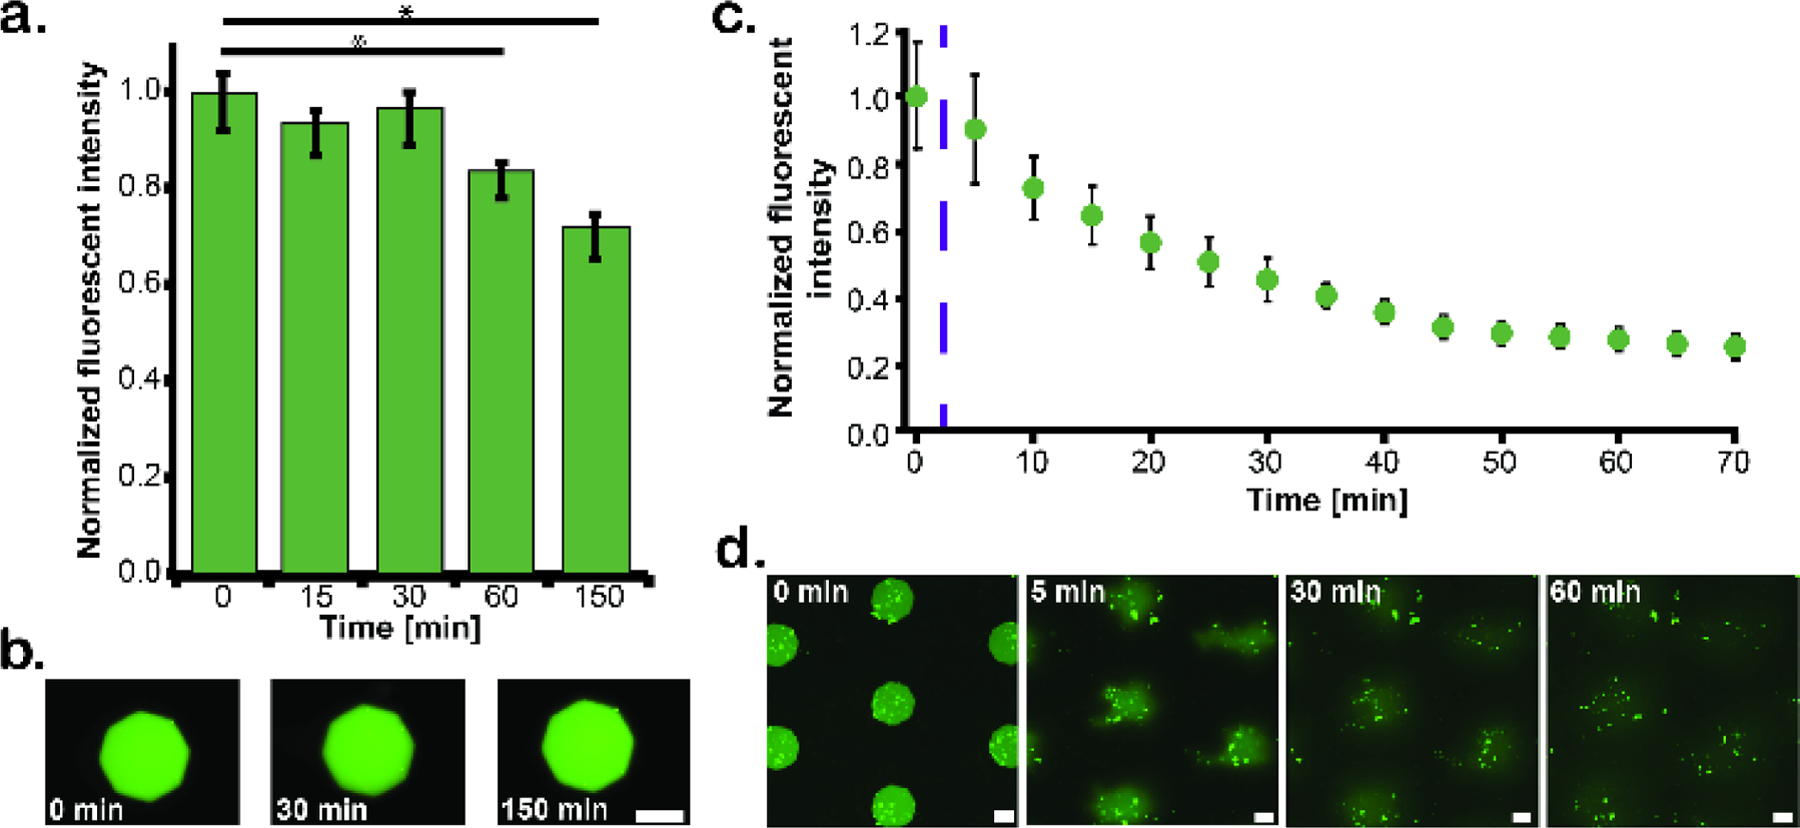
Retention and light-induced release of a model fluorescent protein (GST-GFP-NLS). a) Plot showing the mean fluorescent signal of GST-GFP-NLS encapsulated in five octagonal hydrogel posts as a function of time. b) Representative images of fluorescent protein retention in hydrogel posts at 0 min (left), 30 min (middle), and 150 min (right). c) Graph of the fluorescent signal from GST-GFP-NLS posts both before and after irradiation with UV light (365 nm; three 1 min pulses separated by 30s intervals using a Black-Ray UV Lamp). The purple dashed line indicates the start of UV exposure. After approximately 50 min, the normalized fluorescent intensity levels off, suggesting diffusion into the surrounding extract has slowed due to homogenizing spatial concentrations. d) An array of GST-GFP-NLS hydrogel posts immediately before exposure to UV light (0 min) and then 5 min, 30 min, and 60 min thereafter. Statistics done using a student T-test with alpha equal to 0.05, * represents p < alpha. Scale bar = 75 µm.
A second set of five posts was used to quantify protein release profiles from the hydrogel posts upon degradation 43. Posts were degraded by irradiation with UV (λ~365 nm at an intensity of 15,000 µW/cm2 at a working distance of 15 cm) light source for 3 min. The posts were imaged immediately before degradation, immediately after degradation, and every 5 mins for one hour thereafter (Fig. 2c). Following UV-exposure, we observed a monotonic decrease in the fluorescent intensity maintained in the posts, corresponding to release of GST-GFP-NLS into the surrounding extract. By the end of the time course, most of the protein had left the original areas occupied by posts areas and had instead diffused into the surrounding extract (Fig. 2d).
To confirm the maintenance of biological activity and to assess the kinetics of proteins once released from posts, we took advantage of inherent cellular mechanisms used to concentrate specific proteins containing a nuclear localization signal (NLS) in the nucleus 79. Accordingly, we used a fluorescent protein conjugate containing the glutathione-S-transferase affinity tag along with green fluorescent protein and a nuclear localization signal (GST-GFP-NLS), which has been shown to be efficiently imported and localized to nuclei in interphase extract 76. When we mixed GST-GFP-NLS with interphase extracts containing assembled nuclei that were pre-labelled with a red version of a GST-GFP-NLS (i.e. GST-mCherry-NLS), and then injected this mixture into a microfluidic device, we found that nuclei immediately began to import the green protein as they expanded over time (Fig. 3a, top panel). Similarly, when interphase extract containing pre-labelled red nuclei was injected into devices containing arrays of GST-GFP-NLS containing posts and the protein was released via whole-device UV-exposure, the red nuclei began to import the released GST-GFP-NLS (Fig. 3b, middle panel) albeit with slightly slower kinetics (compare the relevant time courses in Fig. 3b). In contrast but as expected, under the same experimental conditions but in the absence of UV exposure, the nuclear signal of GST-GFP-NLS increased only slightly over time, suggesting that most of the protein remained sequestered in the intact posts of the array (Fig. 3a, lower panel and 3b). The approximately 20% reduction in the amount of GST-GFP-NLS found in nuclei at the 60 min time point after release from posts, as compared to import kinetics observed following direct mixing of the protein, likely stems from the additional time required for hydrogel photodegradation and protein release and diffusion to the distal nuclei.
Figure 3.
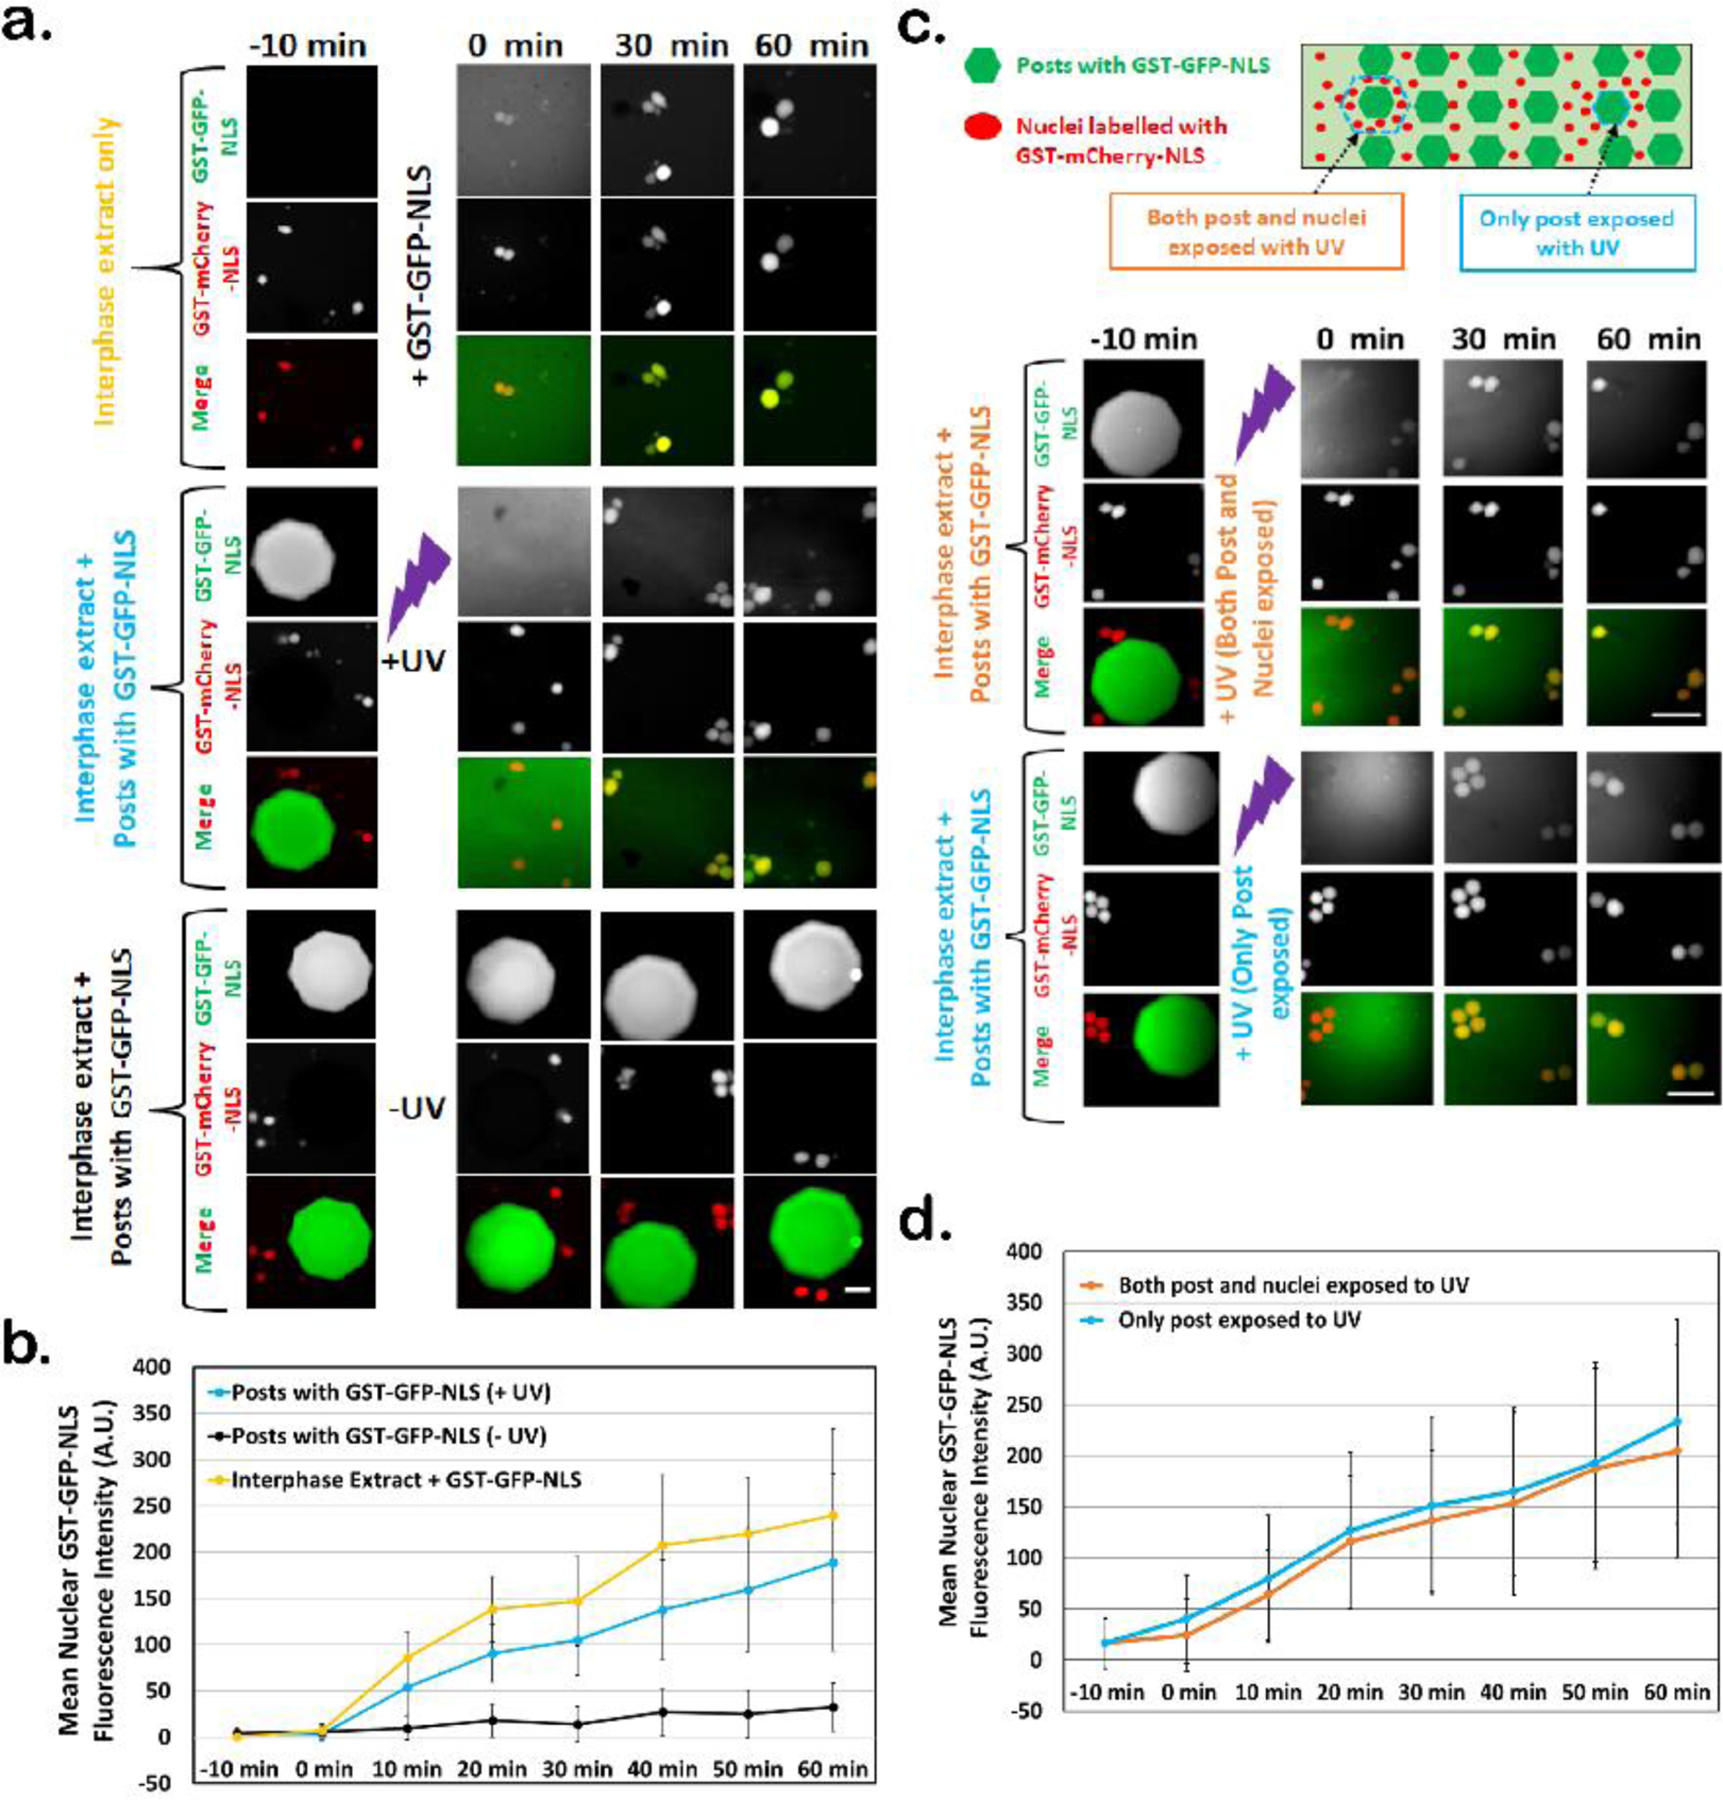
Nuclei are able to take up GST-GFP-NLS following its UV-induced release from hydrogel posts. a) Images of nuclei assembled in egg extracts containing GST-mCherry-NLS (red) and treated as indicated. For the “interphase extract only” condition, extract was simply mixed with GST-GFP-NLS in a test tube at t = −10 min and then injected into an empty device. For the remaining two conditions, extracts were introduced into devices containing arrays of GST-GFP-NLS posts and either exposed to UV to degrade the posts and release GST-GFP-NLS (+UV) or not exposed to UV to test for protein retention (−UV). Scale bar = 50 µm. b) Quantification of nuclear import kinetics of GST-GFP-NLS. Mean nuclear GST-GFP-NLS fluorescence intensity (background subtracted) was measured over time for the three different conditions described in (a). Error bars represent standard deviation and data are shown from three independent experiment where n = number of nuclei (25 < n < 40). c) Upper panel shows a schematic of the experiment to determine if UV exposure negatively effects nuclear import kinetics of GST-GFP-NLS (not drawn to scale). Extracts prepared as described in (a) were injected into devices containing GST-GFP-NLS post arrays. Single posts were degraded by UV exposure using an aperture opening large enough to expose the post and proximal nuclei (upper image set) or with an aperture just large enough to expose only the post (lower image set). Scale bar = 100 µm. d) Import of GST-GFP-NLS was quantified as in panel (b) and plotted as a function of time. Error bars represent standard deviation. Data are shown from three independent experiments where n = number of nuclei (9 < n < 21).
To determine if the UV exposure required for post degradation adversely affected nuclear import of exposed nuclei, we made GST-GFP-NLS posts in microfluidic devices as described previously and then selectively exposed single GST-GFP-NLS posts and surrounding nuclei (Fig. 3c, schematic and upper image set). We compared the import kinetics of these nuclei to nuclei that were not exposed to UV directly but located near a UV-degraded post (Fig. 3c, schematic and lower image set). Over the span of 60 min, the nuclear import kinetics of GST-GFP-NLS were statistically similar under both conditions (Fig. 3d), suggesting the total UV exposure required for post degradation does not affect nuclear import kinetics of GST-GFP-NLS. Moreover, these studies underscore the spatial control of protein release afforded by this system.
To further characterize retention and release of GST-GFP-NLS from hydrogel posts, we measured the amount of GST-GFP-NLS in extracts exposed to intact GST-GFP-NLS post arrays (i.e. no UV exposure) and in extracts following UV-induced post degradation and protein release using western blot analysis (Fig. S3a). We observed that ~94% of the GST-GFP-NLS remained sequestered in the intact hydrogel posts following a 90 min incubation (Fig. S3b and S3c), suggesting that some small amount of protein is probably diffusing out from the posts in the absence of UV exposure. However, following UV exposure and a 15min lag, we retrieved ~60% of the total amount of GST-GFP-NLS protein estimated to be initially sequestered in the posts (Fig. S3b and S3c), suggesting that the t1/2 of protein release from GST-GFP-NLS posts is ~ 15–20 mins.
To further demonstrate spatial control over protein release using this system, an array of posts containing GST-GFP-NLS was fabricated as described previously, except the hydrogel forming monomer solution contained 113 µM of GST-GFP-NLS (Fig. S4a). The array-containing microfluidic device was then flushed with buffer and subsequently filled with interphase extract containing assembled nuclei pre-labeled with GST-mCherry-NLS and Hoechst (Fig. S4a). Following degradation of posts within a localized region, nuclear import of GST-GFP-NLS was monitored in nuclei at different distances from the degradation region (Fig. S4b) and plotted as a function of time (Fig. S4c). Nuclei proximal to the degraded posts began importing the released GST-GFP-NLS almost immediately and did so with significantly faster dynamics than nuclei positioned some distance away from the degraded posts in the region not exposed to UV (Fig. S4c). As configured, the system could be used to selectively degrade single posts within the array (Fig. S4d).
Design and implementation of microfluidic experimental platform
The microfluidic platform described here was designed to allow the facile delivery of a precise amount of protein to a given volume of confined extract. To facilitate zero dead volume filling of the device with extract, posts were staggered along the length of the channel to ensure fluid flow and uniform spacing. The amount of protein encapsulated in each post was calculated from the final desired cyclin B ∆90 concentration of 0.63 µM. To achieve this final concentration, cyclin B ∆90 was encapsulated in PEGdiPDA at a concentration of 26.6 µM. This concentration also relies upon knowledge of the threshold hydrogel network mesh size that would retain the protein. Cyclin B ∆90, a 37 kDa protein possesses a theoretical volume of 44.6 nm3, corresponding to a Stokes’ radius of 2.2nm 80. Equations developed by Flory and Rehner 81 to describe the mesh size distribution, and therefore the diffusivity of solutes within swollen crosslinked polymeric networks 82 were used to calculate the minimum macromer concentration required to retain a protein of this hydrodynamic radius. Utilizing this macromer concentration as a baseline, the hydrogel forming solution composition was modified to empirically identify conditions that allowed facile photopolymerization and degradation, as well as protein retention in a soluble state. The maximum protein solubility at which no precipitation was empirically observed, was 26.6 µM. Finally, this protein concentration was used to calculate the required distribution of extract volume to hydrogel volume. The required volume of hydrogel was distributed evenly across a uniformly spaced array of posts. Overall, a total of 492 posts with a total volume of 0.284 µl were required to achieve a final cyclin B ∆90 concentration of 0.63 µM in the 12 µl of extract contained within the device.
To accomplish the staggered photopolymerization of 492 posts within the channel a custom journal was created in MetaMorph® software. The journal created 12 posts along the width of the channel, moved 720 µm down the length of the channel, created another 12 posts along the width of the channel, and repeated this process a total of 41 times. All posts were spaced 120 µm apart. After the creation of 36 posts the iris was refocused to ensure all posts were created within the channel and had good structural integrity. The polymerization was controlled throughout this process by an automated shutter that was managed within the custom journal.
The ability to form and degrade multiple posts in a staggered array was demonstrated by encapsulating a fluorescent protein within the PEGdiPDA hydrogels (Fig. 2c and 3a). After polymerization, the hydrogels were irradiated with UV light and the release of the fluorescent protein monitored. The staggered post array that was utilized in all future experiments was shown to efficiently release protein that could diffuse into the entire surrounding area, as shown in Fig. 2d and 3a, thus illustrating the ability to deliver protein uniformly to the extract volume throughout the device.
Induction of mitosis
As described in material and methods, CSF-arrested (or mitotic) extracts can be induced to proceed to interphase by adding Ca2+ to mimic fertilization 9. When added to these interphase extracts, demembranated Xenopus sperm nuclei envelop themselves in a nuclear membrane forming intact, import/export competent nuclear envelopes 11, 83, 84. Reversion of interphase extract back into mitosis is typically achieved by adding an equal volume of CSF-arrested extract 5, 11, 83. However, the transition can also be induced by simply adding exogenous recombinant cyclin B ∆90, a nondegradable form of the cell-cycle regulator cyclin B 75, 85.
The interphase to mitosis transition is accompanied by characteristic cell-cycle hallmarks including NEBD and ultimately mitotic spindle assembly. To determine whether our hydrogel delivery strategy could be used to sequester and then release functional proteins in an applied context, we mixed our monomeric hydrogel forming solution with purified recombinant cyclin B ∆90 and generated arrays of cyclin B ∆90 hydrogel posts within microfluidic channels. Posts containing only buffer were used as a negative control. After rinsing out the unpolymerized monomeric solution, interphase extract containing fully assembled nuclei was immediately pumped into microfluidic channels with arrays of buffer-containing posts. The extract was spiked with FITC-conjugated dextran (150 kDa), too large to be imported into intact nuclei, as a way to assess nuclear envelope integrity. To complement this assessment, nuclear envelopes were visualized using antibodies against nuclear pore complex proteins bound to cognate fluorophore-conjugated secondary antibodies (see Materials and Methods). In the absence of UV light exposure, posts containing cyclin B ∆90 excluded FITC-conjugated dextran for the entire period of observation (up to 105 min) in the devices (Fig. 4a). Nuclei also excluded the dextran conjugate over the same time span, suggesting that they too remained intact in the absence of post degradation (Fig. 4a and Fig. S5a). These results indicate that the cyclin B ∆90 remains stably sequestered in hydrogel posts in the absence of exposure to UV light for at least 105 min. In contrast, when the posts were exposed to UV light (exposure time: 3 × 1 min pulses separated by a 30s pause using a Black- Ray UV Lamp), they degraded, resulting in diffusion of FITC-dextran into the space previously occupied by posts (Fig. 4b). Nuclei in the surrounding extract showed signs of fluorescent dextran influx as early as 30–40 mins following UV exposure and complete NEBD by 105 min (Fig. 4d, and Fig. S5b). Nuclei remained intact following degradation of CSF-XB containing posts, confirming that cyclin B ∆90 and not a byproduct of the hydrogel degradation or UV exposure was responsible for the observed induction of NEBD (Fig. 4c and Fig. S5c). Egg extracts were supplemented with Hoechst 33342 to visualize chromatin to confirm the absence of intact nuclear envelopes (Fig. S6) following NEBD (at the 105 min time point). To quantify the extent of NEBD, we measured the ratio of nuclear to cytoplasmic fluorescence of FITC-dextran as a function of time. As shown in Fig. 4d, the quantitative analyses from these experiments, performed in triplicate, showed a statistically significant increase in FITC-dextran invasion into nuclei over the 105 min observation window, indicating that UV-induced release of cyclin B ∆90 results in NEBD, albeit with slower kinetics as compared to studies in which cyclin B ∆90 was added directly to the extract86. This difference between bulk and microfluidic protein introduction is attributable to the time required for hydrogel photodegradation as well as the diffusive mixing that follows (Fig. 2c and 2d). While bulk mixing rapidly homogenizes protein concentration, diffusive mixing slowly establishes concentration gradients extending outward from the sources. When coupled with the t1/2 of protein release, the system requires much longer times to reach an equilibrium concentration. During this process, dynamic two-dimensional concentration gradients exist throughout the extract. Because NEBD occurs at a threshold cyclin concentration, the transient elevation of protein is not recorded in nuclei behavior. As Figure 2 shows, the diffusive transport of large proteins in crowded extracts is a slow phenomenon. While these transient states create a lag relative to observed NEBD times in bulk extracts, our results show that the biological response is conserved and not altered by the photoactuation of protein release. Furthermore, relying upon diffusive mixing is more representative of the cyclical time scales and dynamics of many intracellular processes.
Figure 4.
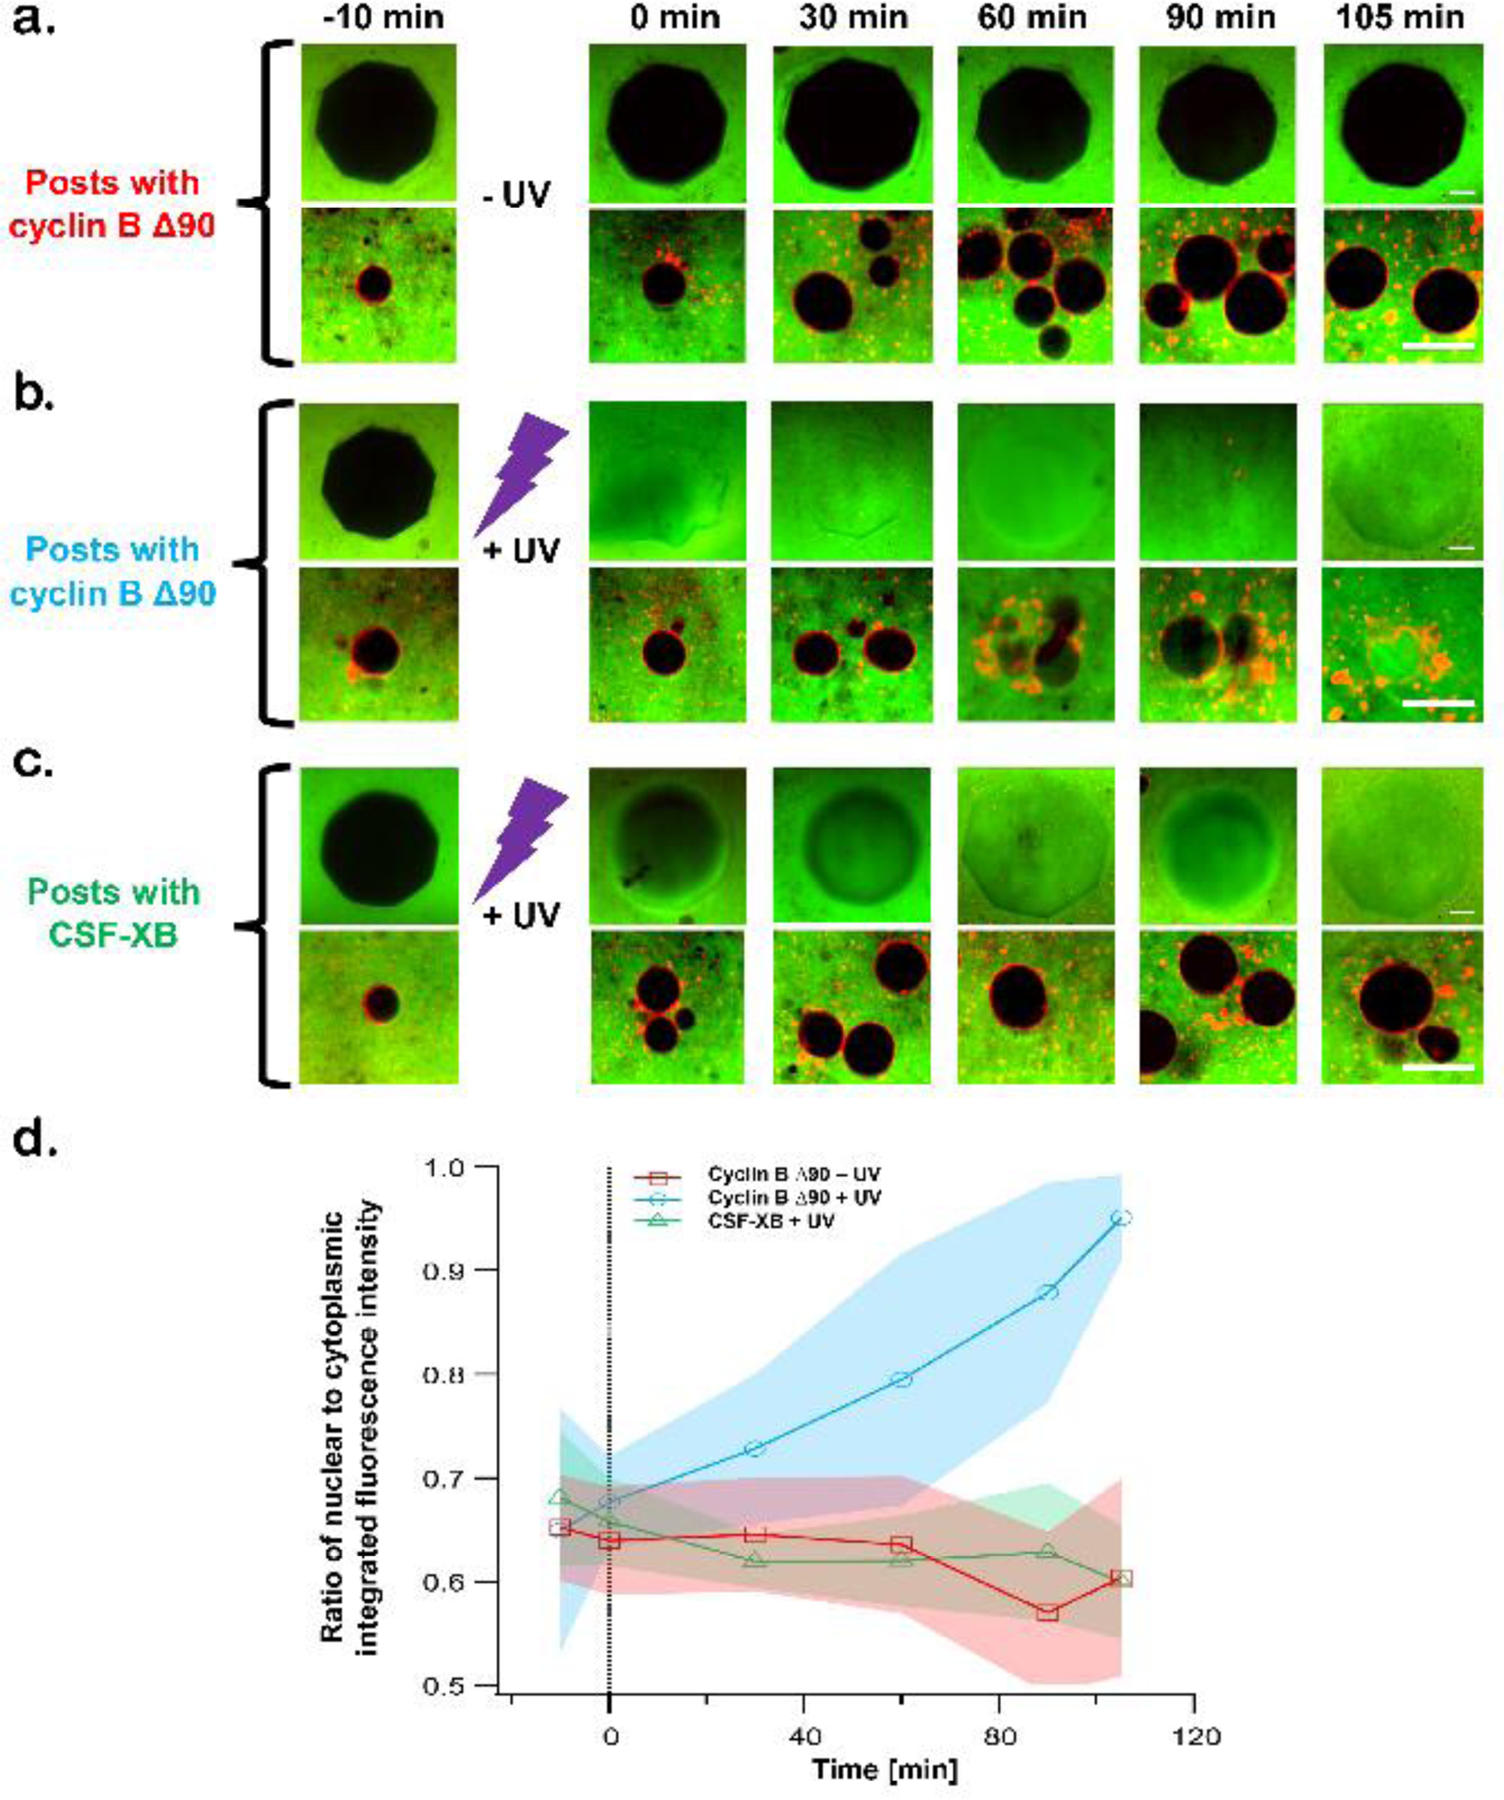
Optically regulated release of cyclin B Δ90 into cell free egg extracts induces nuclear envelope breakdown (NEBD). a–c) Nuclei are assembled in egg extract containing FITC-labelled 150-kD dextran (green) and mAb414 (an antibody against nuclear pore complex) conjugated with Alexa 568 secondary antibody (red). Extracts with assembled nuclei were injected into microfluidic devices containing either cyclin B Δ90 containing hydrogel posts or blank hydrogel posts swelled in CSF-XB Buffer. a) and b) Cyclin B Δ90 encapsulating hydrogel posts were either left intact (−UV) or degraded (+UV) respectively. c) The blank hydrogel posts swelled in CSF-XB buffer were degraded (+UV). d) Nuclei were monitored with confocal microscopy and the extent of NEBD was quantified as the ratio of nuclear to cytoplasmic integrated fluorescence intensity over the span of 120 min. Data are shown from three independent experiments; shaded error bands represent standard deviation (SD). n = number of nuclei; n minimum = 15, n maximum = 26. Scale bar = 25 µm.
To validate that the cyclin B ∆90 remains sequestered in the hydrogel posts, we probed for cyclin B ∆90 using western blot analysis (Fig. S7). Altogether, these data demonstrate that UV-induced degradation of photodegradable hydrogel posts can provide temporal control over the release of cyclin B ∆90 into the surrounding interphase extract, resulting in mitotic induction and NEBD.
Biochemical characterization of light regulated induction of mitosis
Mitotic entry in early embryonic cell divisions is regulated predominantly by the activation of cdc2 (homolog of human Cdk1 or Cyclin-dependent kinase 1). This requires binding of cyclin B to form a cdc2-cyclin B complex, which is also known as MPF (M-phase promoting factor) 87. One of the hallmark features of mitotic induction is the phosphorylation of various mitotic substrates. Previous studies in Xenopus egg extract have shown that addition of cyclin B ∆90 induces the phosphorylation and activation of MEK1 (mitogen-activated or extracellular signal-regulated protein kinase 1) 88. Activated MEK1 in turn phosphorylates and activates p42 MAPK, which is essential for normal mitotic progression 88, 89. Additionally, during mitosis cdc2 kinase activity is required for the activation of Aurora A and Aurora B kinases 90, 91. Activated forms of Aurora A and Aurora B kinases are then responsible for the phosphorylation of H3 Ser-10 phosphorylation 92, which is required for the chromosome condensation during mitosis 93. In order to verify that the NEBD observed after UV-induced release of cyclin B ∆90 from hydrogel posts was indeed the result of an induced mitotic transition, western blot analysis was used to confirm the presence of mitosis-specific phosphorylation of H3 Ser-10 (an Aurora A and Aurora B substrate) and p42 MAPK (a MEK1 substrate). Western blot confirmed that H3 Ser-10 and p42 MAPK were phosphorylated when cyclin B ∆90 was released from hydrogel posts similar to the positive control in which recombinant cyclin B Δ90 was added directly to interphase extract at a final concentration of 0.63 µM (Fig. 5a). Negative controls behaved as expected, as phosphorylated levels of H3 Ser-10 and p42 MAPK remained low when cyclin B ∆90 remained sequestered in intact posts and after posts containing CSF-XB buffer were degraded. Levels of mitotic phosphorylation also remained low in extracts surrounding intact posts containing CSF-XB buffer and in interphase extracts without posts after exposure to UV light (Fig. 5b). Altogether, these results suggest that cyclin B ∆90 released from hydrogel posts was sufficient to induce mitosis, as demonstrated by nuclear envelope breakdown and the accumulation of mitosis specific phosphorylations of specific substrates.
Figure 5.
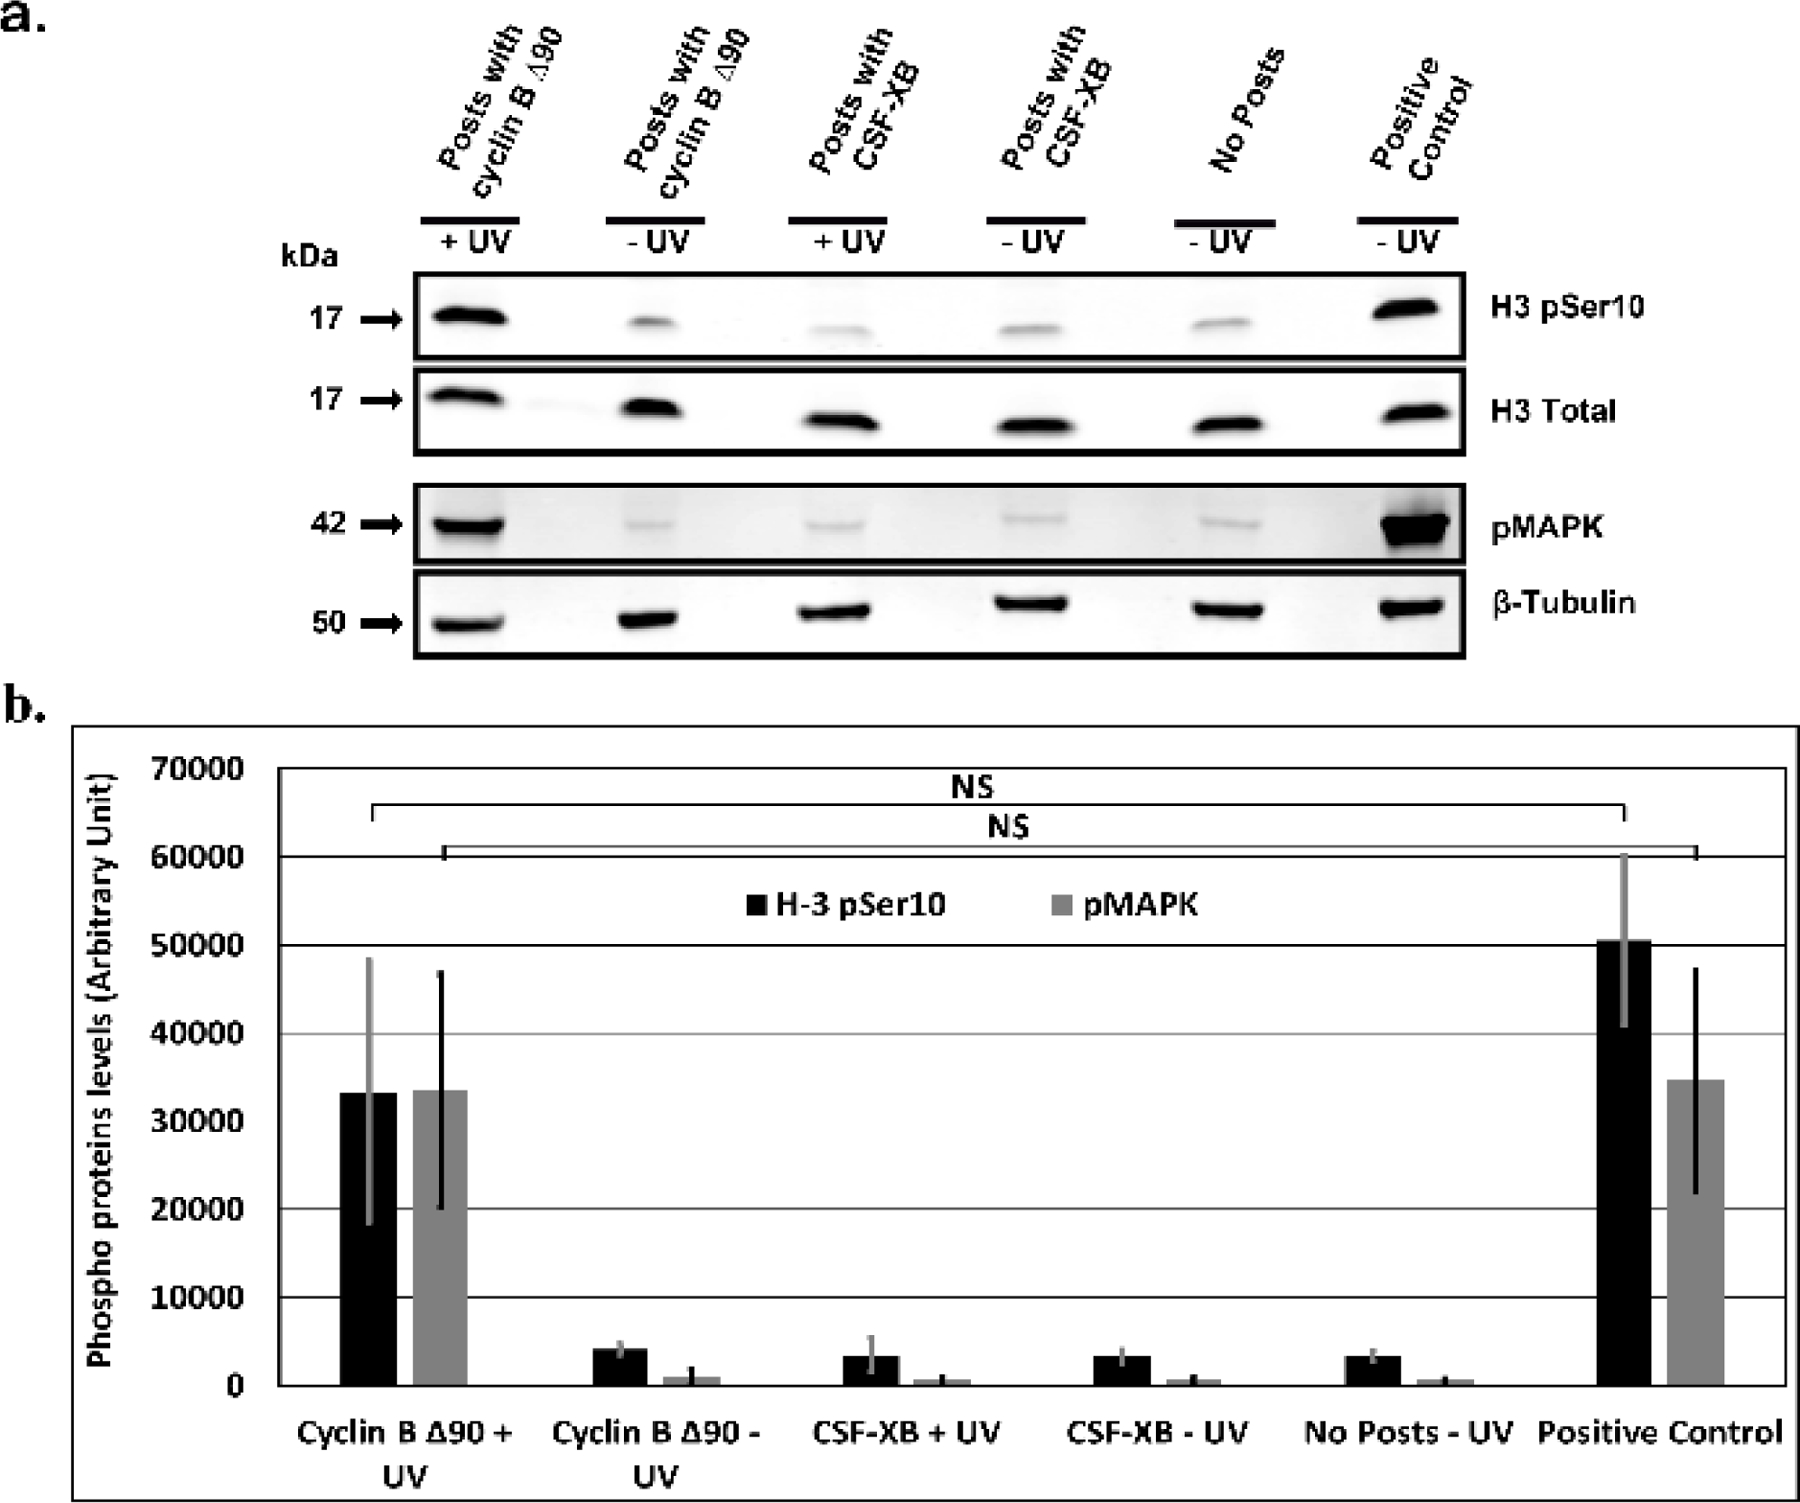
Light regulated release of cyclin B Δ90 into interphase extract induces mitosis as characterized by western blots. a) Mitotic induction as detected by phosphorylation of H3 Ser-10 and MAPK, where posts with cyclin B Δ90 are exposed to UV light. b) Bar graph showing the quantification of levels of phosphorylated H3 Ser-10 and MAPK protein normalized to total H3 and β-Tubulin controls, respectively, for six conditions: degraded posts containing cyclin B Δ90 (+UV), non-degraded posts containing cyclin B Δ90 (−UV), and degraded posts containing only CSF-XB buffer (+UV), non-degraded posts containing CSF-XB buffer (−UV), interphase extract alone (no posts, no UV), and positive control (cyclin B Δ90 added to interphase extract). Data are shown from three independent experiments with error bars representing standard deviation (S.D). Statistics done using student T-test, NS (non-significant) represents p > 0.05.
Conclusions
A biomaterials-integrated microfluidics device has been developed for the dynamic control over the cell cycle within confined cell-free Xenopus egg extracts. The device consists of a microfluidic channel containing photopatterned, photodegradable hydrogel structures that contain and retain functional proteins. Here, we encapsulated either GST-GFP-NLS, a protein cargo imported by nuclei, or cyclin B ∆90, responsible for driving the cell cycle into mitosis. The photo-activated degradation and release of GST-GFP-NLS initiated nuclear import of GST-GFP-NLS into surrounding nuclei, demonstrating the biological passivity of the process as well as control over temporal and spatial solute profiles. The release of cyclin B ∆90 initiated NEBD and the induction of biochemical mitosis, illustrating the ability to predictively cycle extracts in a dynamic and quantitative fashion. This platform extends the ability of microfluidic devices to provide new experimental capabilities to the study of cell free extracts and enables spatially and temporally controlled delivery of a host of soluble factors to confined model cytoplasms.
Supplementary Material
Acknowledgements
This work was funded by the NSF Faculty CAREER Program (BBBE 1254608; J.O.), NIH grants R15GM101636 (J.O. and J.G.), R01GM113028, RO1GM101636 and R01GM113028 (Dr Dan Levy, J.O. and J.G.), the Laura and Arthur Colwin Endowed Summer Research Fellowship Fund (J.O. and J.G.) and the Nikon Fellowship (J.G.) from the Marine Biological Laboratory in Woods Hole, MA. We would also like to acknowledge the Delaware COBRE programs in Drug Discovery and in Advanced Biomaterials funded by Institutional Development Awards from the National Institute of General Medical Sciences at the National Institutes of Health (P20GM104316 and P30GM110758, respectively to A.K.), the Burroughs Wellcome Fund (A.K.), and the University of Delaware Research Foundation (A.K.). The authors thank Dr. Daniel Levy for the gift of sea urchin non-degradable cyclin B (cyclin B Δ90) expression vector, GST-GFP-NLS, and GST-mCherry-NLS proteins and bacterial expression vector for GST-GFP-NLS. Lastly, the authors would like to thank Dr. Miroslav Tomschik for purification of the GST-GFP-NLS protein and Priscilla Phan for making the Xenopus egg extracts.
Footnotes
Electronic Supplementary Information (ESI) available: Seven Supplementary Figures and One Table.
See DOI: 10.1039/c9lc00569b
References
- 1.Murray AW and Kirschner MW, Nature, 1989, 339, 275–280. [DOI] [PubMed] [Google Scholar]
- 2.Murray AW, Methods Cell Biol, 1991, 36, 581–605. [PubMed] [Google Scholar]
- 3.Heald R, Tournebize R, Blank T, Sandaltzopoulos R, Becker P, Hyman A and Karsenti E, Nature, 1996, 382, 420–425. [DOI] [PubMed] [Google Scholar]
- 4.Heald R, Tournebize R, Habermann A, Karsenti E and Hyman A, Journal of Cell Biology, 1997, 138, 615–628. [DOI] [PMC free article] [PubMed] [Google Scholar]
- 5.Desai A, Murray AW, Mitchison T and Walczak CE, in Methods in Cell Biology, Academic Press, 1999, vol. 61, pp. 385–412. [DOI] [PubMed] [Google Scholar]
- 6.Gillespie PJ, Neusiedler J, Creavin K, Chadha GS and Blow JJ, Methods Mol Biol, 2016, 1342, 101–147. [DOI] [PubMed] [Google Scholar]
- 7.Field CM, Pelletier JF and Mitchison TJ, Methods Cell Biol, 2017, 137, 395–435. [DOI] [PMC free article] [PubMed] [Google Scholar]
- 8.Maller JL, J Biol Chem, 2012, 287, 21640–21653. [DOI] [PMC free article] [PubMed] [Google Scholar]
- 9.Lohka MJ and Maller JL, J Cell Biol, 1985, 101, 518–523. [DOI] [PMC free article] [PubMed] [Google Scholar]
- 10.Maresca TJ and Heald R, Methods Mol Biol, 2006, 322, 459–474. [DOI] [PubMed] [Google Scholar]
- 11.Lohka MJ and Masui Y, The Journal of Cell Biology, 1984, 98, 9. [DOI] [PMC free article] [PubMed] [Google Scholar]
- 12.Kobayashi H, Minshull J, Ford C, Golsteyn R, Poon R and Hunt T, The Journal of Cell Biology, 1991, 114, 11. [DOI] [PMC free article] [PubMed] [Google Scholar]
- 13.Gatlin JC, Matov A, Groen AC, Needleman DJ, Maresca TJ, Danuser G, Mitchison TJ and Salmon ED, Curr Biol, 2009, 19, 287–296. [DOI] [PMC free article] [PubMed] [Google Scholar]
- 14.Shimamoto Y, Maeda YT, Ishiwata S, Libchaber AJ and Kapoor TM, Cell, 2011, 145, 1062–1074. [DOI] [PMC free article] [PubMed] [Google Scholar]
- 15.Shimamoto Y and Kapoor TM, Nat Protoc, 2012, 7, 959–969. [DOI] [PMC free article] [PubMed] [Google Scholar]
- 16.Chang JB and Ferrell JE Jr., Nature, 2013, 500, 603–607. [DOI] [PMC free article] [PubMed] [Google Scholar]
- 17.Gelens L, Anderson GA and Ferrell JE Jr., Mol Biol Cell, 2014, 25, 3486–3493. [DOI] [PMC free article] [PubMed] [Google Scholar]
- 18.Hara Y and Merten CA, Dev Cell, 2015, 33, 562–575. [DOI] [PubMed] [Google Scholar]
- 19.Dinarina A, Pugieux C, Corral MM, Loose M, Spatz J, Karsenti E and Nedelec F, Cell, 2009, 138, 502–513. [DOI] [PubMed] [Google Scholar]
- 20.Jimenez AM, Roche M, Pinot M, Panizza P, Courbin L and Gueroui Z, Lab Chip, 2011, 11, 429–434. [DOI] [PubMed] [Google Scholar]
- 21.Hazel J, Krutkramelis K, Mooney P, Tomschik M, Gerow K, Oakey J and Gatlin JC, Science, 2013, 342, 853–856. [DOI] [PMC free article] [PubMed] [Google Scholar]
- 22.Good MC, Vahey MD, Skandarajah A, Fletcher DA and Heald R, Science, 2013, 342, 856–860. [DOI] [PMC free article] [PubMed] [Google Scholar]
- 23.Vleugel M, Roth S, Groenendijk CF and Dogterom M, J Vis Exp, 2016, DOI: 10.3791/54278. [DOI] [PMC free article] [PubMed]
- 24.Takayama S, Ostuni E, LeDuc P, Naruse K, Ingber DE and Whitesides GM, Nature, 2001, 411, 1016. [DOI] [PubMed] [Google Scholar]
- 25.Tan JL, Tien J, Pirone DM, Gray DS, Bhadriraju K and Chen CS, Proc Natl Acad Sci U S A, 2003, 100, 1484–1489. [DOI] [PMC free article] [PubMed] [Google Scholar]
- 26.King KR, Wang S, Irimia D, Jayaraman A, Toner M and Yarmush ML, Lab Chip, 2007, 7, 77–85. [DOI] [PMC free article] [PubMed] [Google Scholar]
- 27.Bascom CS Jr., Wu SZ, Nelson K, Oakey J and Bezanilla M, Plant Physiol, 2016, 172, 28–37. [DOI] [PMC free article] [PubMed] [Google Scholar]
- 28.Li Jeon N, Baskaran H, Dertinger SK, Whitesides GM, Van de Water L and Toner M, Nat Biotechnol, 2002, 20, 826–830. [DOI] [PubMed] [Google Scholar]
- 29.Irimia D, Geba DA and Toner M, Anal Chem, 2006, 78, 3472–3477. [DOI] [PMC free article] [PubMed] [Google Scholar]
- 30.Irimia D, Charras G, Agrawal N, Mitchison T and Toner M, Lab Chip, 2007, 7, 1783–1790. [DOI] [PMC free article] [PubMed] [Google Scholar]
- 31.Dertinger SKW, Chiu DT, Jeon NL and Whitesides GM, Anal Chem, 2001, 73, 1240–1246. [Google Scholar]
- 32.Lin F, Saadi W, Rhee SW, Wang SJ, Mittal S and Jeon NL, Lab Chip, 2004, 4, 164–167. [DOI] [PubMed] [Google Scholar]
- 33.Atencia J, Morrow J and Locascio LE, Lab Chip, 2009, 9, 2707–2714. [DOI] [PubMed] [Google Scholar]
- 34.Frevert CW, Boggy G, Keenan TM and Folch A, Lab Chip, 2006, 6, 849–856. [DOI] [PMC free article] [PubMed] [Google Scholar]
- 35.Agrawal N, Toner M and Irimia D, Lab Chip, 2008, 8, 2054–2061. [DOI] [PMC free article] [PubMed] [Google Scholar]
- 36.Chandrasekaran A, Ellett F, Jorgensen J and Irimia D, Microsystems & Nanoengineering, 2017, 3, 16067. [DOI] [PMC free article] [PubMed] [Google Scholar]
- 37.Cooksey GA, Sip CG and Folch A, Lab Chip, 2009, 9, 417–426. [DOI] [PMC free article] [PubMed] [Google Scholar]
- 38.Moore TA and Young EW, Biomicrofluidics, 2016, 10, 044105. [DOI] [PMC free article] [PubMed] [Google Scholar]
- 39.Kim T, Pinelis M and Maharbiz MM, Biomed Microdevices, 2009, 11, 65–73. [DOI] [PubMed] [Google Scholar]
- 40.Dittrich PS and Manz A, Nat Rev Drug Discov, 2006, 5, 210–218. [DOI] [PubMed] [Google Scholar]
- 41.Pihl J, Sinclair J, Sahlin E, Karlsson M, Petterson F, Olofsson J and Orwar O, Anal Chem, 2005, 77, 3897–3903. [DOI] [PubMed] [Google Scholar]
- 42.Nuttelman CR, Mortisen DJ, Henry SM and Anseth KS, J Biomed Mater Res, 2001, 57, 217–223. [DOI] [PubMed] [Google Scholar]
- 43.LeValley PJ, Noren B, Kharkar PM, Kloxin AM, Gatlin JC and Oakey JS, Acs Biomater Sci Eng, 2018, 4, 3078–3087. [DOI] [PMC free article] [PubMed] [Google Scholar]
- 44.LeValley PJ, Tibbitt MW, Noren B, Kharkar PM, Kloxin AM, Anseth KS, Toner M and Oakey JS, Colloids and Surfaces B: Biointerfaces, 2019, 174, 483–492. [DOI] [PMC free article] [PubMed] [Google Scholar]
- 45.Cushing MC and Anseth KS, Science, 2007, 316, 1133–1134. [DOI] [PubMed] [Google Scholar]
- 46.Patterson J and Hubbell JA, Biomaterials, 2010, 31, 7836–7845. [DOI] [PubMed] [Google Scholar]
- 47.West JL and Hubbell JA, Macromolecules, 1999, 32, 241–244. [Google Scholar]
- 48.Yang C, DelRio FW, Ma H, Killaars AR, Basta LP, Kyburz KA and Anseth KS, Proc Natl Acad Sci U S A, 2016, 113, E4439–4445. [DOI] [PMC free article] [PubMed] [Google Scholar]
- 49.Nelson CM, Vanduijn MM, Inman JL, Fletcher DA and Bissell MJ, Science, 2006, 314, 298–300. [DOI] [PMC free article] [PubMed] [Google Scholar]
- 50.Lewis KJ, Tibbitt MW, Zhao Y, Branchfield K, Sun X, Balasubramaniam V and Anseth KS, Biomater Sci, 2015, 3, 821–832. [DOI] [PMC free article] [PubMed] [Google Scholar]
- 51.Benoit DS, Nuttelman CR, Collins SD and Anseth KS, Biomaterials, 2006, 27, 6102–6110. [DOI] [PubMed] [Google Scholar]
- 52.Lu SX and Anseth KS, Macromolecules, 2000, 33, 2509–2515. [Google Scholar]
- 53.West JL and Hubbell JA, React Polym, 1995, 25, 139–147. [Google Scholar]
- 54.Mason MN, Metters AT, Bowman CN and Anseth KS, Macromolecules, 2001, 34, 4630–4635. [Google Scholar]
- 55.Hammer JA and West JL, Bioconjug Chem, 2018, 29, 2140–2149. [DOI] [PubMed] [Google Scholar]
- 56.Dong YQ, Jin GR, Hong Y, Zhu HY, Lu TJ, Xu F, Bai D and Lin M, Acs Appl Mater Inter, 2018, 10, 12374–12389. [DOI] [PubMed] [Google Scholar]
- 57.Zhao D, Tang Q, Zhou Q, Peng K, Yang H and Zhang X, Soft Matter, 2018, 14, 7420–7428. [DOI] [PubMed] [Google Scholar]
- 58.Epps TH, Vi T and Sullivan MO, Polym J, 2018, 50, 711–723. [Google Scholar]
- 59.Tong X, Lee S, Bararpour L and Yang F, Macromol Biosci, 2015, 15, 1679–1686. [DOI] [PMC free article] [PubMed] [Google Scholar]
- 60.Mitchison TJ, Sawin KE, Theriot JA, Gee K and Mallavarapu A, Methods Enzymol, 1998, 291, 63–78. [DOI] [PubMed] [Google Scholar]
- 61.Terray A, Oakey J and Marr DWM, Appl Phys Lett, 2002, 81, 1555–1557. [Google Scholar]
- 62.Yu Q, Bauer JM, Moore JS and Beebe DJ, Appl Phys Lett, 2001, 78, 2589–2591. [Google Scholar]
- 63.Srinivas RL, Johnson SD and Doyle PS, Anal Chem, 2013, 85, 12099–12107. [DOI] [PMC free article] [PubMed] [Google Scholar]
- 64.Fischer P, Tibbitt M, Kloxin A, Anseth K and Oakey J, Biomed Sci Instrum, 2014, 50, 62–67. [PubMed] [Google Scholar]
- 65.Kloxin AM, Kasko AM, Salinas CN and Anseth KS, Science, 2009, 324, 59–63. [DOI] [PMC free article] [PubMed] [Google Scholar]
- 66.Duffy DC, McDonald JC, Schueller OJ and Whitesides GM, Anal Chem, 1998, 70, 4974–4984. [DOI] [PubMed] [Google Scholar]
- 67.Xia YN and Whitesides GM, Annu Rev Mater Sci, 1998, 28, 153–184. [Google Scholar]
- 68.Whitesides GM and Stroock AD, Phys Today, 2001, 54, 42–48. [Google Scholar]
- 69.Duffy DC, Schueller OJA, Brittain ST and Whitesides GM, J Micromech Microeng, 1999, 9, 211–217. [Google Scholar]
- 70.Kharkar PM, Kiick KL and Kloxin AM, Polym Chem-Uk, 2015, 6, 5565–5574. [DOI] [PMC free article] [PubMed] [Google Scholar]
- 71.Fairbanks BD, Schwartz MP, Bowman CN and Anseth KS, Biomaterials, 2009, 30, 6702–6707. [DOI] [PMC free article] [PubMed] [Google Scholar]
- 72.Randall GC and Doyle PS, P Natl Acad Sci USA, 2005, 102, 10813–10818. [DOI] [PMC free article] [PubMed] [Google Scholar]
- 73.Good MC and Heald R, Cold Spring Harb Protoc, 2018, 2018, pdb prot097055. [DOI] [PMC free article] [PubMed] [Google Scholar]
- 74.Hazel JW and Gatlin JC, Cold Spring Harb Protoc, 2018, 2018, pdb prot099044. [DOI] [PubMed] [Google Scholar]
- 75.Glotzer M, Murray AW and Kirschner MW, Nature, 1991, 349, 132–138. [DOI] [PubMed] [Google Scholar]
- 76.Levy DL and Heald R, Cell, 2010, 143, 288–298. [DOI] [PMC free article] [PubMed] [Google Scholar]
- 77.Laemmli UK, Nature, 1970, 227, 680–685. [DOI] [PubMed] [Google Scholar]
- 78.Krutkramelis K, Xia B and Oakey J, Lab on a Chip, 2016, 16, 1457–1465. [DOI] [PMC free article] [PubMed] [Google Scholar]
- 79.Stewart M, Nat Rev Mol Cell Biol, 2007, 8, 195–208. [DOI] [PubMed] [Google Scholar]
- 80.Erickson HP, Biol Proced Online, 2009, 11, 32–51. [DOI] [PMC free article] [PubMed] [Google Scholar]
- 81.Flory PJ and Rehner J, J Chem Phys, 1943, 11, 521–526. [Google Scholar]
- 82.Canal T and Peppas NA, J Biomed Mater Res, 1989, 23, 1183–1193. [DOI] [PubMed] [Google Scholar]
- 83.Lohka MJ, Methods Cell Biol, 1998, 53, 367–395. [DOI] [PubMed] [Google Scholar]
- 84.Lohka MJ and Masui Y, Science, 1983, 220, 719–721. [DOI] [PubMed] [Google Scholar]
- 85.Murray AW, Solomon MJ and Kirschner MW, Nature, 1989, 339, 280–286. [DOI] [PubMed] [Google Scholar]
- 86.Prunuske AJ, Liu J, Elgort S, Joseph J, Dasso M and Ullman KS, Mol Biol Cell, 2006, 17, 760–769. [DOI] [PMC free article] [PubMed] [Google Scholar]
- 87.Nurse P, Nature, 1990, 344, 503–508. [DOI] [PubMed] [Google Scholar]
- 88.Yue J and Ferrell JE Jr., Curr Biol, 2004, 14, 1581–1586. [DOI] [PubMed] [Google Scholar]
- 89.Guadagno TM and Ferrell JE Jr., Science, 1998, 282, 1312–1315. [DOI] [PubMed] [Google Scholar]
- 90.Zachos G, Nat Chem Biol, 2016, 12, 204–205. [DOI] [PubMed] [Google Scholar]
- 91.Van Horn RD, Chu S, Fan L, Yin T, Du J, Beckmann R, Mader M, Zhu G, Toth J, Blanchard K and Ye XS, J Biol Chem, 2010, 285, 21849–21857. [DOI] [PMC free article] [PubMed] [Google Scholar]
- 92.Crosio C, Fimia GM, Loury R, Kimura M, Okano Y, Zhou H, Sen S, Allis CD and Sassone-Corsi P, Mol Cell Biol, 2002, 22, 874–885. [DOI] [PMC free article] [PubMed] [Google Scholar]
- 93.de la Barre AE, Gerson V, Gout S, Creaven M, Allis CD and Dimitrov S, EMBO J, 2000, 19, 379–391. [DOI] [PMC free article] [PubMed] [Google Scholar]
Associated Data
This section collects any data citations, data availability statements, or supplementary materials included in this article.