

Abstract
Multiple myeloma (MM) remains treatable but incurable. Despite a growing armamentarium of effective agents, choice of therapy, especially in relapse, still relies almost exclusively on clinical acumen. We have developed a system, EMMA (Ex vivo Mathematical Myeloma Advisor), consisting of patient-specific mathematical models parameterized by an ex vivo assay that reverse engineers the intensity and heterogeneity of chemosensitivity of primary cells from MM patients, allowing us to predict clinical response to up to 31 drugs within 5 days post-bone marrow biopsy. From a cohort of 52 MM patients, EMMA correctly classified 96% as responders/non-responders and correctly classified 79% according to IMWG stratification of level of response. We also observed a significant correlation between predicted and actual tumor burden measurements (Pearson r=0.5658, P<0.0001). Preliminary estimates indicate that, among the patients enrolled in this study, 60% were treated with at least one ineffective agent from their therapy combination regimen, while 30% would have responded better if treated with another available drug or combination. Two in silico clinical trials with experimental agents ricolinostat and venetoclax, in a cohort of 19 MM patient samples, yielded consistent results with recent phase I/II trials, suggesting that EMMA is a feasible platform for estimating clinical efficacy of drugs and inclusion criteria screening. This unique platform, specifically designed to predict therapeutic response in MM patients within a clinically actionable time frame, has shown high predictive accuracy in patients treated with combinations of different classes of drugs. The accuracy, reproducibility, short turnaround time and high-throughput potential of this platform demonstrates EMMA’s promise as a decision support system for therapeutic management of MM.
Major Findings.
We have developed a novel tool capable of predicting, within 5 days, the clinical response over months of multiple myeloma patients to 31 drugs, using fresh bone marrow aspirates, a digital image analysis algorithm, mathematical models, and pharmacokinetic data.
Quick Guide to Equations and Assumptions:
We have implemented a grey-box parametric model that represents the tumor’s response to drugs as a collective of subpopulations, each with different levels of chemosensitivity. In this model, the likelihood of cell death depends on drug concentration and exposure time. This model is parameterized by an ex vivo chemosensitivity assay, where primary MM cells from fresh bone marrow aspirates are exposed to different concentrations of drug for 96h (Figure 1, Supplemental Figure 1).
Figure 1. A high throughput ex vivo assay for prediction of clinical response in multiple myeloma.
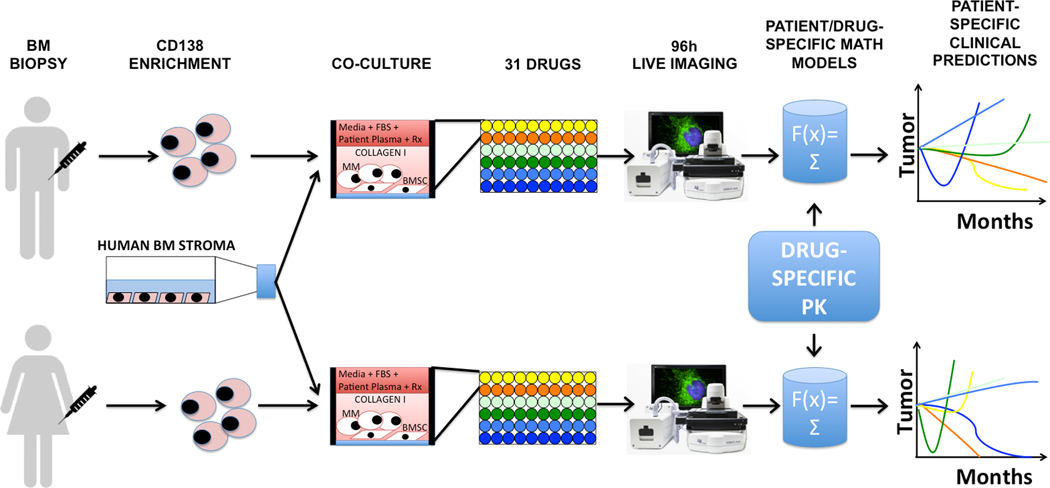
During a standard-of-care bone marrow biopsy, an extra volume of 10mL aspirate is harvested in a heparin-coated tube. MM cells are obtained by selection for CD138 expression, and co-cultured with previously established human bone marrow stroma (bone marrow mesenchymal stem cells, BMSC) and collagen in 384- or 1,536-multi well plates. The culture media in each well is supplemented with the patient’s own plasma, and the plate is incubated overnight for stroma adhesion and equilibrium of soluble factors. The next day, the plate is drugged (up to 31 drugs in a 384- and 127 drugs in a 1,536-well plate) and placed in a microscope for bright-field live imaging for 4 days (one picture every 30 minutes). A digital image analysis algorithm quantifies cell death (Figure 2 and Supplemental Figure 1) and generates ex vivo dose response curves, which in turn are used to parameterize patient/drug-specific mathematical models of chemosensitivity. Each mathematical model is unique for a patient/drug combination. Once we feed the drug-specific pharmacokinetic properties, available from phase I studies, to the patient/drug-specific mathematical models, EMMA creates 3-month predictions of clinical response. By comparing the predicted response of multiple drugs tested, it is possible to choose the best therapy for each patient. In the example above, the first patient would mostly benefit from treatment combining the “yellow” and “orange” drugs, while the best therapy for the second patient would include the “orange” and blue “drugs”. Importantly, these predictions are available 5 days post-biopsy, and thus could be incorporated in the clinical decision-making process.
Suppose the population of MM cells in the patient’s body is represented by p(t). The tumor burden varies with time according to the difference equation:
| (Euqation 1) |
Where G(dt) represents growth due to tumor cell replication and D(t,dt) represents drug-induced cell death between times t and t+dt. In cell culture, doubling time is used as a metric for quantifying cell replication. For mammalian cells, this number is approximately 24 hours. However, the doubling time of MM tumors is much longer due to its characteristically low proliferative index (LI, labeling index). In the mathematical model, the growth factor for the MM population in the absence of therapy is given by Equation 1, where dt is a time interval (in days), and Δt is the time step used in the simulation’s calculation. To determine LI for a given patient, we use the two closest pre-biopsy measures of tumor burden, obtained from monoclonal paraprotein, and Equation 1, with D=1.
To describe the stochastic cell death process, we propose an empirical pharmacodynamics model based on the drug occupancy theory(1):
| (Euqation 2) |
Where drug and receptor molecules form drug-receptor complexes, which in turn cause cellular damage β and, eventually, cell death. The dynamics of this reversible reaction follow the law of mass action(2), where R(t) is the drug concentration at time t, h is an empirical exponent denoting the rate of conversion of drug exposure into cell damage, and κ of cell damage repair.
When the cellular damage is greater than the threshold τ, the probability of cell death increases asymptotically:
| (Euqation 3) |
Where δ is a non-dimensionalizing empirical factor.
Short-term response of MM patients to therapy can be monotonic or present an inflexion point followed by relapse (Figure 2a–c). Thus, tumor chemosensitivity cannot always be accurately described by a single “clonal” population, but requires a more nuanced representation in the general model. We propose two subpopulations, with different degrees of sensitivity to therapy. Each subpopulation can either be modeled as “clonal” or as a distribution, with drug-specific threshold values (τ, Equation 4). These threshold values are obtained from a normally distributed probability density function that specifies the fraction of a subpopulation that initiates cell death beyond a given threshold. Figure 2b shows an example of such a representation of tumor chemosensitivity as a single and as a double distribution. Thus, the total tumor burden of a patient is represented as:
| (Euqation 4) |
Figure 2. Mathematical representation of intra-tumoral heterogeneity of clinical response to a hypothetical treatment.
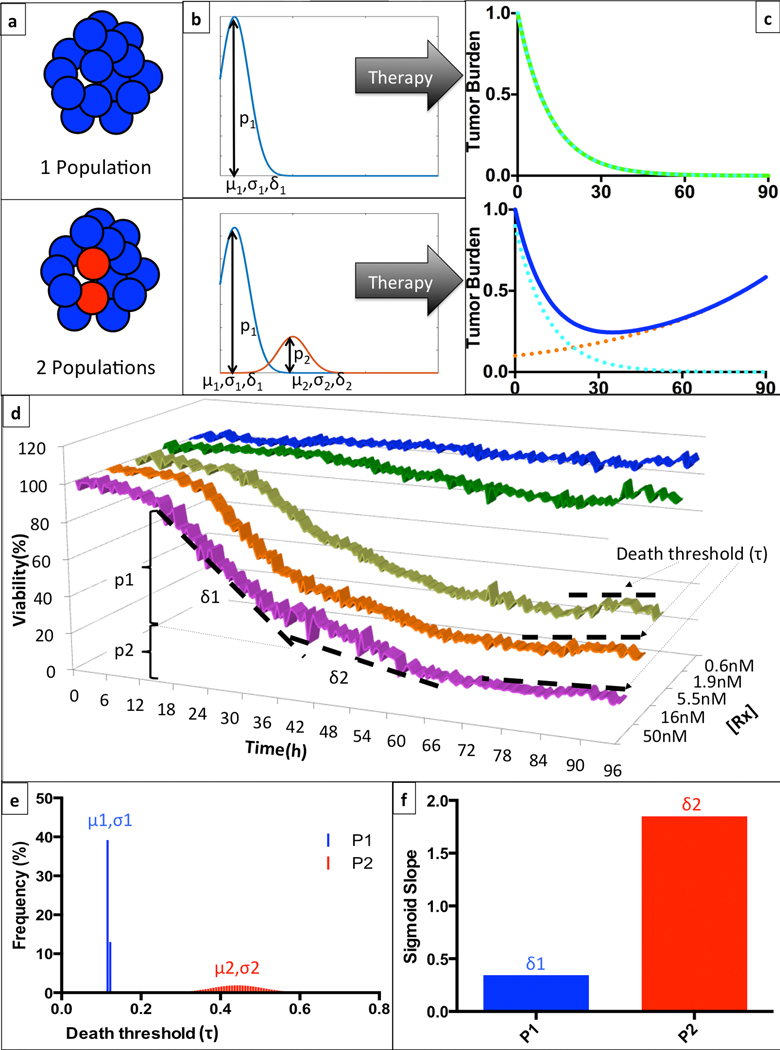
(a) Given any particular drug and a patient’s tumor burden can be entirely sensitive to therapy (top), or contain a subpopulation of resistant cells (bottom). (b) These sub-populations (pi) can be characterized as mono- or bi-modal distributions, with corresponding thresholds for initiation of cell death determined by a mean (μi) and standard deviation (σi), and a rate of drug-induced cell death (δi). (c) The clinical implication of this mathematical representation is that a homogeneous tumor will have a monotonic response to therapy, leading to a complete response, while a heterogeneous tumor will present an inflection point where the sensitive population is eradicated and the resistant cells promote tumor re-growth. (d) In this example, we depict EMMA’s analysis of the ex vivo response of patient Pt104’s MM cells to bortezomib in a 96h-interval. There is a shift in the rate of cell death (from δ1 to δ2), more noticeable in the highest concentration (50nM, magenta) around 36h, indicating the depletion of the more sensitive sub-population (p1). The multiple plateaus observed after 72h of exposure in the three highest concentrations indicate that the resistant subpopulation (p2) has a tail of more resistant cells with higher threshold for initiation of drug-induced cell death. (e) EMMA’s mathematical representation of the threshold for induction of cell death depicts two distributions: the first, more sensitive, is almost uniform, while the second, more resistant, is represented by a wider distribution. (f) EMMA’s quantification of rate of drug-induced cell death for both subpopulations. For more details on model implementation, please refer to Mathematical Model Description section.
Where the composition of each subpopulation at initial time t0 is modeled as a distribution with a mean μj and standard deviation σj that define the percentage of cells that initiate cell death when the accumulated damage surpasses τ. For computational purposes, we have discretized this distribution in a histogram with n bins, ranging from μj−6σj to μj+6σj, using MATLAB’s function normpdf (Supplemental Figure 2).
There is no biological meaning for negative τ, so the histogram is truncated when μj−6σj <0, and the value of each bin is normalized so that the sum of all bins corresponds to pj. Thus, at initial time t0, the composition of the jth subpopulation is:
| (Euqation 5) |
To separate drug-induced and spontaneous cell death, we divide every ex vivo dose-response curve by the corresponding vehicle control. Thus, the ex vivo data used to parameterize the mathematical model consists of percent live cells normalized by control at every time point, drug concentration, and exposure time. We then use MATLAB’s lsqcurvefit function to find the model parameters that minimize the difference between normalized ex vivo data and the model estimates.
The last step consists of choosing among the four possibilities (1 or 2 subpopulations, clonal or distribution) the model that best describes the ex vivo data. We achieve this by applying Akaike’s Information Criterion(3) (AIC), which favors the best fitting model with the least number of parameters. Our simulations have shown that models with 3 or more subpopulations are never chosen, as they produce minor improvements in ex vivo data fitting, and are significantly penalized by AIC due to their large number of parameters (e.g. 1-population distribution requires 5 parameters, 2-subpopulation distributions require 9 parameters, 3-subpopulation distributions require 13 parameters).
In summary, the model assumes the existence of one or two tumor subpopulations, with different degrees of chemosensitivity. Each subpopulation, in turn, exhibits a range of sensitivity to therapy modeled as a normally distributed probability density function.
Introduction:
For decades there have been attempts to develop predictive biomarkers in cancer, unfortunately, to limited translational success(4). Most biomarker development today depends on molecular techniques applied to dead cells, cell lines, or primary cancer cells isolated from their microenvironment; thus, failing to account for many elements needed to properly assess therapeutic efficacy(5). We anticipate that the development of novel technologies and multidisciplinary approaches to directly assess chemosensitivity of primary cells in ex vivo reconstructions of the tumor microenvironment (TME) are critical avenues towards personalized predictive biomarker development(6–8).
Multiple myeloma (MM) is a treatable, but incurable malignancy of plasma cells(9), which serves as an excellent model disease to examine the potential of personalized management strategies. Frontline therapy combining multiple novel agents, high-dose therapy with autologous stem cell transplant, and maintenance therapy has yielded a high success rate of response in MM(10). However, all patients eventually relapse, with the treatment of relapsed patients relying mainly on clinical acumen. This empirical approach has been made increasingly more difficult by the large number of approved anti-MM agents, leading to astronomical numbers of possible two-, three- or even four-drug combinations. In addition, at least one or two cycles of therapy are required to determine clinical efficacy, during which time the patient may suffer side effects without clinical benefit. Moreover, individual patients may be sensitive to targeted agents not formally investigated in MM (11, 12). Thus, an assay capable of choosing the drug combination with highest clinical benefit would provide a critical step forward in the personalized treatment of relapsed MM and other hematologic malignancies(13).
We describe an approach to predict clinical response of MM patients to multiple classes of drugs, hereon refered to as EMMA (Ex vivo Mathematical Myeloma Advisor), designed to overcome the main hurdles that have limited the success of past and present technologies for assessment of clinical efficacy of experimental drugs in MM. Historic colony formation assays (CFA) require 2–3 weeks to yield results, which is beyond clinically actionable time. Additionally, MM cells have a low success rate of colony formation(4). Patient Derived Tumor Xenografts (PDX) models, while an invaluable tool for basic and translational research, are equally limited as predictive biomarkers due to extensive interval required for tumor engraftment and treatment response(14). Further, the infrastructure, financial burden, number of MM cells and, until recently, the lack of an appropriate host, make PDX models sub-optimal as clinically predictive biomarkers for testing the large number of drugs available in MM(15). In contrast, using off-the-shelf multi-well plates, EMMA can test 31 drugs or combinations in 384-well plates, or 127 drugs in 1,536-well plates(16), with as few as 0.5 million MM cells, thus allowing the clinical screening of an individual MM patient to all standard-of-care and clinically relevant ‘non-MM’ therapeutics, in a single experiment.
In order to evaluate the accuracy of EMMA as a predictive MM biomarker, we have tested samples of primary MM cells from fresh bone marrow biopsies against multiple standard-of-care and experimental agents generating patient- and drug-specific mathematical models of chemosensitivity and clinical response to therapy within 5 days of biopsy. Crucially, we prospectively validated these in silico responses with post-biopsy treatment outcomes. EMMA also provides a platform to conduct in silico clinical trials to assess the efficacy of novel therapeutics. We assessed the efficacy of a series of experimental agents, including 25 protein kinases inhibitors (PKI), demonstrating patient-specific responses. Further, test/re-test reproducibility was demonstrated in patients with sequential biopsies. Collectively, these results support the use of EMMA as a novel rapid, reproducible, and high-throughput, ex vivo- and mathematical-informed decision-support tool for patient-specific MM therapy.
Materials and Methods:
Primary cancer cells.
We investigated the ex vivo response of cancer cells from MM patients (newly diagnosed or relapsed). Investigators obtained signed informed consent from all patients who were enrolled on the clinical trials MCC# 14745, MCC#14690 and MCC# 18608 conducted at the H. Lee Moffitt Cancer Center and Research Institute, as approved by the Institutional Review Board. To this end, patient samples were utilized in accordance with the Declaration of Helsinki, International Ethical Guidelines for Biomedical Research Involving Human Subjects (CIOMS), Belmont Report and U.S. Common Rule. The medical records were de-identified and only the following clinical-relevant information was reviewed: (A) treatment administered (therapeutic agents, doses and schedule) prior to biopsy; (B) cytogenetics; and (C) serum and urine electrophoresis results.
Cell lines.
MM1.S myeloma cells were obtained in 2009. The MM1.S ATCC obtained cell line is validated biannually (last, February 2017) by comparing short tandem repeat analysis (STR) with ATCC’s genetic profile (Geneteca, Burlington, NC) and screening for mycoplasma contamination by PCR (Agilent Technologies, Santa Clara, CA). Cells are utilized for only 2 to 8 passages before renewal with validated cryostorage aliquots.
Stromal cells.
The non-CD138 selected cells from bone marrow aspirates were placed in a flask with RPMI 1640 media supplemented with FBS (heat inactivated), penicillin/streptomycin, and passaged until only adherent cells remained(17). As this process takes weeks, primary MM cells from fresh biopsies were co-cultured with established stroma from prior patient samples.
Ex vivo assay.
The ex vivo assay used to quantify chemosensitivity of primary MM cells was described in detail previously(16). Briefly, fresh bone marrow aspirate cells are enriched for CD138+ expression using magnetic beads. MM cells (CD138+) were seeded in multi-well plates with collagen-I and previously established human-derived stroma, to a total volume of 8μL containing approximately 4,000 MM cells and 1,000 stromal cells. Each well is filled with 80μL of RPMI 1640 media supplemented with FBS (heat inactivated), penicillin/streptomycin, and patient-derived plasma (10%, freshly obtained from patient’s own aspirate, filtered) and left overnight for adhesion of stroma (Supplemental Figures 1 and 3). The next day drugs were added using a robotic plate handler, so that every drug was tested at five concentrations (1:3 serial dilution) and two replicates. Negative controls (supplemented growth media with and without vehicle control, DMSO) were included, as well as positive controls for each drug (cell line MM1.S at highest drug concentration). Plates were placed in a motorized stage microscope (EVOS Auto FL, Life Technologies) equipped with an incubator and maintained at 5% CO2 and 37°C. Each well was imaged every 30 minutes for a total duration of four days (Supplemental Figures 1, 3 and 4).
Digital image analysis algorithm.
We have developed a digital image analysis algorithm previously described(8, 16) to determine changes in viability of each well longitudinally across the 96h interval. In summary, this algorithm computes differences in sequential images and identifies as live cells those with continuous membrane deformations resulting from the interaction with the surrounding matrix. These interactions cease upon cell death. By applying this operation to all 192 images acquired for each well, it is possible to quantify non-destructively, and without the need to separate stroma and myeloma, the effect of drugs as a function of concentration and exposure time (Supplemental Figure 1d–e).
Simulation of clinical treatment.
The ultimate goal of this work is to predict the clinical response of MM patients to therapy using the proposed mathematical model of chemosensitivity, and the pharmacokinetic properties of the drug and regimen chosen. Below we describe an example of prediction of treatment with carfilzomib, whose regimen consists of infusions on days 1, 2, 8, 9, 15 and 16 in a cycle of 28 days. Blood concentration of carfilzomib peaks at ~5.5μM upon injection, quickly decreasing to 30nM after 20’, 1.4nM at 1h and 0.14nM after 4h(18).
To simulate the treatment of a patient, we replace the function R(t) from Equation 2 by the pharmacokinetic curve of blood concentration of drug for the entire interval of the treatment. For example, let us consider patient Pt103, whose chemosensitivity to carfilzomib is depicted in Supplemental Figure 5: drug concentrations ranged from 50nM to 0.6nM. Total exposure time was 96h, with imaging intervals of 30 minutes. Black dots represent actual data measurements. Green and blue surfaces represent distributed models of one and two populations, while cyan and red (overlapped) represent one and two population models with no distribution. As per the Akaike’s Information Criterion (AIC) the two population model with distribution is the best ex vivo fit.
The parameters for this patient’s model of chemosensitivity to carfilzomib are listed in Supplemental Table 1. The in vivo growth rate, obtained from the rate of increase in monoclonal paraprotein from the latest relapse, is determined by the labeling index (LI) of 1.44%. Parameter a6 indicates that there are two sub-populations within this tumor burden in terms of chemosensitivity to carfilzomib. The first, more sensitive, occupies 53% of the number of cells and the other, more resistant, 47%.
As mentioned earlier, the least squares method is used to estimate parameters for each of the four proposed models. The implementation of this method is done through MATLAB’s lsqcurvefit function, which uses an iterative gradient-based optimization algorithm to find those parameter values that yield the smallest SSR. In order to determine how AIC’s choice of the “best model” eliminates over-parameterization we have conducted convergence studies on the parameters during lsqcurvefit optimization of patient Pt103’s ex vivo response to panobinostat (see Supplemental Material).
Importantly, this approach does not require a training set: all parameter values are obtained by fitting a general set of equations to the ex vivo data, using AIC to penalize more complex and favor simpler models. Thus, this work is a type 4 TRIPOD study(19).
The following pharmacokinetic models were used for the patients tested in this study: bortezomib(20), carfilzomib(21), melphalan(22), liposomal doxorubicin (23), selinexor (CRM1i, investigator brochure), dexamethasone(24), lenalindomide(25), and pomalidomide(26).
Generation of the heatmap representing the activity with 30 drugs in 13 patient-derived MM cells.
25 protein kinase inhibitors were tested in 13 primary MM samples, at 10μM maximum concentration each (1:3 serial dilution, 5 concentrations, 2 replicates). We have quantified the area under the curve (AUC, the average of viability between all replicates across 96h) of each drug for each patient sample and normalized this measure by the maximum possible AUC. If the drug showed no effect whatsoever, the normalized AUC would be 100%, while drugs with higher effect have a lower AUC. Drugs were sorted from most active (lowest average AUC) to least active (highest average AUC).
Results:
Ex vivo data and mathematical models capture the heterogeneity of tumor’s chemosensitivity.
Figure 1 and Supplemental Figure 1 illustrate the workflow for ex vivo analysis of chemosensitivity: CD138-selected MM cells obtained from fresh bone marrow aspirates were seeded in multi-well plates with collagen and previously established human-derived primary stroma. After overnight incubation to ensure stroma adhesion, 31 different drugs were added, and plates were imaged every 30 minutes for four days. As previously described(8, 16), a digital image analysis algorithm determined the number of viable cells in every well at each of the 192 time points, thus producing 1,920 data points per drug. Supplemental Figure 1e demonstrates an output of the ex vivo assay. Curves represent changes in viability of primary MM cells and a cell-line control to different drug concentrations during 96h. These data were used to parameterize patient-specific mathematical models of chemosensitivity (see Methods and Supplemental Material).
The central aspect of EMMA is the ability to characterize tumor heterogeneity in the form of subpopulations with different degrees of chemosensitivity to a given drug (Figure 2a). The importance of proper characterization of tumor heterogeneity is depicted in Figures 2b–c: a homogeneous tumor reacts to therapy monotonically, either by steadily decreasing (Figure 2c, green line) or by sustained growth. A heterogeneous tumor, however, harboring a chemoresistant subpopulation, will have a curve of response characterized by an inflection point at the time of relapse (Figure 2c, blue line). To identify these subpopulations from the ex vivo dose response data, we test four hypotheses: the first assumes only one “clonal” population (all cells in the tumor have the same degree of sensitivity to one particular drug), the second assumes that there is one population but its chemosensitivity follows a normal distribution. The two other models assume two “clonal” subpopulations or two distributions, respectively. EMMA identifies the parameters that best fit each of these four models to the ex vivo data (Figure 2d) and chooses the best model after residue correction by Akaike’s Information Criterion to avoid overfitting(3). In the example of Figure 2e, EMMA’s interpretation is that the tumor is composed of two subpopulations, p1 and p2: the first is more uniform (“clonal”) and more sensitive, while the second has higher variance (Figure 2e–f) and is more resistant.
EMMA predicts clinical response of MM patients to single agents or drug combinations.
52 patient specimens were tested ex vivo against a panel of drugs and EMMA model predictions were tested against clinical outcome to the same drugs. The median patient age was 64.5 years, 21 patients were female, 13 were newly diagnosed, and the majority relapsed and/or refractory (Table 1). In order to generate clinical predictions of response to therapy, EMMA simulates each of the drugs in a regimen independently, and combines all responses assuming additivity. Figure 3 describes patient Pt111’s response to a triplet regimen of carfilzomib (K), lenalidomide (R) and dexamethasone (D). Figure 3a depicts the ex vivo response to carfilzomib (black dots) as well as the mathematical model proposed by EMMA (blue surface). Figure 3b depicts the actual response of this patient to the 3-agent treatment (black dots linked by dashed lines) and model-predicted response of this patient to carfilzomib as single agent (green line). Figures 3c–d and Figures 3e–f represent ex vivo and clinical predictions for the same patient to dexamethasone and lenalidomide, respectively. The combination of the 3 models shows high correlation with the actual outcome (Figure 3g). Figure 3h shows the predictions of clinical response of this patient to other drugs: those expected to be most clinically effective were carfilzomib, bortezomib, and liposomal doxorubicin, while pomalidomide and lenalidomide were predicted to have little effect on this patient’s tumor.
Table 1.
Patient demographics, correlation between model predictions and clinical outcome according to IMWG, and theoretical best outcome based on model predictions of best therapy.
| Patient ID | Age | Gender | Status at Bmbx | Actual treatment | Actual Response/ No response | Model’s prediction Response/No response | Actual outcome (last M-Spike available) | Model’s outcome (last M-Spike available) |
|---|---|---|---|---|---|---|---|---|
| 6 | 68 | M | PD | PI+IMID | NR | NR | PD/SD | PD/SD |
| 7 | 76 | M | PD | PI+ALK+IMID | NR | NR | PD/SD | PD/SD |
| 9 | 51 | F | PD | PI+IMID | NR | NR | PD/SD | PD/SD |
| 10 | 56 | F | PD | PI+IMID | R | R | MR/PR | MR/PR |
| 11 | 45 | M | ND | PI+IMID | R | R | VGPR/CR | VGPR/CR |
| 12 | 65 | F | ND | PI+IMID | R | R | VGPR/CR | VGPR/CR |
| 14 | 68 | M | ND | PI+IMID | R | R | VGPR/CR | VGPR/CR |
| 15 | 76 | M | ND | PI+IMID | R | R | VGPR/CR | VGPR/CR |
| 18 | 77 | F | PD | PI+IMID | R | R | MR/PR | VGPR/CR |
| 21 | 63 | M | PD | PI+IMID | NR | NR | PD/SD | PD/SD |
| 24 | 66 | M | ND | PI+IMID | R | R | VGPR/CR | VGPR/CR |
| 27 | 49 | F | PD | PI+IMID | NR | NR | PD/SD | PD/SD |
| 34 | 66 | M | RD | PI+IMID | NR | NR | PD/SD | PD/SD |
| 36* | 51 | F | PD | CRM1i+DOX+DEX | R | R | MR/PR | MR/PR |
| 37 | 69 | M | PD | PI+ALK+IMID | NR | NR | PD/SD | PD/SD |
| 39* | 51 | F | PD | CRM1i+DOX+DEX | R | R | MR/PR | VGPR/CR |
| 47 | 62 | F | PD | PI+IMID | R | R | MR/PR | MR/PR |
| 51** | 49 | F | PD | CRM1i+DOX+DEX | R | R | MR/PR | MR/PR |
| 53 | 53 | M | PD | CRM1i+DOX+DEX | R | R | MR/PR | MR/PR |
| 54 | 62 | M | PD | PI | NR | NR | PD/SD | PD/SD |
| 55 | 71 | M | PD | PI+ALK+IMID | NR | NR | PD/SD | PD/SD |
| 56 | 64 | M | PD | PI+IMID | R | R | MR/PR | MR/PR |
| 57** | 66 | M | PD | CRM1i+DOX+DEX | R | R | MR/PR | VGPR/CR |
| 58 | 68 | F | RFD | PI+IMID | NR | NR | PD/SD | PD/SD |
| 59 | 74 | M | RD | CRM1i+DOX+DEX | R | R | MR/PR | VGPR/CR |
| 64 | 75 | M | PD | PI | NR | NR | PD/SD | PD/SD |
| 68 | 53 | M | PD | CRM1i+DOX+DEX | R | R | MR/PR | MR/PR |
| 69 | 65 | F | PR | PI+ALK+IMID | NR | NR | PD/SD | PD/SD |
| 71 | 74 | M | RD | CRM1i+DOX+DEX | R | R | MR/PR | MR/PR |
| 73 | 64 | F | ND | PI+IMID | R | NR | MR/PR | PD/SD |
| 74 | 63 | M | PD | PI+IMID | R | R | MR/PR | MR/PR |
| 78 | 67 | F | RFD | PI+ALK+IMID | R | R | MR/PR | MR/PR |
| 84 | 67 | M | RFD | CRM1i+DOX+DEX | NR | NR | PD/SD | PD/SD |
| 87 | 76 | M | PD | PI+IMID | R | R | VGPR/CR | MR/PR |
| 94 | 82 | F | ND | PI+ALK+IMID | R | R | VGPR/CR | MR/PR |
| 95 | 56 | F | PD | CRM1i+DOX+DEX | R | NR | MR/PR | PD/SD |
| 97 | 68 | M | PD | ALK (ASCT) | R | R | VGPR/CR | VGPR/CR |
| 98 | 67 | F | PD | PI+IMID | R | R | VGPR/CR | VGPR/CR |
| 100 | 70 | M | PD | PI+IMID | NR | NR | PD/SD | PD/SD |
| 102 | 67 | F | PD | PI+IMID | R | R | MR/PR | MR/PR |
| 103 | 40 | M | ND | PI+IMID | R | R | VGPR/CR | VGPR/CR |
| 105 | 62 | M | ND | PI+IMID | R | R | VGPR/CR | MR/PR |
| 110 | 70 | M | PD | P+D+ACY241 | R | R | MR/PR | MR/PR |
| 111 | 64 | M | ND | K(70)+R+D | R | R | VGPR/CR | VGPR/CR |
| 114 | 52 | M | ND | V+R+D | R | R | MR/PR | MR/PR |
| 119 | 67 | M | RD | K+CY+D | R | R | MR/PR | MR/PR |
| 120 | 58 | M | SMM=>MM | K+R+D | NR | NR | PD/SD | PD/SD |
| 121 | 60 | F | PD | P+D+DARA | R | R | MR/PR | VGPR/CR |
| 122 | 63 | F | PD | V+R+D | R | R | VGPR/CR | VGPR/CR |
| 126 | 65 | F | PD | K+R+D | R | R | MR/PR | VGPR/CR |
| 127 | 58 | F | ND | V+D | R | R | MR/PR | MR/PR |
| 130 | 76 | M | PD | CRM1i+DX+D | R | R | MR/PR | MR/PR |
The age range was 40–81, with a median of 65 years old. Biopsies were obtained between 4/2014 and 7/2016.
indicate sequential biopsies of the same patient. Abbreviations for disease status: PD = progressive disease, ND=newly diagnosed, RD = relapsed disease, RFD = refractory disease. Abbreviations for treatment: M = marizomib, CFZ = carfilzomib, CY = cyclophosphamide, D = dexamethasone, VD = bortezomib + dexamethasone, VRD = bortezomib + lenalidomide + dexamethasone, OPR = oprozomib, CRD = carfilzomib + lenalidomide + dexamethasone, VPD = bortezomib + pomalidomide + dexamethasone, CyBorD = cyclophosphamide + bortezomib + dexamethasone, V = bortezomib, CFZ + P + D = carfilzomib + pomalidomide + dexamethasone, DX = liposomal doxorubicin. Abbreviations for clinical response: CR = complete response, VGPR = very good partial response, PR = partial response, MR = minimal response, SD = stable disease, PD = progressive disease.
Figure 3. From mathematical model to clinical predictions.
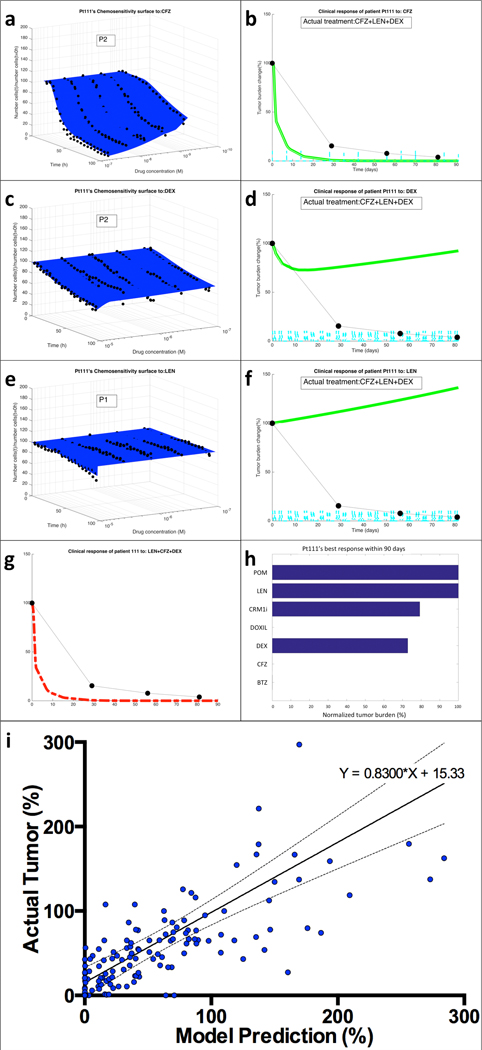
(a) EMMA’s mathematical model fitting of patient Pt111’s MM cells’ ex vivo response to carfilzomib (CFZ) indicates the presence of two “clonal” (no distribution) subpopulations. (b) The simulation of the patient-specific mathematical model using published phase-I trial pharmacokinetic data generates a prediction curve of clinical response. The actual response of the patient, as measured by serum paraprotein, is overlaid as black dots linked by dashed lines. The same process was followed for the two other drugs in the regimen, dexamethasone (DEX) (c,d) and lenalidomide (LEN) (e,f). By combining the effect of the three drugs assuming additivity, EMMA creates the actual clinical prediction of the patient’s estimated response to the therapeutic regimen (g). (h) An analysis of the clinical efficacy (lowest achievable tumor burden, normalized by treatment initiation) shows that carfilzomib, bortezomib and liposomal doxorubicin are the most active agents, with a prediction of 100% tumor reduction, followed by dexamethasone (27% tumor reduction) and CRM1i (21% reduction). Lenalidomide and pomalidomide had no predicted effect. (i) Tumor burden measures from each of the patients in this study (133 in total, detailed in Supplemental Figure 6) were correlated with the corresponding model prediction. The linear regression indicates high correlation between model predictions and actual outcome (equation of regression line Actual=0.8300*Model+15.33, Pearson r=0.5658, P<0.0001).
Classification of 52 MM patients as responders or non-responders.
Clinically, MM response is monitored over time via sequential measurements of serum or urine monoclonal antibody produced by malignant cells (paraprotein) as a surrogate assessment of tumor burden. The least strict level of validation of this predictive model was to classify patients as responders and non-responders. Table 1 shows that this model correctly classified 50/52 patients (96%) according to response/no-response. The first exception, Pt73 was predicted not to respond, but the cycle 2 day 1 paraprotein measure indicated a 70% tumor reduction. Unfortunately, this patient died 3 weeks later with disease progression, and no subsequent measures are available to confirm response/progression. Pt95’s model correctly predicted an initial response (Supplemental Figure 6), but anticipated an early relapse, thus classifying this patient at 90 days as non-responder. Of note, this patient relapsed after four months.
Predictions according to IMWG stratification.
A more strict level of prediction is used to assess clinical response according to a stratification system aligned with the International Myeloma Working Group (IMWG) MM response criteria(27), which clusters patient responses in 3 categories: VGPR/CR includes complete response (>99% tumor reduction) or very good partial response (90%−99% reduction), MR/PR includes partial response (50%−90% reduction) or minimal response (25%−50% reduction), and PD/SD, which includes stable disease (<25% reduction) or progressive disease (>25% increase). Table 1 outlines the post-biopsy therapy received by each patient in this study, corresponding clinical outcome according to the IMWG response criteria(28), and EMMA’s predictions. Model predictions and clinical outcome agreed in 41/52 patients (79%). The highest accuracy occurred when the model predictions were PD/SD (15/17, or 88% accuracy), followed by MR/PR (16/19, or 84% accuracy) and VGPR/CR (10/16, or 63% accuracy). The narrower the range of response in each category, the greater the chance of disagreement between model predictions and actual outcome. Therefore, a more natural validation of EMMA would be a direct correlation between the actual tumor burden measures and model predictions as continuous variables.
Linear correlation between predicted and actual tumor burden.
The strictest validation of this model is the direct correlation of the tumor burden predictions with all available tumor burden measurements. Supplemental Figure 6 highlights the model predictions and actual tumor burden measurements from 52 patients. Each graph shows tumor burdens normalized by the date of beginning of treatment post-biopsy (i.e. tumor burden=100% at time=0 days). Thick colored lines represent model predictions of clinical response generated 5 days post-biopsy. Each prediction curve is flanked by thinner lines, representing the upper and lower boundaries of the prediction. These boundaries are a function of low and high estimates of tumor growth rate, computed from pre-biopsy measures of tumor burden. Black dots linked by dashed lines represent the patient’s clinical post-biopsy tumor burden measurements. Figure 3i shows the aggregated correlation between mathematical model predictions and actual clinical response for all available tumor burden measurements from the 52 patients within 90 days post-biopsy (133 data points). The regression line between in silico model predictions and clinical response, shown flanked by the 95% confidence interval, had a slope of 0.83 and Pearson correlation coefficient r=0.5658 (P<0.0001).
Estimated clinical benefit of EMMA as a decision-support system for choice of therapy.
As a multi-drug predictive biomarker, EMMA has two main goals: 1) to ensure that each patient receives the most effective therapy and 2) to remove ineffective drugs from therapy. According to the model predictions, if EMMA’s choice of drugs were used, the number of patients in this study who achieved VGPR or CR would have increased from 13 to 22, the number of patients presenting MR or PR would have decreased from 24 to 23, and the number of patients with no clinical benefit (PD or SD) would have decreased from 15 to 7. Also, according to EMMA, 60% of patients in this study received at least one agent with no predicted clinical efficacy (Supplemental Table 2). As an estimate of the single-agent efficacy of the drugs administered to these 52 patients, EMMA predicted that 34% of the agents had no predicted clinical efficacy, 24% were predicted to produce stable disease, 27% a minimum or partial response, and 15% a very good or complete response. These data suggest the potential clinical benefit of identifying the right drug for the right patient at the right time.
A high-throughput tool for personalized drug screening.
We have tested the sensitivity of primary MM cells from 13 patient samples to a panel of 5 anti-MM agents and 25 protein kinase inhibitors (PKI). In Figure 4a, each cell of the heat map represents the average 96h-area under the curve (AUC) of the five concentrations (1:3 serial dilution, two replicates each) for each drug in individual patients. The drugs were ordered from lowest to highest AUC averaged across all patients, green being the most effective and red the least effective. Figure 4b lists the previous lines of therapy. Despite inter-patient variation, it is possible to identify PKIs with consistently higher activity (e.g. BI2536, INK128, ponatinib, MK2206 and crizotinib) while others are consistently ineffective (e.g. ralimetinib, vemurafenib, VX745 and BMS777607). Further, PKIs that demonstrated patient-specific activity (e.g. ibrutinib, momelotinib, AZD1480, and palbociclib) highlight the potential for personalized management strategies. For example, the multidrug refractory patients 79 and 83 demonstrated sensitivity to the FDA approved BTK inhibitor ibrutinib, suggesting that these two patients may derive clinical benefit from treatment with this PKI. The remaining patients were resistant to ibrutinib, further illustrating the need for personalized strategies for treatment allocation. These data indicate that this approach may be used to assess patient sensitivity to targeted therapeutics facilitating patient sample-derived drug screening or in silico clinical trials of experimental agents.
Figure 4. Ex vivo chemosensitivity of 13 patient samples to a panel of 25 PKIs and chemotherapeutic agents.
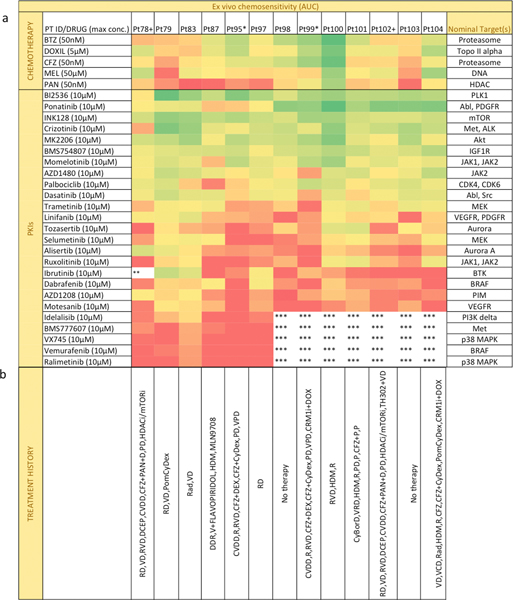
(a) Each sample was tested ex vivo in co-culture with stroma for 96h against 6 chemotherapeutic agents and 25 PKIs at five concentrations. Chemosensitivity was quantified as the normalized area under the curve (AUC) for all five concentrations. Drugs were sorted descending order by decreasing activity, with most active drugs represented as green and least active as red. * or + represent patients with sequential biopsies. ** Maximum concentration of drug was 6μM. ***Drug not tested. (b) The list of previous treatments: lenalidomide (R), dexamethasone (D or Dex), bortezomib (V), dexamethasone + cyclophosphamide + etoposide + cisplatin (DCEP), cyclophosphamide + bortezomib + liposomal doxorubicin + dexamethasone (CVDD), carfilzomib (CFZ), panobinostat (PAN), pomalidomide (POM or P), liposomal doxorubicin + dexamethasone + lenalidomide (DDR), high-dose melphalan followed by bone marrow transplant (HDM), cyclophosphamide (Cy), radiation (Rad), cyclophosphamide + bortezomib + dexamethasone (CyBorD) and pomalidomide + dexamethasone (PD).
In addition, by grouping the 30 agents in pairs and performing a linear regression in each of the possible 435 combinations, it was possible to investigate agents with putative ex vivo activity correlation (Supplemental Figure 7). Fifteen pairs of drugs showed Pearson correlation coefficient r>0.75, suggesting that their anti-MM activities involved similar biological processes in these patient specimens. Certain pairs were consistent with known activities such as carfilzomib/bortezomib and bortezomib/panobinostat, which have established links in anti-MM activities(29). Other pairs, including panobinostat(HDACi)/ponatinib (Abli), with a positive slope of 0.8755 and r=0.7695, suggest previously undefined shared biological pathways contributing to MM survival. Interestingly, there were no instances of drugs with significant inter-patient inverse correlation. This suggests that, across a group of patients, increased resistance to one drug during treatment correlates with increase, or has no effect at all, on resistance to a second drug, while cross-sensitization between drugs is unlikely (Supplemental Figure 8). This has been observed in multiple clinical trials of alternating therapies seeking to exploit a cost of adaptation to two different regimens(30). Ultimately those studies failed to demonstrate a significant improvement in survival between sequential and alternating groups(31, 32). However, our data suggests that there are patient-specific exceptions to this rule. For instance, Supplemental Figure 9 depicts changes in 96h-LD50 values for two patients between two sequential biopsies for 20 PKIs, with the post-treatment tumors becoming more resistant to some PKIs and, importantly, more sensitive to others, including the clinically relevant crizotinib and ponatinib, as well as the PLK inhibitor BI2536(33), once again, highlighting the potential for phenotypically-derived biomarker tools for truly personalized management.
Critically, even drugs within a same class, such as bortezomib and carfilzomib, can have significantly different clinical efficacy. Carfilzomib has been shown to be the more effective PI in early relapsed MM(34); however, from Supplemental Table 2, Figure 5 and Supplemental Figure 10, it is clear that individual patients have differential predicted sensitivities to one PI versus the other. For instance, 7 of the 21 patients predicted as resistant to bortezomib were predicted to respond to carfilzomib. In contrast, 10 of the 24 patients predicted as resistant to carfilzomib were predicted to respond to bortezomib. Despite correlated ex vivo activity (Supplemental Figure 7) the two drugs have different PK, leading to different predicted clinical responses. Collectively, these data again illustrate the potential clinical importance of allocating the right drug to the right patient at the right time- even within a class of agents.
Figure 5. Model predictions of clinical response of 41 MM patients indicate no correlation between bortezomib and carfilzomib 90-day depth of response.
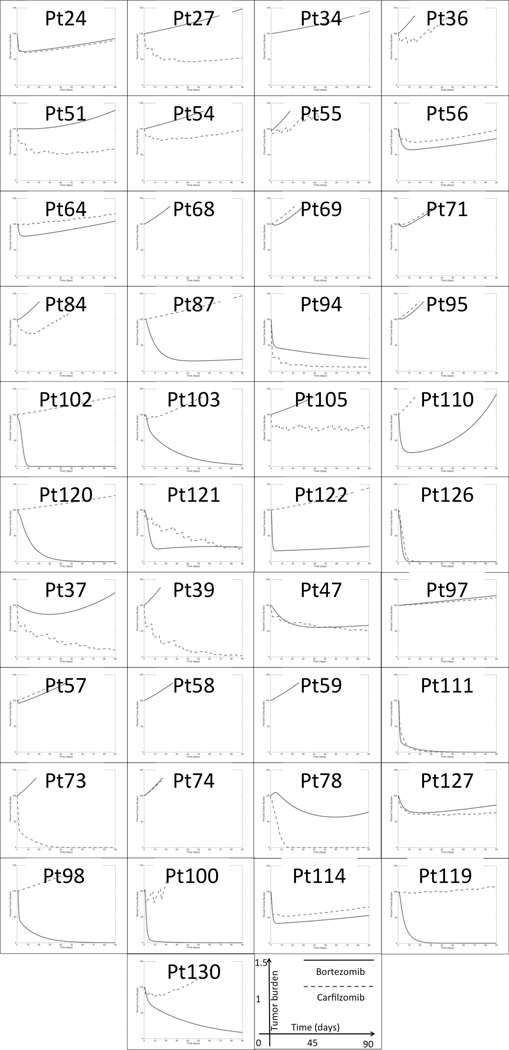
Each graph represents the model-predicted clinical response to bortezomib (blue solid line) and carfilzomib (red dashed line) as single agents during an interval of 90 days. The vertical axis, ranging from 0% to 150%, represents the tumor burden values as a percentage of the pre-treatment tumor (day 0).
A platform for in silico clinical trials.
We have tested 19 patient samples (Supplemental Table 3) with the HDAC6 inhibitor ricolinostat (Ri) and the Bcl-2 inhibitor venetoclax (Ve), created patient-specific models of chemosensitivity and simulated how these patients would have responded in a clinical trial. We have compared our results with actual phase I/II studies with single agents and combination with bortezomib (V) and dexamethasone (D)(35, 36). The only data used for the simulations were the ex vivo results and drug-specific pharmacokinetics. The results are depicted in Figure 6: in the single agent ricolinostat arm of the in silico trial (Figure 6a), 1 patient (5%) was predicted to achieve VGPR/CR, 1 patient (5%) would achieve MR, while the remaining 17 (90%) would present PD/SD, in agreement with the low single agent efficacy observed in the actual trial (60% PD and 40% SD). The simulation of single agent venetoclax (Figure 6b) predicted 3 patients reaching VGPR/CR (17%), 3 reaching PR (17%), 3 reaching MR (17%) and 9 presenting PD/SD (50%). Consistent with the clinical activity of venetoclax in phase I trials(36), t(11,14) status correlated with EMMA predicted drug sensitivity with a mean depth of response 60% vs. 31% of t(11,14) positive versus negative MM, respectively (P=0.0275). Note that newly diagnosed status (NDMM) was also a predictor of response (Figure 6b insert). It is also important to note that responses and failures were noted in both groups as well, demonstrating that molecular screening alone would not adequately predict clinical outcome. The virtual trial also projected clinical benefit for adding either drug to bortezomib and dexamethasone (V+D, P=0.0181 and P=0.0175 for Ri for Ve, Figures 6c and 6d, respectively). Again, the actual benefit is observed in only a percentage of patients, highlighting the potential for the utilization of a phenotypic biomarker screening prior to treatment.
Figure 6. Virtual clinical trial of ricolinostat and venetoclax as single agents and combination with bortezomib and dexamethasone.
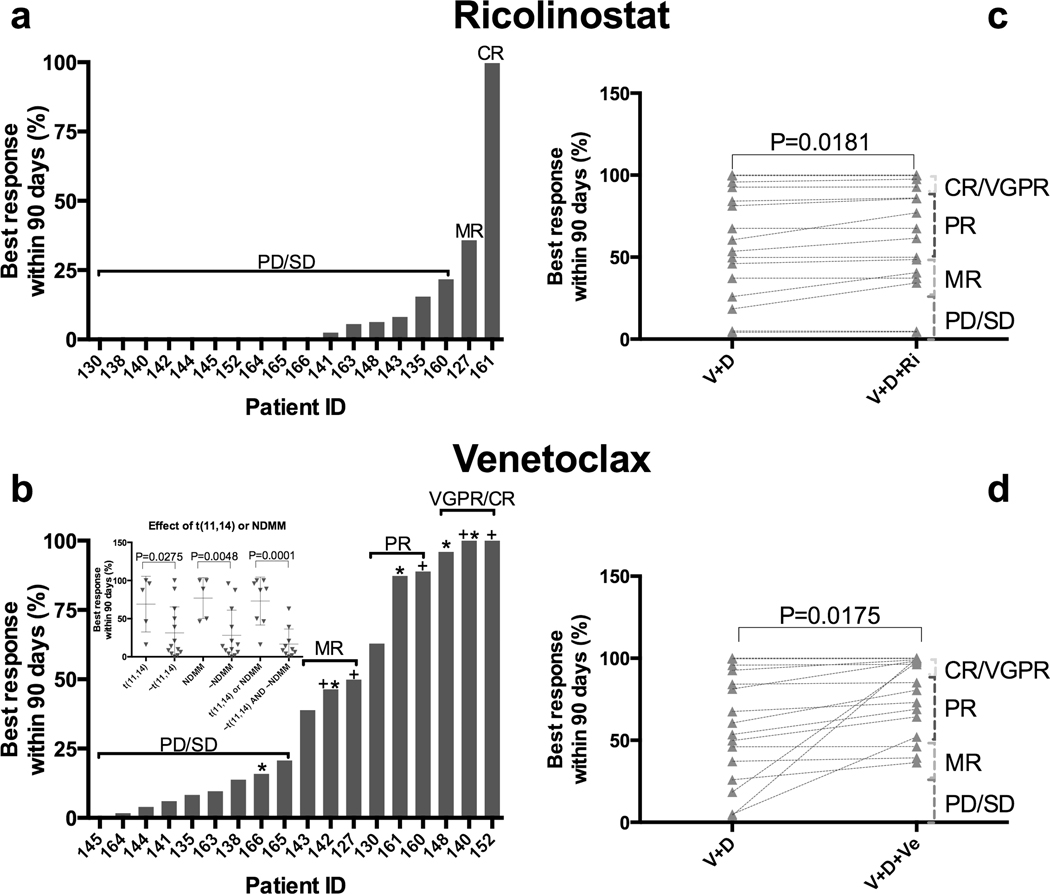
We have used EMMA to simulate the clinical response of 19 MM patients to the HDAC6 inhibitor ricolinostat (160mg days 1–5 and 8–12 on a 21-day cycle) and the BCL-2 inhibitor venetoclax (1200mg daily) as single agents and in combination with bortezomib and dexamethasone. A and B represent each of the patients’ maximum response to either drug as single agents during 90 days, 100% indicating complete tumor regression and 0% indicating no tumor reduction. C and D indicate each patient’s expected response to either drug’s combinations with bortezomib and dexamethasone (V+D, V+D+Ri and V+D+Ve). Statistical differences were observed as a consequence of the inclusion of ricolinostat (two-tailed paired t test, P=0.0181) and venetoclax (two-tailed paired t test, P=0.0175), despite limited single agent activities in most patients. Presence of translocation 11,14 or newly diagnosed status correlated with sensitivity to single agent venetoclax (inset B). t(11,14) stands for positive for translocation between chromosomes 11 and 14, NDMM stands for newly diagnosed, ~ stands for “not”, thus “~NDMM” stands for not newly diagnosed.*t(11,14) positive, +newly diagnosed.
Discussion:
MM is an example of a cancer in which the efforts of basic, translational and clinical research have provided a growing number of therapeutics with significant improvements in survival. Yet, curative intent therapy remains elusive. To this end, it is critical that we best allocate these therapies to maximize outcomes (and ideally minimize toxicities). Here, we have demonstrated a novel approach to predict clinical response of MM patients to a wide range of therapeutics using an ex vivo chemosensitivity assay and computational models. This assay is scalable, reproducible and allows analysis of drug efficacy in primary MM cells in the presence of elements of the tumor microenvironment (matrix, patient-derived serum, and human bone marrow-derived stroma). The major contribution of this approach, compared to existing techniques, is the detailed ex vivo characterization of the heterogeneity of tumor chemosensitivity, and the integration with mathematical models to accurately and reproducibly predict clinical response, with the potential to improve patient clinical outcomes through model-informed personalized management decisions.
EMMA has a number of advantages compared to past and current pre-clinical chemosensitivity assays. First, similar experiments would have cost and time prohibitive hurdles in PDX models and may not be concluded in clinically actionable time frame(14). Second, EMMA not only mimics the real-time action of the drug on cancer cells, but mathematical models are used to extrapolate this short-term response into a longer clinical time frame, based on pharmacokinetic (PK) data. This trait makes EMMA an attractive system for MM patients, including multi-drug refractory patients requiring salvage therapy. Third, patient-specific EMMA mathematical models can be used to test the effect of multiple classes of drugs in different regimens, leading to the assignment of the most efficacious regimen or drug to individual patients(21). Finally, EMMA’s output is not limited to a dichotomized response/no-response or depth of response, but trajectories of actual clinical response at any moment during the first 3 months of treatment. Thus, its predictions can be followed in real-time during treatment, giving both physician and patient the opportunity to make informed, pre-treatment decisions, and proactively act during therapy.
Recent works in the field have suggested different approaches to identify agents with clinical efficacy in liquid and solid cancers. Pemvoska et al(7) have described a combination of ex vivo chemosensitivity and molecular profiling to determine therapeutic windows for drugs in acute myeloid leukemia (AML). Majumder et al have combined ex vivo chemosensitivity assays of slices of tumor explants(37), immunohistochemistry and clinical data to create a signature to classify clinical response of patients with solid tumors. Both methods assess chemosensitivity at one fixed time point and do not account for the temporal dynamics of cell death, essential for the extrapolation of the effect of short periods of drug exposure (in vitro) to actual clinical response. In an analogy to physical sciences, these assays are capable of determining the initial speed of the clinical response but not “acceleration” and thus cannot predict the clinical trajectory. The concept of “acceleration” implies that the response of cancer cells to therapy cannot be described as a first-order differential equation, where rate of cell death is proportional to drug concentration, but instead requires a second order model, which incorporates the notion of “damage”, and a threshold beyond which cell death starts. To this end, other assays can predict the initial effect of therapy on tumor burden, but cannot predict the actual depth, duration, or time to relapse. In cancers such as MM, depth of response is commonly utilized as surrogates of clinical benefit (38). As such, a system capable of creating actual clinical trajectories (response) will be central to successfully translating in silico predictions to true clinical outcomes. In addition, while the agnostic pattern recognition techniques used in these published works(37) are adequate to create signatures capable of classifying patients into categories such as responders or non-responders, they lack the ability to extrapolate conditions for which the signature was not trained. For instance, how would a patient respond to a combination of two drugs for which signatures were pre-determined, or a different therapeutic regimen (dosing and schedule) for a known drug? The novel approach developed in this work provides an instrumental platform to address these issues. So far, EMMA-generated clinical predictions for regimens of two or more drugs assume additivity, which is the simplest possible implementation. However, our preliminary data indicates regions in the time-concentration space where there is synergy in primary MM cells treated ex vivo (Supplemental Materials and Methods and Supplemental Figure 11). Given drug-specific pharmacokinetics, staggered drug administration schedules, and the inherent heterogeneity of tumor populations, further work is required to adequately incorporate this information in EMMA models.
Predicting clinical response of patients based on ex vivo assays is a major challenge irrespective of how close the assay is to in vivo conditions. The most obvious difficulty is the translation of results from an assay that lasts for days into estimates of clinical response across months or even years(4, 38). We have begun to bridge this timescale gap through the use of mathematical models accounting for tumor heterogeneity, pharmacodynamics and pharmacokinetics imputed with a tested phenotype (drug sensitivity). It has been long known that nature selects for phenotype, not genotype, and that multiple genotypes can produce the same phenotype(39). This non-exclusive relationship makes it challenging to predict clinical outcome from genotype alone or even gene expression profiles(40). EMMA directly identifies the phenotypic (or functional) representation of subpopulations regardless of genotypic background; thus, removing the “middle man” and producing in silico clinical response outputs. Through non-linear regression of the ex vivo chemosensitivity results, the model identifies subpopulations within the tumor burden based on chemosensitivity. In turn, the platform combines these data with drug- and regimen-specific pharmacokinetics, generating trajectories of clinical response demonstrating a high degree of accuracy in predicting outcomes.
We anticipate that this approach can provide precise clinical insight about treatment efficacy in a timely manner and assist oncologists in practicing truly personalized management, by proposing the best choice of therapy for each patient and identifying those with risk of early relapse due to the presence of therapy-resistant cells. In addition to clinical predictions of standard-of-care regimens, this approach can also serve as a means to perform in silico clinical trials(5, 41, 42) (Figure 6), where several experimental agents are tested in primary MM cells from a cohort of patients mimicking the actual clinical setting without the potential cost or toxicity to patients. Additional uses of these mathematical models include the simulation of alternative regimens, such as metronomic therapy(43), adaptive therapy(44), or the introduction of treatment “holidays”(45), depending on the nature of the mechanism of resistance. Once the subpopulations have been identified and characterized by this method, computer simulations can be used to determine which alternative regimens may lead to best clinical outcome(45, 46).
Importantly, the mechanistic nature of these computational models allows the incorporation of additional influences on clonal evolution, including genotypic, epigenetic, microenvironmental and clinical data, to continually upgrade this system. To this end, we expect to continue to build additional parameters into this computational model to improve the predictive capacity and to account for new classes of therapeutics. Studies are underway to integrate our prior models of response trajectories(47, 48) with EMMA to move from predications of depth of response to PFS. Further, we recognize the increasing importance of immune-mediated therapies in MM(49, 50). Our preliminary studies with the CD38 antibody daratumumab(50), using EMMA’s current protocol, have shown activity in primary MM cells in concentrations as low as 86nM, with cell death initiated after 4 days, and reaching 25% viability reduction one day later. As depicted in Supplemental Figure 12, the mechanism of cell death is phagocytosis by a yet-to-be-determined adherent cell present in the co-culture, and only occurs in presence of daratumumab. Research is ongoing to parameterize T cell, NK cell and myeloid derived stromal cell phenotypes in patient bone marrow samples to direct T cell cytotoxicity assays in this platform. We anticipate that these data can be incorporated in EMMA to account for sensitivity to specific immune-based therapies. Further, continued validation of inter-day reproducibility (Supplemental Figure 13), intra-plate variation (Supplemental Figure 14), and dependence of AIC convergence of solution on ex vivo experiment duration and dynamic range of drug concentration (Supplemental Figure 15, Supplemental Table 4, Supplemental Figure 16, Supplemental Table 5, and Supplemental Figures 17–18) are ongoing in larger numbers of patients to achieve the goal of a true clinical decision support tool.
To our knowledge, this study provides, estimates on the individual efficacy of clinically administered agents in MM for the first time: approximately one third of agents administered in this study may have had little to no clinical efficacy, 60% of patients received at least one ineffective agent, and 31% could have been treated with a more effective agent proposed by the mathematical models. Thus, we anticipate that EMMA would provide a critical support to oncologists to customize regimens by avoiding therapeutics that will not benefit the patient; thus, reducing the potential toxicity while maximizing the clinical benefit.
Supplementary Material
Acknowledgements:
The authors thank the patients at H. Lee Moffitt Cancer Center who provided clinical samples for our ex vivo assays as well as consented access to the their clinical data through the Total Cancer Care database.
This research was funded by the H. Lee Moffitt Cancer Center Physical Sciences in Oncology (PSOC) Grant (1U54CA193489-01A1) and by H. Lee Moffitt Cancer Center’s Team Science Grant. This work has been supported in part by the Translational Research Core Facility at the H. Lee Moffitt Cancer Center & Research Institute, a NCI designated Comprehensive Cancer Center (P30-CA076292). Access to primary cells was made possible through the Total Cancer Care Protocol at the Moffitt Cancer Center.
Competing Financial Interests:
Dr. Silva is an inventor in H. Lee Moffitt’s Cancer Center’s patent application (U.S. Patent Application # 61/904,550, Method for Selecting Cancer Treatment Regimen), which describes EMMA as a decision-support system for choice of therapy in cancer patients.
References
- 1.Shargel L, Wu-Pong S, Yu ABC. Applied biopharmaceutics & pharmacokinetics. 5th ed. New York: Appleton & Lange Reviews/McGraw-Hill, Medical Pub. Division; 2005. [Google Scholar]
- 2.Clark AJ. The reaction between acetyl choline and muscle cells. Part II. J Physiol-London 1927;64:123–43. [DOI] [PMC free article] [PubMed] [Google Scholar]
- 3.Akaike H. A new look at the statistical model identification. IEEE Trans Automat Contr 1974;19:716–23. [Google Scholar]
- 4.Suggitt M, Bibby MC. 50 years of preclinical anticancer drug screening: empirical to target-driven approaches. Clin Cancer Res 2005;11:971–81. [PubMed] [Google Scholar]
- 5.Montero J, Sarosiek KA, DeAngelo JD, Maertens O, Ryan J, Ercan D, et al. Drug-induced death signaling strategy rapidly predicts cancer response to chemotherapy. Cell 2015;160:977–89. [DOI] [PMC free article] [PubMed] [Google Scholar]
- 6.Rubio-Perez C, Tamborero D, Schroeder MP, Antolin AA, Deu-Pons J, Perez-Llamas C, et al. In silico prescription of anticancer drugs to cohorts of 28 tumor types reveals targeting opportunities. Cancer Cell 2015;27:382–96. [DOI] [PubMed] [Google Scholar]
- 7.Pemovska T, Kontro M, Yadav B, Edgren H, Eldfors S, Szwajda A, et al. Individualized systems medicine strategy to tailor treatments for patients with chemorefractory acute myeloid leukemia. Cancer Discov 2013;3:1416–29. [DOI] [PubMed] [Google Scholar]
- 8.Khin ZP, Ribeiro ML, Jacobson T, Hazlehurst L, Perez L, Baz R, et al. A preclinical assay for chemosensitivity in multiple myeloma. Cancer Res 2014;74:56–67. [DOI] [PMC free article] [PubMed] [Google Scholar]
- 9.Meads MB, Gatenby RA, Dalton WS. Environment-mediated drug resistance: a major contributor to minimal residual disease. Nat Rev Cancer 2009;9:665–74. [DOI] [PubMed] [Google Scholar]
- 10.Stewart AK, Rajkumar SV, Dimopoulos MA, Masszi T, Spicka I, Oriol A, et al. Carfilzomib, lenalidomide, and dexamethasone for relapsed multiple myeloma. N Engl J Med 2015;372:142–52. [DOI] [PubMed] [Google Scholar]
- 11.Ghobrial IM, Weller E, Vij R, Munshi NC, Banwait R, Bagshaw M, et al. Weekly bortezomib in combination with temsirolimus in relapsed or relapsed and refractory multiple myeloma: a multicentre, phase 1/2, open-label, dose-escalation study. Lancet Oncol 2011;12:263–72. [DOI] [PubMed] [Google Scholar]
- 12.Andrulis M, Lehners N, Capper D, Penzel R, Heining C, Huellein J, et al. Targeting the BRAF V600E mutation in multiple myeloma. Cancer Discov 2013;3:862–9. [DOI] [PubMed] [Google Scholar]
- 13.Zhao X, Lwin T, Silva A, Shah B, Tao J, Fang B, et al. Unification of de novo and acquired ibrutinib resistance in mantle cell lymphoma. Nat Commun In press. [DOI] [PMC free article] [PubMed] [Google Scholar]
- 14.Yaccoby S, Barlogie B, Epstein J. Primary myeloma cells growing in SCID-hu mice: a model for studying the biology and treatment of myeloma and its manifestations. Blood 1998;92:2908–13. [PubMed] [Google Scholar]
- 15.Das R, Strowig T, Verma R, Koduru S, Hafemann A, Hopf S, et al. Microenvironment-dependent growth of preneoplastic and malignant plasma cells in humanized mice. Nat Med 2016;22:1351–7. [DOI] [PMC free article] [PubMed] [Google Scholar]
- 16.Silva A, Jacobson T, Meads M, Distler A, Shain K. An Organotypic High Throughput System for Characterization of Drug Sensitivity of Primary Multiple Myeloma Cells. J Vis Exp 2015;e53070. [DOI] [PMC free article] [PubMed] [Google Scholar]
- 17.Najar M, Rouas R, Raicevic G, Boufker HI, Lewalle P, Meuleman N, et al. Mesenchymal stromal cells promote or suppress the proliferation of T lymphocytes from cord blood and peripheral blood: the importance of low cell ratio and role of interleukin-6. Cytotherapy 2009;11:570–83. [DOI] [PubMed] [Google Scholar]
- 18.Wang Z, Yang J, Kirk C, Fang Y, Alsina M, Badros A, et al. Clinical pharmacokinetics, metabolism, and drug-drug interaction of carfilzomib. Drug Metab Dispos 2013;41:230–7. [DOI] [PubMed] [Google Scholar]
- 19.Collins GS, Reitsma JB, Altman DG, Moons KG. Transparent Reporting of a multivariable prediction model for Individual Prognosis or Diagnosis (TRIPOD): the TRIPOD statement. Ann Intern Med 2015;162:55–63. [DOI] [PubMed] [Google Scholar]
- 20.Reece DE, Sullivan D, Lonial S, Mohrbacher AF, Chatta G, Shustik C, et al. Pharmacokinetic and pharmacodynamic study of two doses of bortezomib in patients with relapsed multiple myeloma. Cancer Chemother Pharmacol 2011;67:57–67. [DOI] [PMC free article] [PubMed] [Google Scholar]
- 21.Berenson JR, Cartmell A, Bessudo A, Lyons RM, Harb W, Tzachanis D, et al. CHAMPION-1: a phase 1/2 study of once-weekly carfilzomib and dexamethasone for relapsed or refractory multiple myeloma. Blood 2016;127:3360–8. [DOI] [PMC free article] [PubMed] [Google Scholar]
- 22.Aljitawi OS, Ganguly S, Abhyankar SH, Ferree M, Marks R, Pipkin JD, et al. Phase IIa cross-over study of propylene glycol-free melphalan (LGD-353) and alkeran in multiple myeloma autologous transplantation. Bone Marrow Transplant 2014;49:1042–5. [DOI] [PubMed] [Google Scholar]
- 23.Pisano C, Cecere SC, Di Napoli M, Cavaliere C, Tambaro R, Facchini G, et al. Clinical trials with pegylated liposomal Doxorubicin in the treatment of ovarian cancer. J Drug Deliv 2013;2013:898146. [DOI] [PMC free article] [PubMed] [Google Scholar]
- 24.Harousseau JL, Avet-Loiseau H, Attal M, Marit G, Caillot D, Hulin C, et al. High Complete and Very Good Partial Response Rates with Bortezomib-Dexamethasone as Induction Prior to ASCT in Newly Diagnosed Patients with High-Risk Myeloma: Results of the IFM2005–01 Phase 3 Trial. Blood 2009;114:149–50. [Google Scholar]
- 25.Richardson PG, Weller E, Lonial S, Jakubowiak AJ, Jagannath S, Raje NS, et al. Lenalidomide, bortezomib, and dexamethasone combination therapy in patients with newly diagnosed multiple myeloma. Blood 2010;116:679–86. [DOI] [PMC free article] [PubMed] [Google Scholar]
- 26.Li Y, Xu Y, Liu L, Wang X, Palmisano M, Zhou S. Population pharmacokinetics of pomalidomide. J Clin Pharmacol 2015;55:563–72. [DOI] [PMC free article] [PubMed] [Google Scholar]
- 27.Kumar S, Paiva B, Anderson KC, Durie B, Landgren O, Moreau P, et al. International Myeloma Working Group consensus criteria for response and minimal residual disease assessment in multiple myeloma. Lancet Oncol 2016;17:e328–46. [DOI] [PubMed] [Google Scholar]
- 28.Chng WJ, Dispenzieri A, Chim CS, Fonseca R, Goldschmidt H, Lentzsch S, et al. IMWG consensus on risk stratification in multiple myeloma. Leukemia 2013. [DOI] [PubMed] [Google Scholar]
- 29.Richardson PG, Schlossman RL, Alsina M, Weber DM, Coutre SE, Gasparetto C, et al. PANORAMA 2: panobinostat in combination with bortezomib and dexamethasone in patients with relapsed and bortezomib-refractory myeloma. Blood 2013;122:2331–7. [DOI] [PubMed] [Google Scholar]
- 30.Gatenby RA, Brown J, Vincent T. Lessons from applied ecology: cancer control using an evolutionary double bind. Cancer Res 2009;69:7499–502. [DOI] [PubMed] [Google Scholar]
- 31.Morstyn G, Schechter GP, Ihde DC, Carney DN, Eddy JL, Cohen MH, et al. Therapy for multiple myeloma with alternating non-cross-resistant chemotherapy combinations: heterogeneity of tumor responsiveness. Cancer Treat Rep 1984;68:1439–46. [PubMed] [Google Scholar]
- 32.Mateos MV, Martinez-Lopez J, Hernandez MT, Ocio EM, Rosinol L, Martinez R, et al. Sequential vs alternating administration of VMP and Rd in elderly patients with newly diagnosed MM. Blood 2016;127:420–5. [DOI] [PubMed] [Google Scholar]
- 33.McMillin DW, Delmore J, Negri J, Ooi M, Klippel S, Miduturu CV, et al. Microenvironmental influence on pre-clinical activity of polo-like kinase inhibition in multiple myeloma: implications for clinical translation. PLoS One 2011;6:e20226. [DOI] [PMC free article] [PubMed] [Google Scholar]
- 34.Dimopoulos MA, Moreau P, Palumbo A, Joshua D, Pour L, Hajek R, et al. Carfilzomib and dexamethasone versus bortezomib and dexamethasone for patients with relapsed or refractory multiple myeloma (ENDEAVOR): a randomised, phase 3, open-label, multicentre study. Lancet Oncol 2016;17:27–38. [DOI] [PubMed] [Google Scholar]
- 35.Vogl DT, Raje NS, Jagannath S, Richardson PG, Hari P, Orlowski RZ, et al. Ricolinostat, the first selective histone deacetylase 6 inhibitor, in combination with bortezomib and dexamethasone for relapsed or refractory multiple myeloma. Clin Cancer Res 2017. [DOI] [PMC free article] [PubMed] [Google Scholar]
- 36.Rajan AM, Kumar S. New investigational drugs with single-agent activity in multiple myeloma. Blood Cancer J 2016;6:e451. [DOI] [PMC free article] [PubMed] [Google Scholar]
- 37.Majumder B, Baraneedharan U, Thiyagarajan S, Radhakrishnan P, Narasimhan H, Dhandapani M, et al. Predicting clinical response to anticancer drugs using an ex vivo platform that captures tumour heterogeneity. Nat Commun 2015;6:6169. [DOI] [PMC free article] [PubMed] [Google Scholar]
- 38.Durie BG, Jacobson J, Barlogie B, Crowley J. Magnitude of response with myeloma frontline therapy does not predict outcome: importance of time to progression in southwest oncology group chemotherapy trials. J Clin Oncol 2004;22:1857–63. [DOI] [PubMed] [Google Scholar]
- 39.Puga A, Wallace KB. Molecular biology of the toxic response. Philadelphia, PA: Taylor & Francis; 1999. [Google Scholar]
- 40.Amin SB, Yip WK, Minvielle S, Broyl A, Li Y, Hanlon B, et al. Gene expression profile alone is inadequate in predicting complete response in multiple myeloma. Leukemia 2014;28:2229–34. [DOI] [PMC free article] [PubMed] [Google Scholar]
- 41.Scott J. Phase i trialist. The Lancet Oncology 2012;13:236. [DOI] [PubMed] [Google Scholar]
- 42.Catenacci DV. Next-generation clinical trials: Novel strategies to address the challenge of tumor molecular heterogeneity. Mol Oncol 2015;9:967–96. [DOI] [PMC free article] [PubMed] [Google Scholar]
- 43.Greaves M. Evolutionary Determinants of Cancer. Cancer Discov 2015;5:806–20. [DOI] [PMC free article] [PubMed] [Google Scholar]
- 44.Gatenby RA, Silva AS, Gillies RJ, Frieden BR. Adaptive therapy. Cancer Res 2009;69:4894–903. [DOI] [PMC free article] [PubMed] [Google Scholar]
- 45.Das Thakur M, Salangsang F, Landman AS, Sellers WR, Pryer NK, Levesque MP, et al. Modelling vemurafenib resistance in melanoma reveals a strategy to forestall drug resistance. Nature 2013;494:251–5. [DOI] [PMC free article] [PubMed] [Google Scholar]
- 46.Silva AS, Kam Y, Khin ZP, Minton SE, Gillies RJ, Gatenby RA. Evolutionary approaches to prolong progression-free survival in breast cancer. Cancer Res 2012;72:6362–70. [DOI] [PMC free article] [PubMed] [Google Scholar]
- 47.Yankeelov TE, Quaranta V, Evans KJ, Rericha EC. Toward a science of tumor forecasting for clinical oncology. Cancer Res 2015;75:918–23. [DOI] [PMC free article] [PubMed] [Google Scholar]
- 48.Silva A, Durand S, Ribeiro M, Alsina M, Shain K, Baz R. An Evolutionary Approach for Personalized Therapy in Multiple Myeloma. Appl Math (Irvine) 2016;7. [Google Scholar]
- 49.Kronke J, Udeshi ND, Narla A, Grauman P, Hurst SN, McConkey M, et al. Lenalidomide causes selective degradation of IKZF1 and IKZF3 in multiple myeloma cells. Science 2014;343:301–5. [DOI] [PMC free article] [PubMed] [Google Scholar]
- 50.Jelinek T, Hajek R. Monoclonal antibodies - A new era in the treatment of multiple myeloma. Blood Rev 2016;30:101–10. [DOI] [PubMed] [Google Scholar]
Associated Data
This section collects any data citations, data availability statements, or supplementary materials included in this article.