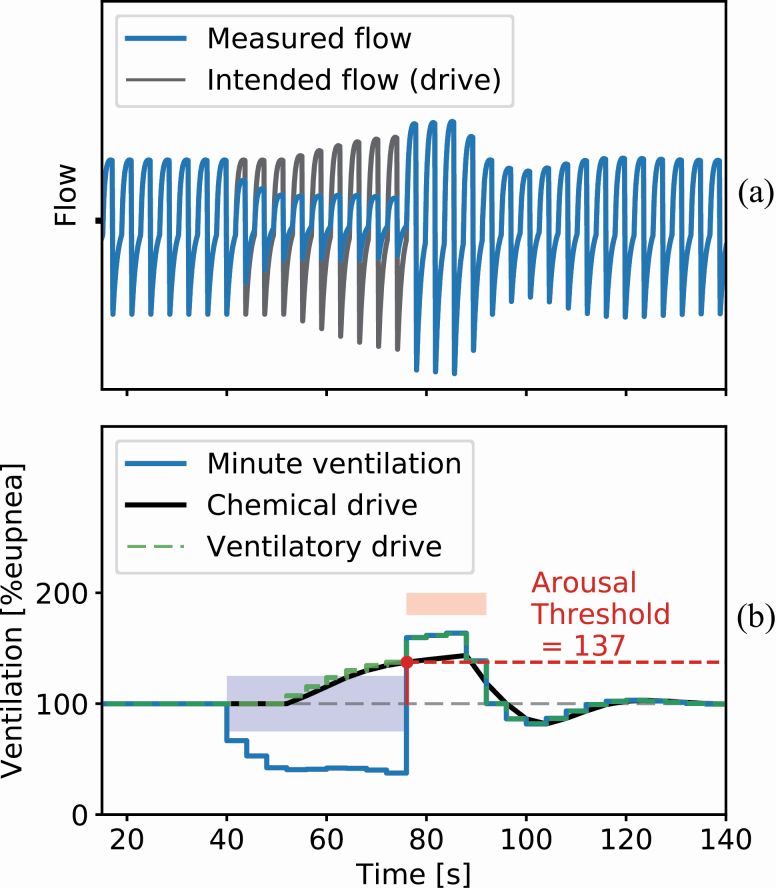
Figure 1.
A simulated hypopnea for illustrating key concepts of the model underlying the endo- PUP method. (A) The blue trace shows the simulated flow during a hypopnea event and the black trace shows a simulation of the flow that the chemical drive would result in if there were no obstruction (intended flow). The hypopnea starts at around 40 s where the airflow is reduced. As the flow decreases the chemical drive increases, attempting to compensate for the reduced ventilation. The hypopnea terminates at the 75-s mark in an arousal, opening the airway. The buildup of intended flow results in large recovery breaths before stabilizing at eupnea. (B) The ventilation during the simulated hypopnea in (A). The hypopnea event, labeled by the blue square, terminates in an arousal, labeled by the red square. The blue trace shows the change in ventilation, calculated from the simulated flow signal in (A). The black and green traces show the chemical and ventilatory drives, respectively. Due to the blood circulatory delay, the drive only starts increasing 12 s after the ventilation is reduced and similarly continues to build up 12 s into the recovery period. The chemical drive is the V̇chem from equation (1) and the ventilatory drive is V̇chem plus an added drive contribution during the arousal (wakefulness drive, ϒ), simulated here as 20% eupnea. The arousal threshold can be read directly from the chemical drive estimate as the drive at arousal onset.

