

Abstract
Outbreaks of foodborne illnesses linked to fresh fruits and vegetables have been key drivers behind a wide breadth of research aiming to fill data gaps in our understanding of the total ecology of agricultural water sources such as ponds and wells and the relationship of this ecology to foodborne pathogens such as Salmonella enterica and Listeria monocytogenes. Both S. enterica and L. monocytogenes can persist in irrigation water and have been linked to produce contamination events. Data describing the abundance of these organisms in specific agricultural water sources are valuable to guide water treatment measures. Here, we profiled the culture independent water microbiota of four farm ponds and wells correlated with microbiological recovery of S. enterica (prevalence: pond, 19.4%; well, 3.3%), L. monocytogenes (pond, 27.1%; well, 4.2%) and fecal indicator testing. Correlation between abiotic factors, including water parameters (temperature, pH, conductivity, dissolved oxygen percentage, oxidation reduction potential, and turbidity) and weather (temperature and rainfall), and foodborne pathogens were also evaluated. Although abiotic factors did not correlate with recovery of S. enterica or L. monocytogenes (p > 0.05), fecal indicators were positively correlated with incidence of S. enterica in well water. Bacterial taxa such as Sphingomonadaceae and Hymenobacter were positively correlated with the prevalence and population of S. enterica, and recovery of L. monocytogenes was positively correlated with the abundance of Rhizobacter and Comamonadaceae (p < 0.03). These data will support evolving mitigation strategies to reduce the risk of produce contamination by foodborne pathogens through irrigation.
Keywords: bacterial communities, ABIOTIC factors, irrigation water, Listeria monocytogenes, Salmonella
Introduction
Fresh produce is increasingly recognized as a common vehicle for transmission of foodborne pathogens (Brandl, 2006; Franz and van Bruggen, 2008; Nuesch-Inderbinen and Stephan, 2016; Carstens et al., 2019). Ranked in the top five pathogens contributing to illnesses, hospitalizations, or deaths in the United States during outbreaks of foodborne diseases, Salmonella enterica spp. and Listeria monocytogenes are considered to be common foodborne pathogens associated with fresh produce (CDC, 2018). Consumption of S. enterica contaminated produce has led to several multistate and international outbreaks in recent years (CDC, 2005, 2007; Greene et al., 2008; Bennett et al., 2015). L. monocytogenes was responsible for a 2011 produce-borne outbreak in the United States, with 147 illnesses, 33 deaths, and 1 miscarriage, due to consumption of cantaloupe (CDC, 2012). In addition, a considerable number of produce recalls have occurred in the past years as a result of contamination by the two pathogens (FDA, 2007-2017).
Irrigation water may play an important role in contaminating vegetables and fruits with foodborne pathogens (Solomon et al., 2002; Islam et al., 2004; Hintz et al., 2010; Oliveira et al., 2011; Weller et al., 2015). Agricultural water can be contaminated via sewage overflows, polluted storm water runoff, and agricultural runoff. The 2005 multistate S. enterica Newport outbreak associated with tomato was reported to be related to contaminated irrigation water (CDC, 2007). After irrigation with contaminated water, the bacteria can adhere to plants, enter into plants, and translocate within infested plants. These pathogens would be difficult to be completely removed during typical washing and disinfection procedures and may persist and multiply at any point along with the farm-to-fork continuum from production to consumption (Solomon et al., 2002; Franz and van Bruggen, 2008; Miles et al., 2009; Barak et al., 2011; Gu et al., 2011, 2013c; Zheng et al., 2013). Therefore, minimizing the risk of contamination by human bacterial pathogens during the pre-harvest period is essential to reducing foodborne illness risks.
Fecal pollution, including S. enterica spp. and L. monocytogenes, is traditionally evaluated with fecal indicator bacteria like fecal coliforms and generic Escherichia coli (EPA, 2002). Contradictory results have been reported as to the correlation between indicator organisms and the occurrence of human pathogens in surface water (Burton et al., 1987; Rhodes and Kator, 1988; Chandran and Hatha, 2005; Ahmed et al., 2009; Chandran et al., 2011; Benjamin et al., 2013; Gu et al., 2013a; McEgan et al., 2013). Chigor et al. (2010) reported that some environmental factors, including water turbidity and concentrations of nitrate, phosphate, and chloride, were positively correlated with the population of fecal coliforms in a river used for fresh produce irrigation in Nigeria. A former study evaluating irrigation ponds in Georgia showed positive correlation between temperature, rainfall, populations of fecal coliform, and culturable bacteria and the occurrence of E. coli O157, and a negative relationship between the total nitrogen concentration, oxidation reduction potential (ORP), and dissolved oxygen concentration and the occurrence of this pathogen (p < 0.05; Gu et al., 2013a). Another survey conducted in central Florida presented different results on the relationship of environmental factors to the prevalence of S. enterica in surface water (McEgan et al., 2013). These studies showed regional differences for the prevalence of detected foodborne pathogens and the efficacy of indicators to predict the prevalence of the pathogens (Ahmed et al., 2009; Benjamin et al., 2013; Gu et al., 2013a; McEgan et al., 2013). It is necessary to evaluate and validate the efficacy of biological index organisms and physicochemical indicators on the prediction of foodborne pathogen contamination in major agricultural regions in the United States. Furthermore, previous studies about the impacts of bacterial communities on the prevalence of foodborne pathogens in irrigation ponds showed the probability of identifying alternative indicator microorganisms to economically and reliably predict the presence or absence of foodborne pathogens in irrigation water and the on-farm agricultural environment (Gu et al., 2013a,b).
In this study, the correlation between foodborne pathogens, S. enterica and L. monocytogenes, and contextual factors, including water parameters, weather information, fecal indicators, and bacterial community, has been analyzed to identify suitable indicators and potential suppressors of foodborne pathogens in irrigation water.
Materials and Methods
Water Sample Collection
The study area is the Eastern Shore of Virginia (ESV), an important agricultural region in the United States including the top tomato production county in Virginia. From January to December 2015, 4 L of pond and well irrigation water samples were collected weekly from four vegetable farms (Farms A–D) on ESV for S. enterica spp. detection (Gu et al., 2019a). At one of the sampling times per month for S. enterica detection, 4-L water samples were also collected concurrently from the same irrigation ponds and wells for L. monocytogenes detection. Collected water samples were stored on ice in the field and transported to lab for further experiments. In total, 392 weekly pond and well irrigation water samples (2 water types × 4 farms × 49 weeks) were tested for S. enterica, and 96 monthly pond and well water samples (2 water types × 4 farms × 12 months) were collected for L. monocytogenes detection in this study (Figure 1).
Figure 1.
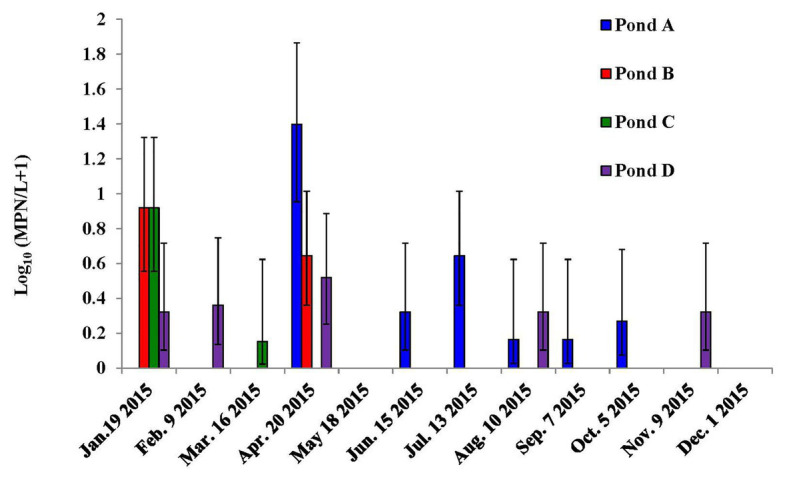
Dynamics of Listeria monocytogenes in the irrigation ponds of farms A–D on the Eastern Shore of Virginia (ESV). Bars represent 95% confidence intervals.
Water Parameter Measurements, Weather Information Collection, and Fecal Indicator Detection
During sampling, water samples were tested for temperature (°C), pH, pHmV, conductivity (S), dissolved oxygen percentage (%), dissolved oxygen charge, and oxidation reduction potential (ORP, mV) with an YSI® 6600 Multiparameter Sonde (Yellow Springs, OH) in the field. Water turbidity (nephelometric turbidity units, NTU) was tested using a HI98713 turbidity meter (Hanna instruments, Woonsocket, RI). MPN values (MPN/100 ml) of generic E. coli and coliforms were assayed using Colilert® (IDEXX Laboratories, Inc., Westbrook, ME) following the manufacturer’s instructions. A HOBO Micro Station (Onset Computer Corporation, Bourne, MA) was set up at each tested farm. Temperature (°C) and rainfall data (mm) 1 week prior to each sampling were collected for further analysis.
Salmonella enterica and Listeria monocytogenes Detection and Most Probable Number Analysis
A most probable number (MPN) method was used to assess S. enterica concentration in collected water samples as described previously (Luo et al., 2014; Gu et al., 2019a,b).
L. monocytogenes was quantified by the MPN method mentioned above with some modifications. In brief, water samples (500, 100, and 10 ml) were added to equal volumes of sterile buffered Listeria enrichment broth (BLEB, Becton, Dickinson and Company, Sparks, MD) at 2x concentration in quadruplicate and incubated at 30°C for 24 h. Fifty microliters of each enrichment were streaked onto Listeria monocytogenes plating medium (LMPM, R&F Laboratories 0550M, Downers Grove, IL) for 48 h at 35°C. Positive colonies (turquoise convex) were confirmed by a cross-streaking method using modified Oxford agar (MOX; Becton, Dickinson) and by PCR amplification of hlyA gene (Furrer et al., 1991). Up to four positive colonies per plate were stored in 20% glycerol in a −80°C freezer.
The experiments of this study were performed by following the biosafety standard operating protocols approved by the Institutional Biosafety Committee at Virginia Tech (Permit No.: IBC # 17–051).
Antimicrobial Susceptibility Test
Ninety-six well Sensititre™ Gram Negative NARMS Plates (Thermo Fisher Scientific, Waltham, MA) were used for antimicrobial susceptibility tests of selected S. enterica isolates according to the manufacturer’s instructions. Tested antibiotics included cefoxitin, azithromycin, chloramphenicol, tetracycline, ceftriaxone, amoxicillin/clavulanic acid 2:1 ratio, ciprofloxacin, gentamicin, nalidixic acid, ceftiofur, sulfisoxazole, trimethoprim/sulfamethoxazole, ampicillin, streptomycin, and streptomycin. Results were interpreted and antibiotic-resistant strains were defined according to the National Committee for Clinical and Laboratory Standards criteria (National Committee for Clinical Laboratory Standards, 2010).
16S rDNA High-Throughput Sequencing and Sequence Analysis
Water samples collected for both S. enterica and L. monocytogenes detection were selected for DNA extraction and subsequent 16S rDNA high-throughput sequencing analysis (4 farms × 2 water types (pond and well) × 12 months = 96). Two-hundred milliliters of each representative water sample was vacuum filtered through a 0.22 μm sterile nitrocellulose membrane (Millipore Corporation, Billerica, MA). Genomic DNA of bacteria captured by the membranes was extracted using a PowerWater® DNA Isolation Kit (MOBIO Laboratories, Inc., Carlsbad, CA) and stored at −80°C until use. Diversity of bacterial community, as well as abundance of bacterial species in water samples, was analyzed by 16S PCR amplicon sequencing using a Miseq Next Generation Sequencer (Illumina). Raw 16S rDNA amplicon sequences were trimmed for quality using Trimmomatic v0.32 and high-quality read pairs were merged using the FLASH tool. High-quality R1 reads that did not merge (due to a low quality R2 pair) were also included in downstream analysis. Final trimmed sequences were required to be at least 200 bp in length. During preprocessing, sequences were screened for PhiX contamination as well as chloroplast sequences using the RDP classifier trained on the GreenGenes 16S database.
Passing high-quality 16S rDNA sequences were analyzed using the Resphera Discovery protocol (RDP, Baltimore, MD). Briefly, sequences were clustered into operational taxonomic units using UCLUST (de novo) with a 97% identity threshold (Edgar, 2010). Representative members of each operational taxonomic unit (OTU) were assigned a consensus taxonomic lineage using the RDP classifier trained on the Resphera Discovery 16S database (minimum confidence 80%). Prior to downstream comparative analysis, samples were rarefied to 10,000 sequences per sample. Taxonomic abundance profiles and assignments were also classified using Kraken 2 classification tool (Wood and Salzberg, 2014) and Bracken abundance estimator (Lu et al., 2017), with the SILVA database (Quast et al., 2013).
Statistical Analysis
With MPN analysis, a value of zero was given to any samples under the lower limit of detection. Upper limit values were given to any samples over the upper detection limit. Salmonella enterica and Listeria monocytogenes MPN values in pond and well irrigation water were log transformed using the formula log10(MPN + 1) to present the dynamics of population density for normalization. The log-transformed values were used for the following statistical analyses. Biserial correlation coefficients were calculated to evaluate the correlations between the environmental factors (water and weather parameters) and the occurrence of S. enterica (n = 396) or L. monocytogenes (n = 96) isolated from irrigation water (pond and well), and Pearson’s correlation coefficients were calculated to evaluate the correlations between the environmental factors and S. enterica or L. monocytogenes population density (Portney and Watkins, 2009). To analyze the correlation between foodborne pathogens and bacterial community in irrigation water samples, monthly S. enterica contamination prevalence and population density were chosen based on the selected sampling points used for both foodborne pathogen testing and sequencing (n = 96). Alpha diversity was evaluated for each sample using the Chao1 estimator (Chao, 1984) and Faith’s phylogenetic diversity (PD; Faith, 1992). Beta-diversity analysis was performed by Principal coordinates analysis (PCoA). The Mann-Whitney test was used for differential abundance analysis.
Statistical analysis was performed using SAS (SAS release 9.3, SAS Institute Inc., Cary, North Carolina). Except when stated otherwise, p < 0.05 were considered as statistically significant.
Results
Dynamics and Antimicrobial Resistance of Salmonella enterica in Irrigation Pond and Well Water
In our previous study, the prevalence and population density of S. enterica in irrigation tested ponds and wells were reported (Gu et al., 2019a).
In this study, all the S. enterica isolates collected from irrigation ponds in the previous study (Gu et al., 2019a) were further subjected to antimicrobial susceptibility test. Among the 270 S. enterica isolates, 12 isolates were identified to be resistant to at least one of the tested antibiotics, including four Thompson isolates resistant to ceftiofur or tetracycline, three Typhimurium isolates resistant to streptomycin, tetracycline, or amoxicillin/clavulanic acid 2:1 ratio, two Saintpaul isolates resistant to ceftriaxone or ciprofloxacin, two Newport isolates resistant to ceftriaxone or cefoxitin and amoxicillin/clavulanic acid 2:1 ratio, and one Larochelle isolate resistant to cefoxitin. All the identified well water isolates (n = 24) were sensitive to tested antibiotics.
Listeria monocytogenes Prevalence and Population Density in Irrigation Pond and Well Water
Differences in L. monocytogenes occurrence were observed among ponds (Figure 1). The prevalence of L. monocytogenes in the four tested ponds of farms A, B, C, and D were 16.7, 25, 33.3, and 33.3%, respectively. The average MPN values of L. monocytogenes in the four ponds during the study were 0.93, 0.22, 1.66, and 6.44 MPN/L, respectively. For well water samples, L. monocytogenes was only isolated from Farm D in April (24 MPN/L, 95% confidence interval: 8 MPN/L – 72 MPN/L) and October (0.46 MPN/L, 0.07 MPN/L – 3.2 MPN/L).
Correlation Between Foodborne Pathogens and Environmental Factors in Irrigation Water
There was no significant correlation between most water parameters and S. enterica occurrence in the tested ponds and wells (Tables 1 and 2; Figure 1 and Supplementary Figure S1), but S. enterica population in pond irrigation water was positively correlated with water pH (p = 0.038, Table 1). However, the significant correlation was mainly contributed by pond D (p < 0.01). Water pH was not significantly correlated with S. enterica MPN values in ponds A–C (p > 0.05). No significant correlations were identified between tested weather parameters (mean temperature and total rainfall) and S. enterica prevalence and levels in this study.
Table 1.
Correlation between environmental factors and Salmonella enterica spp. in irrigation ponds on the Eastern Shore of Virginia (n = 196).
| Contextual factors | Pearson’s correlation coefficients to Salmonella enterica population density [log(MPN +1)] | px | Biserial correlation coefficients to Salmonella enterica prevalence | py |
|---|---|---|---|---|
| Tma | −0.007609538 | 0.91581 | −0.034733071 | 0.62921 |
| Conductivityb | −0.05719309 | 0.42665 | −0.070175698 | 0.32891 |
| DO percentagec | −0.04707085 | 0.51301 | −0.066731859 | 0.35296 |
| DO charged | 0.02336483 | 0.74519 | 0.00950965 | 0.89486 |
| pHe | −0.148123873 | 0.03831 | −0.13314992 | 0.06292 |
| pHmVf | 0.057121028 | 0.42649 | 0.005718715 | 0.93669 |
| ORPg | −0.004021127 | 0.95563 | −0.010955773 | 0.87948 |
| Turbidityh | 0.05239285 | 0.46584 | −0.055239594 | 0.44222 |
| Mean Tmi | −0.005098195 | 0.94455 | −0.054947192 | 0.44471 |
| Total Rfj | −0.055691718 | 0.43892 | −0.119869831 | 0.09443 |
| Coliformk | 0.007890593 | 0.91261 | 0.007657521 | 0.91525 |
| Generic E. colil | 0.005742038 | 0.93636 | 0.019552346 | 0.78564 |
Factors significantly correlated to Listeria monocytogenes population density or prevalence are in bold.
Temperature (°C) of the pond water during sampling.
Conductivity of water samples (S).
Dissolved oxygen percentage (%).
Dissolved oxygen charge.
pH value of water samples [measured in standard units (S.U.)].
pH value of water samples pH measured in millivolts (mV).
Oxidation-reduction potential (mV).
Turbidity of water samples (NTU, nephelometric turbidity units).
Mean temperature (°C) in the pond region in the last week before sampling.
Total rainfall (mm) in the pond region in the last week before sampling.
Population of coliforms (CFU/100 ml).
Population of generic E. coli (CFU/100 ml).
Value of p of Pearson’s correlation coefficients.
Value of p value of biserial correlation coefficients.
Table 2.
Correlation between environmental factors and Salmonella enterica spp. in irrigation wells on the Eastern Shore of Virginia (n = 196).
| Contextual factors | Pearson’s correlation coefficients to Salmonella enterica population density [log(MPN +1)] | px | Biserial correlation coefficients to Salmonella enterica prevalence | py |
|---|---|---|---|---|
| Tma | −0.01691986 | 0.81413 | −0.016205128 | 0.82169 |
| Conductivityb | 0.029190047 | 0.68465 | 0.037865224 | 0.59831 |
| DO percentagec | −0.007406088 | 0.91801 | −0.023832794 | 0.74056 |
| DO charged | −0.022610532 | 0.75321 | −0.003246387 | 0.96449 |
| pHe | −0.046222454 | 0.52022 | −0.001031583 | 0.98891 |
| pHmVf | 0.029323838 | 0.68332 | −0.007251536 | 0.92022 |
| ORPg | 0.058536029 | 0.41514 | 0.021279195 | 0.76729 |
| Turbidityh | −0.010322127 | 0.88607 | −0.032656483 | 0.65012 |
| Mean Tmi | −0.020535885 | 0.77549 | 0.029568995 | 0.68087 |
| Total Rfj | 0.107148143 | 0.13501 | 0.036488403 | 0.61172 |
| Coliformk | 0.176633637 | 0.01327 | 0.205555488 | 0.00385 |
| Generic E. colil | 0.210690813 | 0.00304 | 0.137615375 | 0.05443 |
Factors significantly correlated to Listeria monocytogenes population density or prevalence are in bold.
Temperature (°C) of the pond water during sampling.
Conductivity of water samples (S).
Dissolved oxygen percentage (%).
Dissolved oxygen charge.
pH value of water samples [measured in standard units (S.U.)].
pH value of water samples pH measured in millivolts (mV).
Oxidation-reduction potential (mV).
Turbidity of water samples (NTU, nephelometric turbidity units).
Mean temperature (°C) in the pond region in the last week before sampling.
Total rainfall (mm) in the pond region in the last week before sampling.
Population of coliforms (CFU/100 ml).
Population of generic E. coli (CFU/100 ml).
Value of p value of Pearson’s correlation coefficients.
Value of p value of biserial correlation coefficients.
Population of fecal indicators including coliforms and generic E. coli in irrigation pond and well water samples were examined during the study (Figures 2A–D). Population density of coliforms in most pond water samples exceeded the maximum detection limit (2419.6 MPN/100 ml; Figure 2A). There were no significant correlations between fecal indicators and the prevalence of S. enterica spp. in irrigation ponds (Table 1). However, coliform population was positively correlated with S. enterica prevalence and population densities in well water (Table 2). Similarly, the concentration of generic E. coli was also significantly positively correlated with S. enterica levels in well water (p < 0.01). The correlation between generic E. coli and S. enterica prevalence in wells is relatively significant (p = 0.05443). It is worthy to note that the significant correlation between fecal indicators and S. enterica was mainly due to the high correlation present in well water of farm D (p < 0.01).
Figure 2.

Dynamics of fecal indicators, coliform and generic E. coli, in the irrigation water of farms A–D on the ESV. (A) Most possible number (MPN) values of coliform in four tested irrigation ponds on ESV in 2015; (B) MPN values of generic E. coli in four tested irrigation ponds on ESV in 2015; and (C) MPN values of coliform in four tested irrigation wells on ESV in 2015; and (D) MPN values of generic E. coli in four tested irrigation wells on ESV in 2015.
The geometric means of generic E. coli in ponds A–D and wells A–D in the sampling period (in total of 49 samples in each water source) were 22.5, 6.3, 8.8, 5.7, 1.1, 1, 1.2, and 1.3 MPN/100 ml, respectively. The statistical threshold values of generic E. coli in ponds A–D and wells A–D in the sampling period (in total of 49 samples each) were 770, 62, 681, 28.7, 2.3, 0, 71.8, and 18.4 MPN/100 ml, respectively.
No environmental factors and fecal indicators measured in this study were significantly correlated to L. monocytogenes population and prevalence in irrigation ponds (Table 3). L. monocytogenes was only isolated from well D, which had a significant positive correlation with water turbidity (Table 4).
Table 3.
Correlation between environmental factors and Listeria monocytogenes in irrigation ponds on ESV (n = 48).
| Contextual factors | Pearson’s correlation coefficients to Listeria monocytogenes population density [log(MPN +1)] | px | Biserial correlation coefficients to Listeria monocytogenes prevalence | py |
|---|---|---|---|---|
| Tma | −0.156916356 | 0.28688 | −0.106512726 | 0.47124 |
| Conductivityb | −0.006836878 | 0.96341 | 0.213382481 | 0.14534 |
| DO percentagec | 0.002466153 | 0.98676 | 0.078838887 | 0.59432 |
| DO charged | 0.06095121 | 0.68069 | 0.218988495 | 0.13482 |
| pHe | 0.069182978 | 0.64034 | 0.105586622 | 0.47511 |
| pHmVf | −0.111864227 | 0.44933 | −0.176437183 | 0.23039 |
| ORPg | 0.164771709 | 0.26308 | 0.130927857 | 0.37511 |
| Turbidityh | −0.110702399 | 0.45383 | −0.118182688 | 0.42403 |
| Mean Tmi | −0.218220547 | 0.13625 | −0.16520481 | 0.26182 |
| Total Rfj | −0.022657725 | 0.87882 | −0.219150669 | 0.13461 |
| Coliformk | −0.20828325 | 0.15559 | −0.169018948 | 0.25085 |
| Generic E. colil | 0.190283653 | 0.19518 | 0.254827787 | 0.08048 |
| Salmonella enterica population densityz | 0.238520512 | 0.10255 | −0.018594 | 0.90068 |
Temperature (°C) of the pond water during sampling.
Conductivity of water samples (S).
Dissolved oxygen percentage (%).
Dissolved oxygen charge.
pH value of water samples [measured in standard units (S.U.)].
pH value of water samples pH measured in millivolts (mV).
Oxidation-reduction potential (mV).
Turbidity of water samples (NTU, nephelometric turbidity units).
Mean temperature (°C) in the pond region in the last week before sampling.
Total rainfall (mm) in the pond region in the last week before sampling.
Population of coliforms (CFU/100 ml).
Population of generic E. coli (CFU/100 ml).
Value of p value of Pearson’s correlation coefficients.
Value of p value of biserial correlation coefficients.
Salmonella enterica population density [log(MPN + 1)].
Table 4.
Correlation between environmental factors and Listeria monocytogenes in irrigation well D on ESV (n = 12).
| Contextual factors | Pearson’s correlation coefficients to Listeria monocytogenes population density [log(MPN +1)] | px | Biserial correlation coefficients to Listeria monocytogenes prevalence | py |
|---|---|---|---|---|
| Tma | 0.073992 | 0.81924 | 0.381534 | 0.22105 |
| Conductivityb | 0.113721 | 0.72491 | −0.03904 | 0.90422 |
| DO percentagec | 0.034744 | 0.91464 | 0.039598 | 0.90278 |
| DO charged | −0.1599 | 0.61961 | −0.03243 | 0.92038 |
| pHe | 0.166137 | 0.60584 | 0.081467 | 0.80129 |
| pHmVf | −0.17156 | 0.59407 | −0.03148 | 0.92283 |
| ORPg | −0.45143 | 0.14075 | −0.15318 | 0.63476 |
| Turbidityh | −0.16751 | 0.60283 | 0.587402 | 0.04462 |
| Mean Tmi | −0.22321 | 0.48561 | 0.095717 | 0.76732 |
| Total Rfj | −0.11303 | 0.72659 | −0.11945 | 0.71168 |
| Coliformk | 0.043451 | 0.89334 | 0.104528 | 0.74649 |
| Generic E. colil | −0.10588 | 0.74348 | 0.454206 | 0.13799 |
Factors significantly correlated to Listeria monocytogenes population density or prevalence are in bold.
Temperature (°C) of the pond water during sampling.
Conductivity of water samples (S).
Dissolved oxygen percentage (%).
Dissolved oxygen charge.
pH value of water samples [measured in standard units (S.U.)].
pH value of water samples pH measured in millivolts (mV).
Oxidation-reduction potential (mV).
Turbidity of water samples (NTU, nephelometric turbidity units).
Mean temperature (°C) in the pond region in the last week before sampling.
Total rainfall (mm) in the pond region in the last week before sampling.
Population of coliforms (CFU/100 ml).
Population of generic E. coli (CFU/100 ml).
Value of p of Pearson’s correlation coefficients.
Value of p value of biserial correlation coefficients.
Bacterial Community in Irrigation Water and Relationship to Foodborne Pathogens
The 16S rDNA high throughput sequencing data have been submitted to NCBI with accession number PRJNA630202. Approximately 57,000 raw 16S rDNA gene sequences with read lengths above 200 bases were acquired for each tested water sample collected from irrigation ponds and wells on the ESV. These data were further culled using quality trimming methods described above to an average of 34,719 sequences per sample, with an average length of 269 bases for use in downstream analyses.
Alpha diversity (Simpson’s Reciprocal and Shannon index) of the bacterial community, represented by 16S rRNA gene amplicons using OTUs at 97% similarity, was significantly lower (Mann-Whitney test, p < 0.01) in well water samples compared to pond water samples. This trend continued regardless of whether the diversity was measured by observed OTUs (pond: 1415.18 ± 57.29 and well: 985.17 ± 54.09), phylogenetic diversity (whole tree, pond: 403.76 ± 13.75; well: 331.31 ± 4.54), and Chao1 (pond: 3640.51 ± 180.26 and well: 2004.24 ± 18.12). However, there was no significant difference regarding alpha diversity between water samples that tested positive or negative for S. enterica or L. monocytogenes (p > 0.05).
In general, the dominant bacterial phylum and classes in water samples from each water source and sampling time were not completely distinct from one another (Supplementary Figures S2–S5). The most abundant taxa (phylum) observed in water samples were members of Proteobacteria (51.98%), Bacteroidetes (12.89%), and Actinobacteria (9.38%).
The relative abundance of phyla Proteobacteria, Firmicutes, Spirochaetes, and Acidobacteria, was significantly higher in well water, while the relative abundance of Bacteroidetes, Acinobacteria, Cyanobacteria, Verrucomicrobia, and Planctomycetes, was higher in pond water samples (Supplementary Table S1). The higher level of proteobacteria in well water was contributed by higher abundance of classes beta-proteobacteria, gamma-proteobacteria, and delta-proteobacteria (Supplementary Table S2). The abundance of class Sphingobacteria and Flavobacteria (under phylum Bacteroidetes), and Actinobacteria (phylum Actinobacteria) was higher in pond water (Supplementary Table S2). The relative abundance of class Spirochetes and Deinococci increased from August to December in samples from both pond and well water (Supplementary Figure S5). The dynamics of abundant bacterial genera (>5%) in irrigation water showed obvious shift during sampling months and disparities among farms in the tested agricultural region (Figure 3). The top three genera in pond water were Flavobacterium (average relative abundance: 5.25%), Limnohabitans (3.35%), and hgcI clade (Actinobacteria, 2.98%) and Aquabacterium (7.43%), Dechloromonas (2.73%), and Sideroxydans (2.61%) in well water samples.
Figure 3.

Dynamics of abundant bacterial genera (>5%) in irrigation ponds and wells during the 12 sampling months from four tested farms A–D on the ESV (sequencing data were not available for well water in farm C from January to April due to inadequate bacterial DNA extracted from water samples).
Beta-diversity analysis was conducted based on Bray-Curtis distances and points were colored to present dominant factors associated with community composition (Figure 4). Based on the beta diversity analysis, we observed an effect of both water source and location. Water samples were clearly differentiated by source (pond or well). Certain well water samples were grouped by farm location, and some pond water samples were associated with sampling time. For example, among well samples, well D had a distinct community, while well A and well B were much closer in community composition. There was substantial overlap in composition among pond samples from all four locations. Nevertheless, samples that were positive and negative for foodborne pathogens (S. enterica and L. monocytogenes) could not be differentiated by the principle coordinate analysis.
Figure 4.
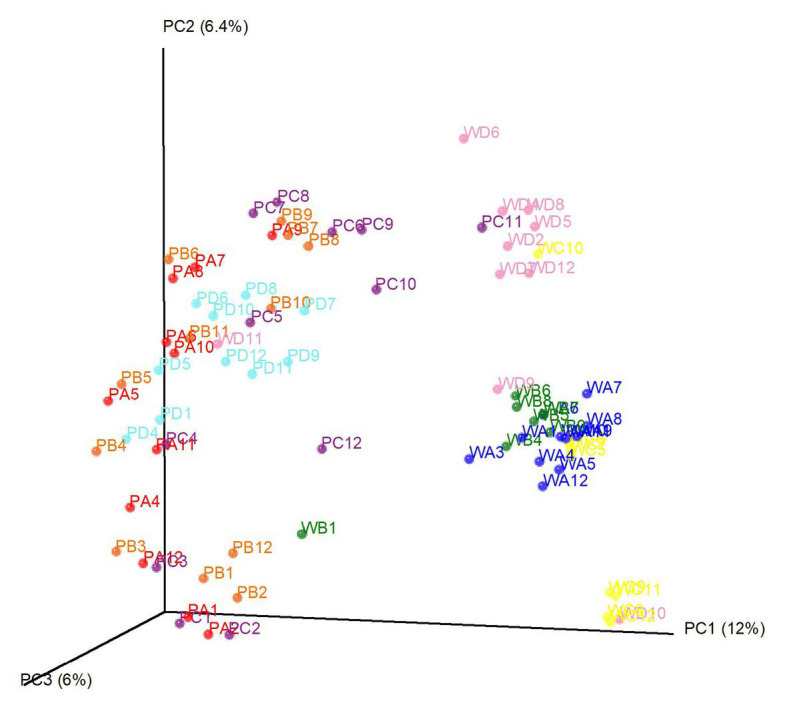
Principal coordinate analysis of the bacterial community in tested irrigation water samples. Each dot represents one water sample. Samples with the same color were collected from the same location. P denotes pond water and W denotes well water. Numbers behind denote sampling time (month).
Based on the taxonomic database, correlation analysis and a Mann-Whitney test were conducted to identify potential indicators for S. enterica and L. monocytogenes contamination in irrigation water (Tables 5 and 6; Figures 5, 6). Fourteen bacterial genera and one genus were identified to be positively and negatively, respectively, correlated with S. enterica prevalence (Table 5). Abundance of an unidentified genus of the family Sphingomonadaceae and the genus Hymenobacter were associated with S. enterica presence (significantly correlated to population density or prevalence). Six bacterial genera under Sphingomonadales were significantly correlated with S. enterica presence in tested irrigation ponds (Table 5). In addition, the relative abundance of Sphingomonadales was positively correlated with S. enterica contamination in irrigation ponds (prevalence: correlation coefficient: 0.411485, p: 0.00498199; population density: correlation coefficient: 0.521871, p: 0.00023638). The relative abundances of three genera in Sphingomonadaceae, Sphingomonadales, and Erythrobacteraceae were significantly higher in S. enterica positive well water samples, while levels of Fluviicola were significantly higher in S. enterica negative samples (Figure 5).
Table 5.
Bacterial genera (OTUs) significantly correlated with Salmonella enterica population density or prevalence in irrigation ponds on ESV.
| Correlated bacterial genera | Pearson’s correlation coefficients to Salmonella enterica population density [log(MPN +1)] | pa | Biserial correlation coefficients to Salmonella enterica prevalence | pb |
|---|---|---|---|---|
| Positive correlation (14) | ||||
| Unidentified genus of family Sphingomonadaceae * | 0.33762 | 0.02333 | 0.34553 | 0.02009 |
| Massilia | 0.65318 | 1.15E-06 | 0.23088 | 0.12705 |
| Sphingomonas* | 0.42304 | 0.00379 | 0.288 | 0.05506 |
| Sphingobium* | 0.53573 | 0.00015 | 0.19148 | 0.20768 |
| Unidentified genus of order Sphingomonadales* | 0.19304 | 0.20393 | 0.39733 | 0.00688 |
| Albidiferax | 0.31742 | 0.03362 | 0.20241 | 0.18238 |
| Arthrobacter | 0.6389 | 2.32E-06 | 0.21472 | 0.15665 |
| Unidentified genus of family Erythrobacteraceae* | 0.16355 | 0.28308 | 0.31016 | 0.03813 |
| Hymenobacter * | 0.33546 | 0.02428 | 0.32893 | 0.02737 |
| Actinomycetospora | 0.26588 | 0.07752 | 0.31714 | 0.03378 |
| Aeromicrobium | 0.53457 | 0.00016 | 0.28236 | 0.06022 |
| Azospirillum | 0.65787 | 9.10E-07 | 0.24851 | 0.09976 |
| Unidentified genus of family Intrasporangiaceae | 0.66274 | 7.10E-07 | 0.23321 | 0.12314 |
| Terrabacter | 0.63048 | 3.45E-06 | 0.2034 | 0.18021 |
| Negative correlation (1) | ||||
| Fluviicola | −0.2518 | 0.0952 | −0.3119 | 0.03706 |
Bacterial genera significantly correlated to both Salmonella enterica prevalence and population density are in bold.
Value of p of Biserial correlation coefficients.
Value of p of Pearson’s correlation coefficients.
Genera of order Sphingomonadales.
Table 6.
Bacterial genera (OTUs) significantly correlated with Listeria monocytogenes population density or prevalence in irrigation ponds on ESV.
| Correlated bacterial genera | Pearson’s correlation coefficients to Listeria monocytogenes population density [log(MPN +1)] | pa | Biserial correlation coefficients to Listeria monocytogenes prevalence | pb |
|---|---|---|---|---|
| Positive correlation (17) | ||||
| Unidentified genus of order Actinomycetales | 0.22673 | 0.13422 | 0.36147 | 0.0147 |
| Unidentified genus of family Comamonadaceae | 0.44855 | 0.002 | 0.33184 | 0.02596 |
| Unidentified genus of family Cytophagaceae | 0.21736 | 0.15151 | 0.3243 | 0.02975 |
| Unidentified genus of family Cryomorphaceae | −0.0093 | 0.95165 | 0.30592 | 0.04098 |
| Rhodobacter | 0.29894 | 0.04607 | 0.07472 | 0.62568 |
| Unidentified genus of family Oxalobacteraceae | 0.17013 | 0.26389 | 0.2985 | 0.0464 |
| Dechloromonas | 0.30048 | 0.04491 | 0.07457 | 0.62638 |
| Duganella | 0.35229 | 0.01763 | 0.23624 | 0.1182 |
| Sphaerotilus | 0.33639 | 0.02386 | 0.28097 | 0.06155 |
| Steroidobacter | 0.11674 | 0.44505 | 0.33585 | 0.0241 |
| Albidiferax | 0.62127 | 5.26E-06 | 0.20742 | 0.17159 |
| Pseudonocardia | 0.3769 | 0.01071 | 0.16942 | 0.26589 |
| Unidentified genus of order Chromatiales | 0.14719 | 0.33461 | 0.34928 | 0.01869 |
| Sulfuricurvum | 0.17689 | 0.24509 | 0.33468 | 0.02463 |
| Rhizobacter | 0.40636 | 0.00561 | 0.33248 | 0.02565 |
| Janthinobacterium | 0.40279 | 0.00609 | 0.24654 | 0.50285 |
| Unidentified genus of order Actinomycetales | 0.22673 | 0.13422 | 0.36147 | 0.0147 |
| Negative correlation (3) | ||||
| Lysobacter | −0.2116 | 0.1629 | −0.3385 | 0.02298 |
| Blastomonas | −0.2565 | 0.08911 | −0.3125 | 0.03668 |
| Unidentified genus of order Bacillales | −0.2901 | 0.05331 | −0.3671 | 0.01314 |
Bacterial genera significantly correlated to both Listeria monocytogenes prevalence and population density are in bold.
Value of p of Biserial correlation coefficients.
Value of p of Pearson’s correlation coefficients.
Figure 5.
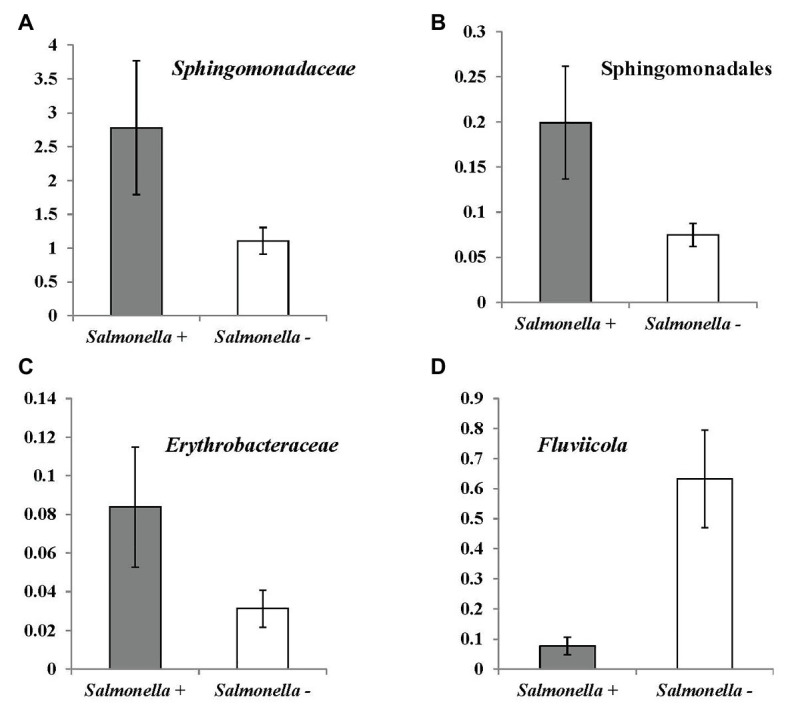
OTUs (at bacterial genus level) significantly correlated with Salmonella enterica prevalence in irrigation ponds by Mann-Whitney U test. (A) unidentified genus of family Sphingomonadaceae (p = 0.021); (B) unidentified genus of order Sphingomonadales (<0.007); (C) unidentified genus of family Erythrobacteraceae (0.038); and (D) Fluviicola (0.008).
Figure 6.

OTUs (at bacterial genus level) significantly correlated with Listeria monocytogenes prevalence in irrigation ponds by Mann-Whitney U test. (A) unidentified genus of order Actinomycetales (p = 0.022); (B) unidentified genus of family Comamonadaceae (p = 0.026); (C) Rhizobacter (p = 0.019); (D) Janthinobacterium (p = 0.029); (E) Lysobacter (p = 0.004); (F) Blastomonas (p = 0.01); and (G) unidentified genus of order Bacillales (p = 0.011). Lm denotes Listeria monocytogenes.
Seventeen and three bacterial genera were identified to be positively and negatively correlated with L. monocytogenes prevalence, respectively (Table 5). Abundance of an unidentified genus of the family Comamonadaceae, and the genus Rhizobacter was associated with presence of L. monocytogenes. The relative abundance of the bacterial order Burkholderiales was significantly correlated with L. monocytogenes population density in irrigation ponds (correlation coefficient: 0.3138, p: 0.03580419). Abundance of four bacterial genera, including an unidentified genus of order Actinomycetales, one genus in the family Comamonadaceae, and the genera Rhizobacter and Janthinobacterium were significantly higher in L. monocytogenes positive pond water samples (Figures 6A–D). Three genera, Lysobacter, Blastomonas, and one unidentified genus of the order Bacillales, were negatively correlated with L. monocytogenes prevalence and had significantly lower abundance in non-contaminated pond samples (Figures 6E–G).
Discussion
In previous study, the prevalence and dynamics of S. enterica in irrigation ponds and wells on the ESV was reported. Spatial (farm location) and temporal (weekly) differences for S. enterica occurrence in surface pond water was detected (Gu et al., 2019a). In this study, the prevalence and dynamics of L. monocytogenes in irrigation ponds and wells on the ESV was investigated. Antimicrobial susceptibility test was further performed on all the S. enterica isolates from previous study. Overall, all the ponds on the four studied farms tested positive for both foodborne pathogens at certain sampling points. S. enterica was isolated from three of the four wells, while L. monocytogenes was only detected from one sampled well during the study period. Antimicrobial resistant S. enterica was only identified from pond water samples, which may indicate a higher food safety risk of applying surface water for agricultural irrigation in this region. The average population densities of S. enterica and L. monocytogenes in tested water samples were lower than 2 log and 1 log MPN/L, respectively, but irrigation with naturally contaminated water might result in transmission of foodborne pathogens to fields (Gu et al., 2018). The results provide growers with baseline information on the risk of irrigation water being contaminated in this region. In this study, the correlation between S. enterica spp. and L. monocytogenes was further analyzed. Salmonella enterica MPN data from the selected weeks in which Listeria detection were conducted and used to compare the relationship of the two foodborne pathogens. In addition, the average S. enterica MPN/L of each month was calculated for comparison. However, neither the population of S. enterica per week nor average S. enterica values by month were correlated with L. monocytogenes prevalence in either pond or well water samples. Even though L. monocytogenes was detected in irrigation ponds and one well on the ESV, no listeriosis outbreaks and recalls have been traced back to this region. This might be explained by the low population of L. monocytogenes in irrigation water. Another hypothesis is that the agricultural and processing practices of food commodities produced in the tested area mitigate the survival or transmission rate of L. monocytogenes.
Correlation between foodborne pathogens (S. enterica spp. and L. monocytogenes) and contextual factors, including water parameters, weather information, and fecal indicators, was analyzed in this study. In contrast to a former study conducted in Georgia (Luo et al., 2016), no significant correlation between temperature and S. enterica prevalence was found in the tested irrigation ponds on the ESV. The low correlation coefficients (less than 0.15) between tested water parameters and foodborne pathogens in irrigation water indicate the weak potential of the tested physicochemical water characteristics as predictors in this region.
In agreement with multiple previous studies, fecal indicators were not significantly correlated with S. enterica and L. monocytogenes prevalence in sampled irrigation ponds (Ahmed et al., 2009; Benjamin et al., 2013; McEgan et al., 2013). The higher microbial populations in surface water and exposed environments with complex contamination routes might affect the sensitivity of using current fecal indicators for the prediction of foodborne pathogens in irrigation ponds. In addition, prevalence variance of different foodborne pathogens (S. enterica spp. and L. monocytogenes) in the same water samples as well as the high variance among different farms (location) bring challenges in identifying one universal indicator or standard to evaluate contamination risks in pond (surface) water. The low correlation coefficient between fecal indicators, including generic E. coli, and foodborne pathogens in irrigation ponds suggests further efforts to identify more suitable indicator microorganisms or other biological markers.
Microbial community analysis through 16S rDNA sequencing provides clues to identify suitable alternative indicators and potential suppressors of S. enterica and L. monocytogenes in pond irrigation water. For example, one unidentified genus of Sphingomonadaceae is positively correlated with S. enterica prevalence and population. Sphingomonadaceae is a family of class Alphaproteobacteria. It is known by the ability of some species to degrade aromatic compounds, which is important to environmental remediation and may benefit the survival of S. enterica spp. in pond water. Another five genera of order Sphingomonadales were also determined to be positively correlated with S. enterica prevalence or population (Table 5). The interaction between associated bacterial genera of order Sphingomonadales and S. enterica contributed to the positive correlation in irrigation ponds is unclear. Further studies to investigate the microbial relationship may benefit the identification of specific factors that affect S. enterica contamination in surface water. The genus Rhizobacter was positively correlated with L. monocytogenes prevalence and population. Rhizobacter includes species isolated from the plant rhizosphere. The significant positive relationship between these bacteria and L. monocytogenes indicates that the contamination of this foodborne pathogen may be associated with run off from plant rhizosphere soil into irrigation ponds. In addition, the positive correlation between water turbidity and L. monocytogenes presence supports the hypothesis of contamination through external sources, like soil. Bacillales is an order of Gram-positive bacteria, which includes the Listeria spp. One unidentified genus of this order is negatively correlated with the foodborne pathogen, which may be caused by its competitive relationship to L. monocytogenes in the environment. Species of Sphingomonadales and Rhizobacter should be further examined as alternative indicator microorganisms for S. enterica spp. and L. monocytogenes in irrigation ponds, respectively. The diverse and complex composition of microbial communities in irrigation water are associated with environmental conditions and water sources (Gu et al., 2019b; Chung et al., 2020). The sample size (n = 96) performed for high-throughput sequencing in this study might be limited to cover the comprehensive microbial communities. Further research with larger sample size and higher sequencing depth for microbiome study on irrigation water is suggested to evaluate identified bacterial taxa as indicators or biocontrol agents of foodborne pathogens.
The population density of fecal indicators, coliform and generic E. coli, are statistically correlated with S. enterica prevalence in irrigation wells. However, correlation coefficients between fecal indicators and S. enterica were less than 0.3 (Table 2). If we analyze the correlation to each individual well, coliform and generic E. coli were only significantly correlated with S. enterica in well D but not the other wells. In addition, they are not correlated with L. monocytogenes in well water. Thus, fecal indicators may not be good enough as a general standard to assess the contamination of foodborne pathogens in tested irrigation sources. Due to the different spatial distribution and occurrence of S. enterica and L. monocytogenes, it would not be beyond our expectations that different bacterial taxa were correlated with these two foodborne pathogens in sampled irrigation water. It is notable that pond D had the highest S. enterica MPN values, and the prevalence of S. enterica was considerably higher in well D compared to ponds and wells in other farms. The relative high levels of S. enterica in this farm might be associated with distinct contamination sources compared to other farms on ESV, which results in significant correlation to water turbidity in ponds and fecal indicator population in well water samples. Nevertheless, even though farm D was observed to have relative higher risk of S. enterica contamination in pond and well water, the levels of fecal indicators, coliform and generic E. coli, were not the highest among all tested farms (Figure 2).
In addition to environmental factors mentioned above, fertilization with poultry litter in this agricultural region might be associated with the contamination of S. enterica in irrigation water (Gu et al., 2019a). S. enterica contamination of fresh produce is often linked to animal farming operations (Volkova et al., 2009; Rothrock et al., 2017), nevertheless there are evidences that many serovars have increased fitness for survival and growth in the natural environments independent of animal hosts (Brandl and Mandrell, 2002; Brandl et al., 2006, 2013). S. enterica serovar Newport was implicated in the recurring outbreaks associated with tomato in this agricultural region (Greene et al., 2008; Bennett et al., 2015). Diverse S. enterica serotypes were identified from irrigation water, poultry litter, and field soil samples in this region (Gu et al., 2019a,b). However, serovar Newport was identified to be the dominant serotype in sampled irrigation water (35% in tested pond water and 65% in well water), but not in poultry litter (2%) or poultry litter amended field soil (6%) samples. This is in agreement with another survey study about the prevalence of S. enterica in environmental samples in this agricultural region (Bell et al., 2015), which indicated irrigation with contaminated water might be the main source of the specific S. enterica serotype identified from multiple salmonellosis outbreaks and traced back to this region. This may also be associated with the survival advantages of the specific S. enterica Newport strain in irrigation water and on tomato. It is hard to demonstrate the direct link between poultry litter application and contamination of S. enterica in irrigation water and on produce in this area since farms tested for different types of samples were geographically distinct (distance > 3 km).
Those results are based on a 1-year study with limited sample size (n = 96) for L. monocytogenes test and microbiome analysis, thus there are limits to the conclusions that can be drawn. The work presented here, demonstrates current fecal indicators may not be adequate for the evaluation of agricultural water for produce safety, especially for surface water sources. Different from several published studies (Haley et al., 2009; Walters et al., 2011; Harris et al., 2018), significant correlations between weather parameters, including rainfall and temperature, were not evidenced in this research. The “negative” correlation is also important to be reported because it provides data that on-farm contamination events might be driven by geographical factors. Therefore, data might be needed in different agricultural regions to describe how weather could influence pathogen dynamics. 16S rDNA sequencing provides clues to identify alternative indicator and suppressors of foodborne pathogens in irrigation water. Further metagenomics analysis, such as shotgun sequencing to classify the microbial communities and functional analysis, can shed light to screen and identify practical indicator microorganisms or other biological markers that could reliably indicate the presence or absence of pathogenic viruses, protozoa, parasites, and bacteria in agricultural water.
Data Availability Statement
The original contributions presented in the study are included in the article/Supplementary Material, further inquiries can be directed to the corresponding author.
Author Contributions
GG and SR contributed to the study conception and design. GG, AO, PR, ER, JZ, and RB contributed to the acquisition of data. GG and LS contributed to analysis and interpretation of data. GG contributed to drafting of manuscript. LS, AO, ER, and JZ contributed to critical revision. All authors contributed to the article and approved the submitted version.
Conflict of Interest
The authors declare that the research was conducted in the absence of any commercial or financial relationships that could be construed as a potential conflict of interest.
Acknowledgments
We thank Amy Harrison, Jason Floyd, and Jill Pollok for sample collection and laboratory assistance. We appreciate Dr. David Oryang’s and Dr. Jane Van Doren’s review and comments during the development of this manuscript. We are also grateful to farmers who granted field sampling in this study. This manuscript partly overlaps with the CPS project report (Rideout et al., 2016).
Footnotes
Funding. This research was funded by the Center for Produce Safety (CPS), FDA, and an integrated, internal competitive grant from VAES, VCE, and CALS at Virginia Tech.
Supplementary Material
The Supplementary Material for this article can be found online at: https://www.frontiersin.org/articles/10.3389/fmicb.2020.557289/full#supplementary-material
References
- Ahmed W., Sawant S., Huygens F., Goonetilleke A., Gardner T. (2009). Prevalence and occurrence of zoonotic bacterial pathogens in surface waters determined by quantitative PCR. Water Res. 43, 4918–4928. 10.1016/j.watres.2009.03.041, PMID: [DOI] [PubMed] [Google Scholar]
- Barak J. D., Kramer L. C., and. Hao L. Y. (2011). Colonization of tomato plants by Salmonella enterica is cultivar dependent, and type 1 trichomes are preferred colonization sites. Appl. Environ. Microbiol. 77, 498–504. 10.1128/AEM.01661-10, PMID: [DOI] [PMC free article] [PubMed] [Google Scholar]
- Bell R. L., Zheng J., Burrows E., Allard S., Wang C. Y., Keys C. E., et al. (2015). Ecological prevalence, genetic diversity, and epidemiological aspects of Salmonella isolated from tomato agricultural regions of the Virginia Eastern Shore. Front. Microbiol. 6:415. 10.3389/fmicb.2015.00415, PMID: [DOI] [PMC free article] [PubMed] [Google Scholar]
- Benjamin L., Atwill E. R., Jay-Russell M., Cooley M., Carychao D., Gorski L., et al. (2013). Occurrence of generic Escherichia coli, E. coli O157 and Salmonella spp. in water and sediment from leafy green produce farms and streams on the Central California coast. Int. J. Food Microbiol. 165, 65–76. 10.1016/j.ijfoodmicro.2013.04.003, PMID: [DOI] [PubMed] [Google Scholar]
- Bennett S. D., Littrell K. W., Hill T. A., Mahovic M., Behravesh C. B. (2015). Multistate foodborne disease outbreaks associated with fresh tomatoes, United States, 1990–2010, a recurring public health problem. Epidemiol. Infect. 143, 1352–1359. 10.1017/S0950268814002167, PMID: [DOI] [PMC free article] [PubMed] [Google Scholar]
- Brandl M. T. (2006). Fitness of human enteric pathogens on plants and implications for food safety. Annu. Rev. Phytopathol. 44, 367–392. 10.1146/annurev.phyto.44.070505.143359, PMID: [DOI] [PubMed] [Google Scholar]
- Brandl M. T., Cox C. E., Teplitski M. (2013). Salmonella interactions with plants and their associated microbiota. Phytopathology 103, 316–325. 10.1094/PHYTO-11-12-0295-RVW, PMID: [DOI] [PubMed] [Google Scholar]
- Brandl M. T., Mandrell R. E. (2002). Fitness of Salmonella enterica serovar Thompson in the cilantro phyllosphere. Appl. Environ. Microbiol. 68, 3614–3621. 10.1128/aem.68.7.3614-3621.2002, PMID: [DOI] [PMC free article] [PubMed] [Google Scholar]
- Burton G. A., Gunnison D., Lanza G. R. (1987). Survival of pathogenic bacteria in various freshwater sediments. Appl. Environ. Microbiol. 53, 633–638. 10.1128/AEM.53.4.633-638.1987, PMID: [DOI] [PMC free article] [PubMed] [Google Scholar]
- Carstens C. K., Salazar J. K., Darkoh C. (2019). Multistate outbreaks of foodborne illness in the United States associated with fresh produce from 2010 to 2017. Front. Microbiol. 10:2667. 10.3389/fmicb.2019.02667, PMID: [DOI] [PMC free article] [PubMed] [Google Scholar]
- CDC (2005). Outbreaks of Salmonella infections associated with eating Roma tomatoes—United States and Canada, 2004. Can. Commun. Dis. Rep. 31, 225–228. PMID: [PubMed] [Google Scholar]
- CDC (2007). Multistate outbreaks of Salmonella infections associated with raw tomatoes eaten in restaurants—United States, 2005–2006. MMWR Morb. Mortal. Wkly. Rep. 56, 909–911. PMID: [PubMed] [Google Scholar]
- CDC (2012). Multistate outbreak of listeriosis linked to whole cantaloupes from Jensen farms, Colorado (final update). Available at: https://www.cdc.gov/Listeria/outbreaks/cantaloupes-jensen-farms/index.html (Accessed February 27, 2020).
- CDC (2018). Estimates of foodborne illness in the United States. Available at: https://www.cdc.gov/foodborneburden/index.html (Accessed February 27, 2020).
- Chandran A., Hatha A. A. M. (2005). Relative survival of Escherichia coli and Salmonella typhimurium in a tropical estuary. Water Res. 39, 1397–1403. 10.1016/j.watres.2005.01.010, PMID: [DOI] [PubMed] [Google Scholar]
- Chandran A., Varghese S., Kandeler E., Thomas A., Hatha M. M., Mazumder A. (2011). An assessment of potential public health risk associated with the extended survival of indicator and pathogenic bacteria in freshwater lake sediments. Int. J. Hyg. Environ. Health 214, 258–264. 10.1016/j.ijheh.2011.01.002, PMID: [DOI] [PubMed] [Google Scholar]
- Chao A. (1984). Nonparametric estimation of the number of classes in a population. Scand. J. Stat. 1, 265–270. [Google Scholar]
- Chigor V. N., Umoh V. J., Smith S. I. (2010). Occurrence of Escherichia coli O157 in a river used for fresh produce irrigation in Nigeria. Afr. J. Biotechnol. 9, 178–182. [Google Scholar]
- Chung T., Weller D. L., Kovac J. (2020). The composition of microbial communities in six streams, and its association with environmental conditions, and foodborne pathogen isolation. Front. Microbiol. 11:1757. 10.3389/fmicb.2020.01757, PMID: [DOI] [PMC free article] [PubMed] [Google Scholar]
- Edgar R. C. (2010). Search and clustering orders of magnitude faster than BLAST. Bioinformatics 26, 2460–2461. 10.1093/bioinformatics/btq461, PMID: [DOI] [PubMed] [Google Scholar]
- EPA (2002). Improved enumeration methods for the recreational water quality indicators, Enterococci and Escherichia coli. EPA/821/R-97/004. US environmental Protection Agency, Washington, DC., USA.
- Faith D. P. (1992). Conservation evaluation and phylogenetic diversity. Biol. Conserv. 61, 1–10. 10.1016/0006-3207(92)91201-3 [DOI] [Google Scholar]
- FDA (2007-2017). Archive for Recalls, Market Withdrawals & Safety Alerts. Available at: https://www.fda.gov/safety/recalls-market-withdrawals-safety-alerts/archive-recalls-market-withdrawals-safety-alerts (Accessed February 27, 2020).
- Franz E., Van Bruggen A. H. C. (2008). Ecology of E. coli O157:H7 and Salmonella enterica in the primary vegetable production chain. Crit. Rev. Microbiol. 34, 143–161. 10.1080/10408410802357432, PMID: [DOI] [PubMed] [Google Scholar]
- Furrer B., Candrian U., Hoefelein C., Luethy J. (1991). Detection and identification of Listeria monocytogenes in cooked sausage products and in milk by in vitro amplification of haemolysin gene fragments. J. Appl. Microbiol. 70, 372–379. 10.1111/j.1365-2672.1991.tb02951.x, PMID: [DOI] [PubMed] [Google Scholar]
- Greene S. K., Daly E. R., Talbot E. A., Demma L. J., Holzbauer S., Patel N. J., et al. (2008). Recurrent multistate outbreak of Salmonella Newport associated with tomatoes from contaminated fields, 2005. Epidemiol. Infect. 136, 157–165. 10.1017/S095026880700859X, PMID: [DOI] [PMC free article] [PubMed] [Google Scholar]
- Gu G., Cevallos-Cevallos J. M., Van Bruggen A. H. C. (2013c). Ingress of Salmonella enterica into tomato leaves through hydathodes. PLoS One 8:e53470. 10.1371/journal.pone.0053470, PMID: [DOI] [PMC free article] [PubMed] [Google Scholar]
- Gu G., Hu J., Cevallos-Cevallos J. M., Richardson S. M., Bartz J. A., Van Bruggen A. H. C. (2011). Internal colonization of Salmonella enterica serovar Typhimurium in tomato plants. PLoS One 6:e27340. 10.1371/journal.pone.0027340, PMID: [DOI] [PMC free article] [PubMed] [Google Scholar]
- Gu G., Luo Z., Cevallos-Cevallos J. M., Adams M., Vellidis G., Wright A., et al. (2013a). Factors affecting the occurrence of Escherichia coli O157 contamination in irrigation ponds on produce farms in the Suwannee River Watershed. Can. J. Microbiol. 59, 175–182. 10.1139/cjm-2012-0599, PMID: [DOI] [PubMed] [Google Scholar]
- Gu G., Luo Z., Cevallos-Cevallos J. M., Adams M., Vellidis G., Wright A., et al. (2013b). Occurrence and population density of Campylobacter jejuni in irrigation ponds on produce farms in the Suwannee River watershed. Can. J. Microbiol. 59, 339–346. 10.1139/cjm-2013-0027, PMID: [DOI] [PubMed] [Google Scholar]
- Gu G., Strawn L. K., Oryang D., Zheng J., Reed E., Ottesen A., et al. (2018). Agricultural practices influence Salmonella contamination and survival in pre-harvest tomato production. Front. Microbiol. 9:2451. 10.3389/fmicb.2018.02451, PMID: [DOI] [PMC free article] [PubMed] [Google Scholar]
- Gu G., Strawn L. K., Zheng J., Reed E., Rideout S. L. (2019a). Diversity and dynamics of Salmonella enterica in water sources, poultry litters, and field soils amended with poultry litter in a major agricultural area of Virginia. Front. Microbiol. 10:2868. 10.3389/fmicb.2019.02868, PMID: [DOI] [PMC free article] [PubMed] [Google Scholar]
- Gu G., Yin H., Ottesen A., Bolten S., Patel J., Rideout S. L., et al. (2019b). Microbiomes in ground water and alternative irrigation water, and spinach microbiomes impacted by irrigation with different types of water. Phytobiomes J. 3, 137–147. 10.1094/PBIOMES-09-18-0037-R [DOI] [Google Scholar]
- Haley B. J., Cole D. J., Lipp E. K. (2009). Distribution, diversity, and seasonality of waterborne salmonellae in a rural watershed. Appl. Environ. Microbiol. 75, 1248–1255. 10.1128/AEM.01648-08, PMID: [DOI] [PMC free article] [PubMed] [Google Scholar]
- Harris C., Tertuliano M., Rajeev S., Vellidis G., Levy K. (2018). Impact of storm runoff on Salmonella and Escherichia coli prevalence in irrigation ponds of fresh produce farms in southern Georgia. J. Appl. Microbiol. 124, 910–921. 10.1111/jam.13689, PMID: [DOI] [PMC free article] [PubMed] [Google Scholar]
- Hintz L. D., Boyer R. R., Ponder M. A., Williams R. C., Rideout S. R. (2010). Recovery of Salmonella enterica Newport introduced through irrigation water from tomato (Lycopersicum esculentum) fruit, roots, stems, and leaves. HortScience 45, 675–678. 10.1128/AEM.01648-08, PMID: [DOI] [PMC free article] [PubMed] [Google Scholar]
- Islam M., Morgan J., Doyle M. P., Phatak S. C. (2004). Fate of Salmonella enterica serovar Typhimurium on carrots and radishes grown in fields treated with contaminated manure composts or irrigation water. Appl. Environ. Microbiol. 70, 2497–2502. 10.1128/aem.70.4.2497-2502.2004, PMID: [DOI] [PMC free article] [PubMed] [Google Scholar]
- Lu J., Breitwieser F. P., Thielen P., Salzberg S. L. (2017). Bracken: estimating species abundance in metagenomics data. PeerJ Comput. Sci. 3:e104. 10.7717/peerj-cs.104 [DOI] [Google Scholar]
- Luo Z., Gu G., Ginn A., Van Bruggen A. H. C., Danyluk M., Wright A. (2016). Distribution and characterization of Salmonella enterica isolates from irrigation ponds in southeastern U.S.A. Appl. Environ. Microbiol. 81, 8243–8253. 10.1128/AEM.04086-14, PMID: [DOI] [PMC free article] [PubMed] [Google Scholar]
- Luo Z., Gu G., Giurcanu M. C., Adams M., Vellidis G., van Bruggen A. H. C., et al. (2014). Development of a novel cross-streaking method for isolation, confirmation, and enumeration of Salmonella from irrigation ponds. J. Microbiol. Methods 101, 86–92. 10.1016/j.mimet.2014.03.012, PMID: [DOI] [PubMed] [Google Scholar]
- McEgan R., Mootian G., Goodridge L. D., Schaffner D. W., Danyluka M. D. (2013). Predicting Salmonella populations from biological, chemical, and physical indicators in Florida surface waters. Appl. Environ. Microbiol. 79, 4094–4105. 10.1128/AEM.00777-13, PMID: [DOI] [PMC free article] [PubMed] [Google Scholar]
- Miles J. M., Sumner S. S., Boyer R. R., Williams R. C., Latimer J. G., McKinney J. M. (2009). Internalization of Salmonella enterica serovar Montevideo into greenhouse tomato plants through contaminated irrigation water or seed stock. J. Food Prot. 72, 849–852. 10.4315/0362-028x-72.4.849, PMID: [DOI] [PubMed] [Google Scholar]
- Nuesch-Inderbinen M., Stephan R. (2016). Fresh fruit and vegetables as vehicles of bacterial foodborne disease, a review and analysis of outbreaks registered by proMED-mail associated with fresh produce. J. Food Saf. Food Qual. 67, 32–39. 10.2376/0003-925X-67-32 [DOI] [Google Scholar]
- Oliveira M., Usall J., Vinas I., Solsona C., Abadias M. (2011). Transfer of Listeria innocua from contaminated compost and irrigation water to lettuce leaves. Food Microbiol. 28, 590–596. 10.1016/j.fm.2010.11.004, PMID: [DOI] [PubMed] [Google Scholar]
- Portney L. G., Watkins M. P. (2009). Foundations of clinical research: Applications to practice. Upper Saddle River, NJ: Pearson/Prentice Hall. [Google Scholar]
- Quast C., Pruesse E., Yilmaz P., Gerken J., Schweer T., Yarza P., et al. (2013). The SILVA ribosomal RNA gene database project: improved data processing and web-based tools. Nucl. Acids Res. 41, 590–596. 10.1093/nar/gks1219, PMID: [DOI] [PMC free article] [PubMed] [Google Scholar]
- Rhodes M. W., Kator H. (1988). Survival of Escherichia coli and Salmonella spp. in estuarine environments. Appl. Environ. Microbiol. 54, 2902–2907. 10.1128/AEM.54.12.2902-2907.1988, PMID: [DOI] [PMC free article] [PubMed] [Google Scholar]
- Rideout S. L., Boyer R., Gu G. (2016). CPS project report: Investigation of risk criteria and foodborne pathogen reduction practices for irrigation water. Available at: https://www.centerforproducesafety.org/amass/documents/researchproject/383/CPS%20Final%20Report_Rideout_January%202016.pdf (Accessed May 7, 2020).
- Rothrock M. J., Davis M. L., Locatelli A., Bodie A., McIntosh T. G., Donaldson J. R., et al. (2017). Listeria occurrence in poultry flocks: detection and potential implications. Front. Vet. Sci. 4:125. 10.3389/fvets.2017.00125, PMID: [DOI] [PMC free article] [PubMed] [Google Scholar]
- Solomon E. B., Yaron S., Matthews K. R. (2002). Transmission of Escherichia coli O157:H7 from contaminated manure and irrigation water to lettuce plant tissue and its subsequent internalization. Appl. Environ. Microbiol. 68, 397–400. 10.1128/aem.68.1.397-400.2002, PMID: [DOI] [PMC free article] [PubMed] [Google Scholar]
- Volkova V. V., Bailey R. H., Wills R. W. (2009). Salmonella in broiler litter and properties of soil at farm location. PLoS One 4:e6403. 10.1371/journal.pone.0006403, PMID: [DOI] [PMC free article] [PubMed] [Google Scholar]
- Walters S. P., Thebo A. L., Boehm A. B. (2011). Impact of urbanization and agriculture on the occurrence of bacterial pathogens and stx genes in coastal waterbodies of Central California. Water Res. 45, 1752–1762. 10.1016/j.watres.2010.11.032, PMID: [DOI] [PubMed] [Google Scholar]
- Weller D., Wiedmann M., Strawn L. K. (2015). Irrigation is significantly associated with an increased prevalence of Listeria monocytogenes in produce production environments in New York state. J. Food Prot. 78, 1132–1141. 10.4315/0362-028X.JFP-14-584, PMID: [DOI] [PubMed] [Google Scholar]
- Wood D. E., Salzberg S. L. (2014). Kraken: ultrafast metagenomic sequence classification using exact alignments. Genome Biol. 15:R46. 10.1186/gb-2014-15-3-r46, PMID: [DOI] [PMC free article] [PubMed] [Google Scholar]
- Zheng J., Allard S., Reynolds S., Millner P., Arce G., Blodgett R. J., et al. (2013). Colonization and internalization of Salmonella enterica in tomato plants. Appl. Environ. Microbiol. 79, 2494–2502. 10.1128/AEM.03704-12, PMID: [DOI] [PMC free article] [PubMed] [Google Scholar]
Associated Data
This section collects any data citations, data availability statements, or supplementary materials included in this article.
Supplementary Materials
Data Availability Statement
The original contributions presented in the study are included in the article/Supplementary Material, further inquiries can be directed to the corresponding author.