Fig. 1.

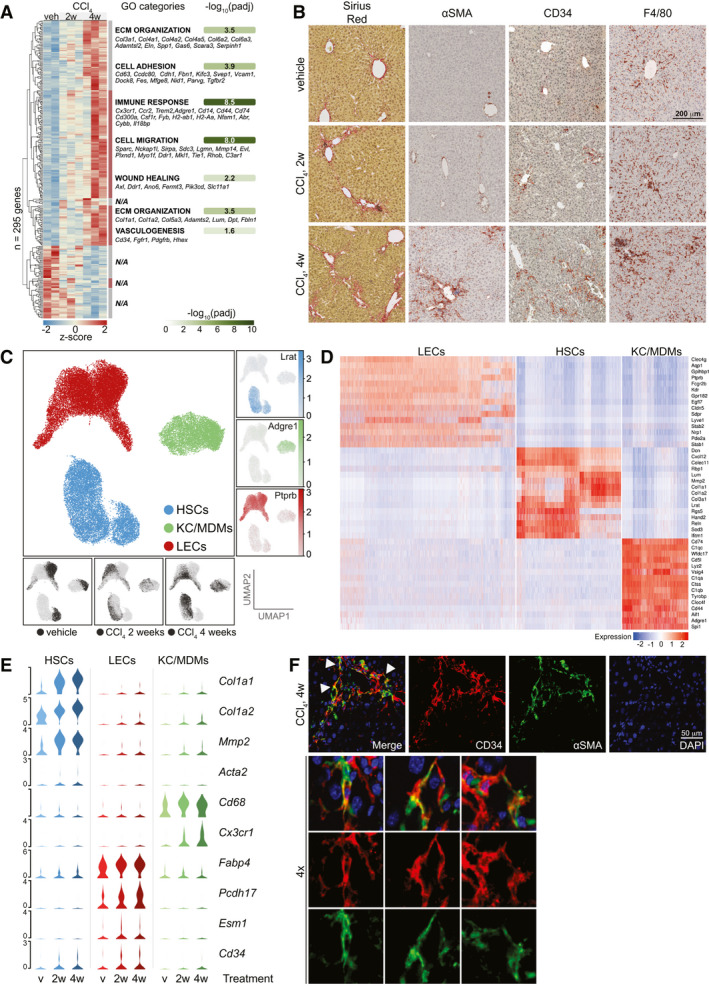
Single‐cell analysis of sinusoidal cells from healthy and fibrotic mouse livers. (A) Whole‐liver RNA‐sequencing of mice treated with CCl4 or veh (n = 2‐3). Z‐scores of 295 differentially expressed genes (4w CCl4 vs. veh, Padj < 0.05, DESeq2). Seven hierarchical clusters are indicated with enriched GO‐categories (Padj < 0.05) and exemplary genes of each category (N/A: No significantly enriched category for cluster). (B) Sirius red, αSMA, CD34 and F4/80 IHC of representative livers from mice treated as indicated. (C) Centre; UMAP of >35K single cells colored according to cell type. Right; UMAPs showing log2‐expression of marker genes. Bottom; UMAPs indicating treatment group of each cell. (D) Scaled log2‐expression of marker genes in all cells grouped by cell type. (E) Scaled, log2‐expression of select cell type‐specific and injury‐responsive genes stratified by cell type and treatment group (v = vehicle). (F) IF of CD34 (red) and αSMA (green) in livers of 4w CCl4‐treated mice. Arrows indicate double‐positive cells shown at 4x magnification.
