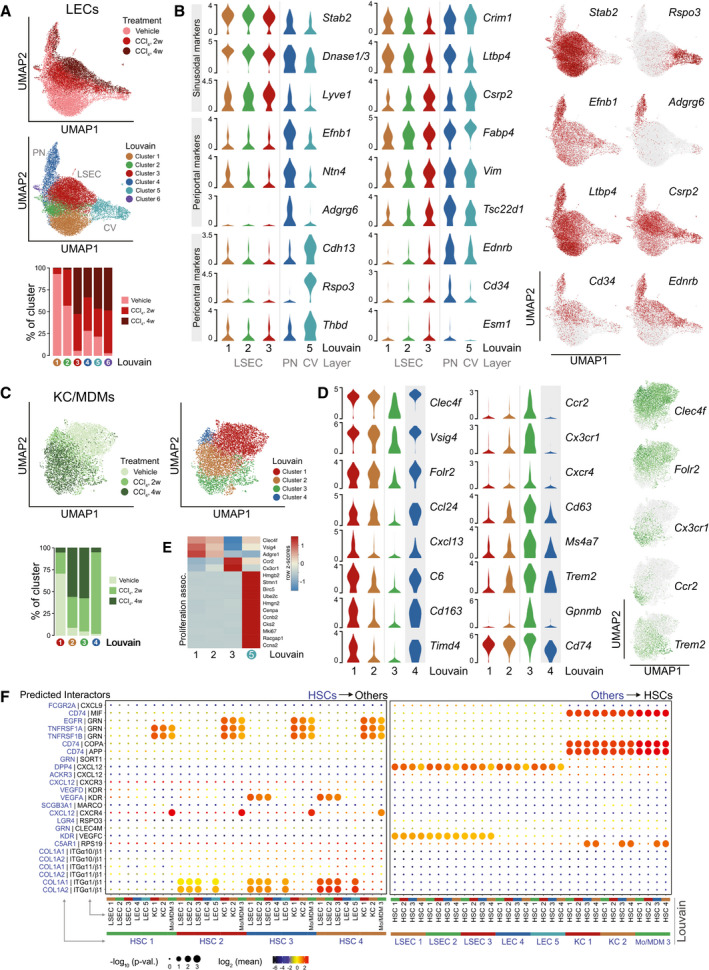
Fig. 3.

Sinusoidal dynamics and interactions in healthy and fibrotic livers. (A) UMAPs of 17748 LECs with indication of treatment groups and louvain clustering (PN: portal node‐proximal LECs; CV: central vein‐proximal LECs). Lower panel shows the representation of each treatment group in the louvain clusters 1‐6. Counts normalized by total LEC counts in each treatment group. (B) Log2‐expression of cluster‐selective marker genes and select injury‐responsive genes across LEC louvain clusters 1‐5. Right; UMAPs of LECs showing log2‐expression levels of select genes. (C) UMAPs of 6611 KC/MDMs with indication of treatment groups and louvain clustering. Lower panel showing the representation of each treatment group in the louvain clusters 1‐6. Counts normalized by total KC/MDM counts in each treatment group. (D) Log2‐expression of cluster‐selective marker genes and select injury‐responsive genes across KC/MDM louvain clusters 1‐4. Right; UMAPs of KC/MDMs showing log2‐expression of select genes. (E) Row‐normalized z‐scores of select marker genes and proliferation‐associated genes in KC/MDM louvain clusters 1‐3 and 5. (F) Directional cell‐cell interactions inferred from ligand‐receptor pairs and stratified by louvain clusters. Left; HSC‐to‐LEC/KC/MDM interactions. Right; LEC/KC/MDM‐to‐HSC interactions. Circle size indicates enrichment of expression of interacting partners in the interacting cluster pairs and color indicates mean expression of interacting partner subunits. Applied mean expression cut‐off is ≥3 for at least one interacting cluster pair.
