

Summary
The common polysaccharide antigen (CPA) of the lipopolysaccharide (LPS) from Pseudomonas syringae is highly variable, but the genetic basis for this is poorly understood. We have characterized the CPA locus from P. syringae pv. actinidiae (Psa). This locus has genes for l‐ and d‐rhamnose biosynthesis and an operon coding for ABC transporter subunits, a bifunctional glycosyltransferase and an o‐methyltransferase. This operon is predicted to have a role in the transport, elongation and termination of the CPA oligosaccharide and is referred to as the TET operon. Two alleles of the TET operon were present in different biovars (BV) of Psa and lineages of the closely related pathovar P. syringae pv. actinidifoliorum. This allelic variation was reflected in the electrophoretic properties of purified LPS from the different isolates. Gene knockout of the TET operon allele from BV1 and replacement with that from BV3, demonstrated the link between the genetic locus and the biochemical properties of the LPS molecules in Psa. Sequence analysis of the TET operon from a range of P. syringae and P. viridiflava isolates displayed a phylogenetic history incongruent with core gene phylogeny but correlates with previously reported tailocin sensitivity, suggesting a functional relationship between LPS structure and tailocin susceptibility.
Introduction
Pseudomonas syringae pv. actinidiae (Psa) is the causal agent of canker disease in kiwifruit (Actinidia Lindl spp.). Outbreaks of the disease were first observed in Japan and Korea in the 1980s and 1990s respectively, but isolates of the bacterium responsible for these outbreaks did not spread from their country of origin (Koh et al., 1994; Serizawa et al., 1989; Takikawa et al., 1989). Between 2008 and 2010, a pandemic clone spread around the world, devastating the majority of regions growing cultivars of A. chinensis var. chinensis (gold kiwifruit) (Scortichini et al., 2012). A large number of Psa isolates from a range of geographical origins have been sequenced, and phylogenies generated from the core genomes show that the three emergences of the disease are closely related, but form distinct clades (McCann et al., 2013; McCann et al., 2017). Single nucleotide polymorphism (SNP) analysis indicates that the recent pandemic isolate originated in China, but the location of the source population of this pathovar has not been identified (McCann et al., 2017). Despite the close phylogenetic relationship between Psa isolates, their accessory genomes vary significantly in their effector complement and secondary metabolite portfolios (Marcelletti et al., 2011; Mazzaglia et al., 2012; Butler et al., 2013; McCann et al., 2013).
Based on both the phylogeny of the core genome and accessory gene variation, Psa isolates have been designated as biovars (BVs) (Vanneste et al., 2013; Cunty et al., 2015). The isolates that only cause leaf spots on kiwifruit, initially described as BV4, are closely related to Psa, but have now been given their own pathovar designation; P. syringae pv. actinidifoliorum (Pfm) and consist of four distinct lineages (L1‐4; Cunty et al., 2015). Recently, two more Psa BVs have been discovered in Japan (Fujikawa and Sawada, 2016; Sawada et al., 2016). Variation in the accessory genome of P. syringae pathovars and Psa BVs, and its role in host specificity has been well documented (McCann et al., 2013; Dillon et al., 2019a). In addition, P. syringae isolates have been shown to have a high degree of structural and serological variation in their lipopolysaccharide (LPS) (Zdorovenko and Zdorovenko, 2010). However, the genetic basis for this is not well understood.
Most bacteriophages and tailocins utilize LPS as a receptor to recognize and bind to their host. Tailocins are derivatives of bacteriophages, comprising predominantly the tail proteins that function to depolarize the bacterial membrane (Riley and Wertz, 2002). It is thought that isolates of P. syringae use tailocins (also known as R‐type syringacins) to target and outcompete closely related strains that presumably occupy a similar ecological niche (Hockett et al., 2015). It has been shown recently that there is a high degree of variation in the sensitivity to tailocins within P. syringae (Baltrus et al., 2019). Understanding the molecular basis of this variation is important if we are to implement novel methods such as the use of phage therapy or tailocins for biological control of this pathogen (Frampton et al., 2014; Frampton et al., 2015; Baltrus et al., 2019; Pinheiro et al., 2019; Rooney et al., 2020; Holtappels et al., 2020).
LPSs are complex glycolipids that make up the surface leaflet of the outer membrane of gram‐negative bacteria, forming a physical protective barrier. LPSs have three distinct domains: Lipid A that tethers the molecule to the outer membrane, the o‐polysaccharide (OPS) that interfaces with the external environment and the core domain that links Lipid A to the OPS. The OPS can comprise two distinct polysaccharides the o‐specific antigen (OSA) and/or the common o‐polysaccharide antigen (CPA) and is structurally the most variable component of the LPS. One of the distinctions between the two OPS polysaccharides is that the CPA is exported via an ABC transporter‐dependent pathway, while OSA synthesis follows the Wzx/Wzy‐dependent pathway (Raetz and Whitfield, 2002). In many bacterial species, the OPS is responsible for the immunological variation between isolates and, for human and animal pathogens, subspecies classification is based on serotypes (King et al., 2009; DebRoy et al., 2016). Similarly, the structures of OPS in plant‐pathogenic bacteria such as P. syringae are highly variable at the pathovar level (Ovod et al., 1997a). For P. syringae, the OPS appears to be comprised of the CPA (Mesarich et al., 2017; Kutschera et al., 2019a) with a backbone consisting of a tri‐ or tetra‐saccharide repeating unit, comprising either l‐ or d‐Rhamnose (Rha), or a combination of the two, with various linkages. These are decorated with side chains consisting of different sugars such as N‐acetyl‐glucosamine (GlcNAc), fucose (Fuc), Rha, and N‐acetyl‐fucosamine (FucNAc) (Ovod et al., 1997a; Zdorovenko and Zdorovenko, 2010). The OPS can also be methylated or acetylated to varying degrees (Zdorovenko et al., 2001). At least nine serotypes of P. syringae have been identified, and each differs in the structure of the OPS backbone and side‐chain modifications (Zdorovenko and Zdorovenko, 2010). Although considerable effort in the past was devoted to attempts at relating serotype to pathovar identification and taxonomy, correlations were not consistently observed (Ovod et al., 1997b). Little is known about the biosynthesis of LPS in P. syringae or the genetic basis for the observed structural and immunological variability within the genus.
Transposon mutagenesis of Psa BV3 using Tn5 identified a set of mutations with a rough (R) colony phenotype (Mesarich et al., 2017). This phenotype is often associated with mutations in LPS biosynthesis. Indeed, the majority of the Tn5 inserts in these R‐LPS mutants mapped to a gene cluster in Psa orthologous to the CPA biosynthetic pathway from P. aeruginosa (Mesarich et al., 2017). Furthermore, LPS was not observed in these mutants, suggesting CPA is the sole OPS in Psa (Hockett et al., 2017). Other recent papers have shown a relationship between OSA and tailocin sensitivity among the Pseudomonads (Carim et al., 2020), directly identified components of CPA biosynthesis in P. syringae through gene knockouts (Kutschera et al., 2019a) and increased resistance to tailocins (Kandel et al., 2020).
Here, we investigated the genetics of LPS biosynthesis in Psa. We characterized the CPA locus and the orthologous region in the different Psa BVs, P. syringae and the closely related species P. viridiflava. We show an operon from this locus displays a high degree of variability consistent with horizontal gene transfer rather than a vertical evolutionary history which accounts for the high degree of structural variation of LPS observed in this species complex. Furthermore, the relationship between this component of the CPA locus and sensitivity to tailocins was highly correlated.
Results
Major LPS biosynthesis genes in Psa BV3 are shared with P. aeruginosa
In P. aeruginosa PAO1, the genes and operons responsible for the biosynthesis of Lipid A, the core LPS and the OPS tend to be co‐located and have been well annotated and characterized (King et al., 2009; Lam et al., 2011). We identified the key loci containing the majority of the LPS biosynthetic genes in Psa BV3 using BLASTx with P. aeruginosa PAO1 orthologues (Fig. 1A and Table 1). Amino acid similarity to P. aeruginosa PAO1 orthologues of the lipid A, core LPS, and Rha biosynthetic pathways in the CPA locus is relatively high (Table 1). In contrast, Psa genes putatively coding for other components of the CPA, such as the wzm/wzt/wbpX orthologues, are more divergent and have poor or no significant BLASTx hits. Evidence for an OSA biosynthetic cluster was not found, apart from genes in the wbpK‐M locus, which is also involved in CPA biosynthesis (Table 1). The co‐location of genes annotated as ABC transporters and glycosyltransferases (GT) with both the d‐ and l‐Rha biosynthetic pathways suggests that the CPA is the predominant OPS in Psa BV3 (Fig. 1A).
Fig. 1.
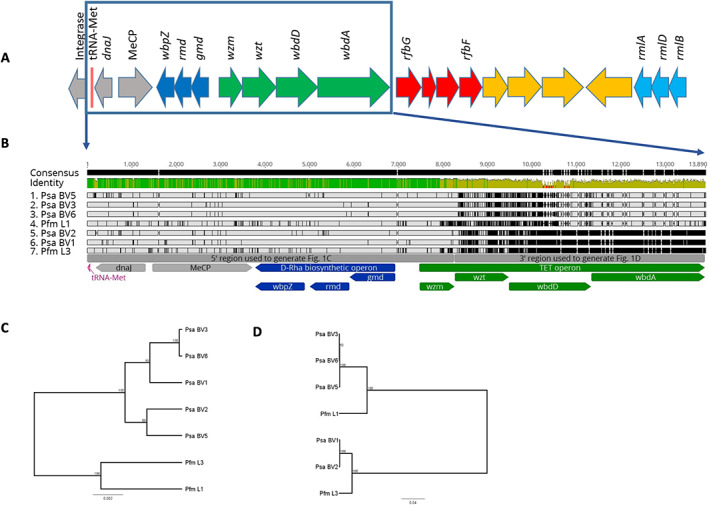
The common polysaccharide antigen (CPA) locus from Pseudomonas syringae pv. actinidiae (Psa) and P. syringae pv. actinidifoliorum (Pfm).
A. The genetic structure of the CPA locus in Psa ICMP18884 (BV3). The four operons annotated are: the d‐Rha biosynthesis operon (dark blue; IYO_23020‐30), CPA transport, extension, and termination (TET) operon (green; IYO_23000‐15), synthesis of unknown sugar operon (red; IYO_22980‐95), l‐Rha synthesis operon (light blue; IYO_22945‐55), neighbouring syntenic genes that are not believed to be part of this functional cluster are shaded grey (IYO_023035‐50) or yellow (IYO_022960‐75) (see Table 2 for details).
B. Nucleotide alignment of the conserved d‐Rha biosynthesis and polymorphic TET operons of Psa and Pfm. The CPA locus beginning at the syntenic conserved tRNA‐Met through wbdA of the TET locus for representatives of the Psa biovars (BV1, ICMP 9617; BV2, ICMP 19071; BV3, ICMP 18884; BV5, MAFF 212063; and BV6, MAFF 212141) and Pfm lineages (L1, ICMP 18803; L3, ICMP 18807) aligned in Geneious v11. Grey regions indicate nucleotide identity and black lines and regions indicate nucleotide divergence. The consensus identity in green (high identity), yellow (low identify) and red (no alignment) is displayed above the aligned sequences. Flanking DnaJ and MeCP genes are annotated in grey, d‐Rha biosynthesis operon and its genes are annotated in dark blue, and TET operon and its genes annotated in green.
C. UPGMA tree of the CPA locus from 5′ region up to and including wzm in (B).
D. UPGMA tree of the CPA locus from 3′ region from wzt to wbdA in (B).
Table 1.
Loci involved in lipopolysaccharide (LPS) biosynthesis in Pseudomonas syringae pv. actinidiae BV3.
| LPS component | Psa BV3 gene locus‐tag | P. aeruginosa PAO1 orthologues | Amino acid identity | Gene name | Psa R‐LPS phenotype a |
|---|---|---|---|---|---|
| Lipid A | IYO_000255 | PA0011 | 80% | lpxL | N/A |
| Lipid A | IYO_007660‐75 | PA3643‐6 | 55%–63% | lpxA‐D | N/A |
| Lipid A | IYO_016185‐225 | PA3552‐59 | 87%–94% | arnA‐F, arnT | N/A |
| Core | IYO_025525‐640 | PA5001‐12, PA4988, | 66%–86% | Yes | |
| CPA | IYO_005330 | PA5448 | 37% | wbpY | Yes |
| CPA | IYO_008990‐9000 | PA3141, PA3145‐6 | 40%–74% | wbpK‐M | Yes |
| CPA | IYO_022945‐023030 | PA5447‐59, PA5322 | 55%–80% b | Yes |
R‐LPS, Rough LPS.
d‐ and l‐Rha biosynthetic genes only.
Bioinformatic identification of the CPA locus in Psa BV3
Identifying the CPA locus in P. syringae has been challenging due to the lack of similarity to wzm/wzt/wbpX orthologues (Kutschera et al., 2019a). Previous work identified five R‐LPS mutants by Tn5 mutagenesis that had inserts in a region with homology to the CPA biosynthetic pathway from P. aeruginosa PAO1 (Mesarich et al., 2017). Bioinformatic analysis of this region revealed a locus of 18 genes (Fig. 1A). These genes were arranged in operons predicted to be involved in the synthesis of l‐Rha, d‐Rha, an unknown sugar, an ABC transporter complex involved in the transport of the CPA, a bifunctional glycosyltransferase, an o‐methyltransferase, and a region of unpredicted function (Table 2). Of the two genes annotated as ABC transporters, the first (IYO_023015) has homology to the ABC permease superfamily gene wzm, while the second (IYO_023010) has an N‐terminal ATPase domain with a C‐terminal wzt‐like domain (hereafter called wzt). The latter domain binds to the non‐reducing terminal modification of the sugar chain and is thus specific for the transported molecule (Cuthbertson et al., 2007). The GT gene (wbdA, IYO_023000) on the same operon as the two ABC transporters has two GT4 domains, implying it catalyses two distinct glycosyl transfer reactions. It is homologous to wbdA in E. coli (formerly known as mtfB), a functionally characterized mannosyltransferase, which has been shown to direct the extension of the O9‐specific polysaccharide chain by synthesizing, then polymerizing, the tetra‐saccharide repeat (Liston et al., 2015). The adjacent gene (IYO_023005) on the Psa BV3 operon is annotated as an o‐methyltransferase. In E. coli, the LPS oligosaccharide chain extension, catalysed by WbdA, is terminated by a dual methyltransferase/kinase enzyme (WbdD) (Mann et al., 2019). It appears therefore that this operon possesses genes required for the transport, extension, and termination of the backbone oligosaccharide chain of the CPA in Psa BV3 (hereafter referred to as the TET operon). This is the first time this operon has been identified in isolates of the P. syringae species complex.
Table 2.
Gene annotations of Pseudomonas syringae pv. actinidiae BV3 common LPS locus.
| Gene annotation | Operon colour a | P. aeruginosa | E. coli | Function | Gene ID | Protein_ID | R‐LPS b |
|---|---|---|---|---|---|---|---|
| dTDP‐glucose 4,6‐dehydratase | Light blue | rmlB | l‐Rha biosynthesis | IYO_022945 | AKT32330.1 | ||
| dTDP‐4‐dehydrorhamnose reductase | Light blue | rmlD | l‐Rha biosynthesis | IYO_022950 | AKT32331.1 | ||
| Glucose‐1‐phosphate thymidylyltransferase | Light blue | rmlA | l‐Rha biosynthesis | IYO_022955 | AKT32332.1 | ||
| Hypothetical protein | Orange | Unknown | IYO_022960 | AKT32333.1 | |||
| Hypothetical protein | Orange | Unknown | IYO_022965 | AKT32334.1 | |||
| Amine oxidase | Orange | Unknown | IYO_022970 | AKT32335.1 | |||
| Membrane protein | Orange | Unknown | IYO_022975 | AKT32336.1 | |||
| Glucose‐1‐phosphate cytidylyltransferase | Red | rfbF | Synthesis of unknown sugar | IYO_022980 | AKT32337.1 | ||
| Glycosyl transferase | Red | Synthesis of unknown sugar | IYO_022985 | AKT32338.1 | |||
| NAD‐dependent epimerase/dehydratase | Red | galE | Synthesis of unknown sugar | IYO_022990 | AKT32339.1 | ||
| CDP‐glucose 4,6‐dehydratase | Red | rfbG | Synthesis of unknown sugar | IYO_022995 | AKT32340.1 | ||
| Glycosyl transferase family 1 | Green | wbpX | wbdA | Chain elongation | IYO_023000 | AKT32341.1 | |
| SAM‐dependent methyltransferase | Green | wbdD | Chain termination | IYO_023005 | AKT32342.1 | Yes | |
| Sugar ABC transporter ATP‐binding protein | Green | wzt | wzt | Transport | IYO_023010 | AKT32343.1 | Yes |
| ABC transporter | Green | wzm | wzm | Transport | IYO_023015 | AKT32344.1 | Yes |
| GDP‐d‐mannose dehydratase | Blue | gmd | gmd | d‐Rha biosynthesis | IYO_023020 | AKT32345.1 | Yes |
| GDP‐6‐deoxy‐d‐lyxo‐4‐hexulose reductase | Blue | rmd | rmd | d‐Rha biosynthesis | IYO_023025 | AKT32346.1 | |
| Glycosyl transferase family 1 | Blue | wbpZ | d‐Rha biosynthesis | IYO_023030 | AKT32347.1 | Yes |
Operon colour used in Fig. 1.
R‐LPS, Rough LPS phenotype.
Two different versions of the TET operon are present in Psa and Pfm
The CPA locus from representatives of all five Psa BVs and two lineages of Pfm were identified and compared. The TET operon, genes for d‐Rha biosynthesis, and regions coding for a chemotactic receptor, a DnaJ molecular chaperone and a tRNA‐Met were shared and could be aligned (Fig. 1B). The latter three genes were syntenic in all genomes but are not part of the CPA locus. The region including the D‐Rha biosynthetic pathway and the first gene (wzm) in the TET operon (5′ region) is well conserved with few SNPs and a phylogenetic tree (Fig. 1C) closely matched the topology of a tree generated from seven conserved genes (Sawada et al., 2016). In contrast, the 3′ region, from the gene encoding the ABC transporter ATPase (wzt) of the TET operon is more variable, representing two groups of divergent sequences. One group includes Psa BVs 1 and 2, and Pfm L3, while the other includes Psa BVs 3, 5, and 6, and Pfm L1. A phylogenetic tree of this region (Fig. 1D) resolved into two clades that did not match the topology of Fig. 1C, or the phylogeny generated from the core genome (Supporting Information Fig. S1). These results suggest that variation at the TET operon is driving diversity at the CPA locus in Psa and Pfm.
LPS from Psa and Pfm has different biochemical properties
To assess whether genetic variation in the TET operon results in variation of the biochemical properties of LPS, we extracted LPS from Psa and Pfm using the method of Westphal and Jann (1965). Resolution of the extracted LPS by SDS‐PAGE revealed the classic ladder pattern characteristic of bacterial LPS molecules, a reflection of the length and charge micro‐heterogeneity of the o‐linked saccharides (Jann et al., 1975). Comparison of the LPS between the five different BVs of Psa and two lineages of Pfm revealed two patterns based on differences in the molecular weight range and spacing between bands (Fig. 2A). LPS from Psa BV1, BV2 and Pfm L3 formed one group, which was characterized by a broad range of molecular weights, especially in the higher molecular mass range. In contrast, Psa BV3, BV5, BV6 and Pfm L1 formed a second group that had a lower range of molecular weights and narrower spacing between bands (Fig. 2A). The two electrophoretic pattern groups reflect the broad clusters evident in the TET operon tree (Fig. 1D), suggesting the TET operon plays a significant role in defining the electrophoretic properties of LPS. Banding patterns within a group were not identical, suggesting that they may differ in decoration of the back bone with side‐chain sugars and/or acylation. Therefore, the genetic and biochemical data indicate that the CPA locus identified in Psa and Pfm contributes to LPS biosynthesis in these P. syringae pathovars.
Fig. 2.
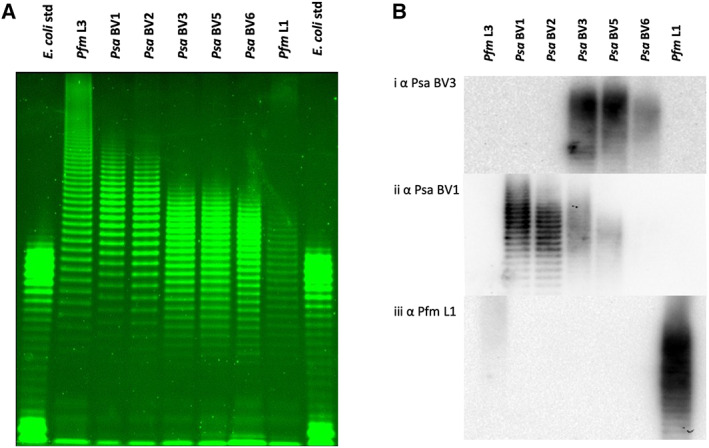
LPS profiles of Pseudomonas syringae pv. actinidiae (Psa) and P. syringae pv. actinidifoliorum (Pfm).
A. Pro‐Q™ Emerald 300 staining of lipopolysaccharide (LPS) preparations on a NuPAGE 4%–12% gradient bis‐tricine SDS gel from representatives of Pfm lineages (L3 ICMP 18807, lane 2; L1 ICMP 18803, lane 8), Psa biovars (BV1 ICMP 9617, lane 3; BV2 ICMP 19071, lane 4; BV3 ICMP 18884, lane 5; BV5 MAFF212063, lane 6; BV6 MAFF 212141, lane 7), with Escherichia coli standards (Std; lanes 1 and 9). A total of 0.5–15 μl LPS extract for each sample (normalized by trial runs) was applied per lane.
B. Western blot of LPS extracts from representatives of Psa biovars and Pfm lineages run on a NuPAGE 4%–12% gradient bis‐tricine SDS gel, obtained by probing with polyclonal antibodies to Psa BV3 ICMP 18884 (Bi), Psa BV1 ICMP 9617 (Bii), or Pfm L1 ICMP 18803 (Biii) in a 5000:1 ratio.
Purified polyclonal antibodies against LPS from Psa and Pfm do not cross react
Western blots of the various LPS preparations from isolates of Psa and Pfm were probed with each affinity‐purified polyclonal antibody preparation (Fig. 2B). All affinity‐purified polyclonal antibodies showed a high degree of specificity, with little cross‐reactivity against closely related isolates. The anti‐Psa BV3 antibody preparation was the most specific, reacting with BV3, BV5, and only weakly to BV6 LPS (Fig. 2Bi). The weak binding to the Psa BV6 LPS and the slightly different Psa BV6 LPS profile (Fig. 2A) suggest a subtle difference in the CPA decoration. There was no cross‐reactivity of the Psa BV3 antibody to the Psa BV1, BV2, or Pfm LPS preparations (Fig. 2B). The lack of binding of the anti‐Psa BV3 antibody to Pfm L1 LPS (which has an electrophoretic profile more similar to BV3 LPS than Pfm L3) is likely due to the fact that antibodies that bind to epitopes shared by both BV3 and PfmL1 were depleted by the affinity chromatography purification process used. The anti‐BV1 antibody preparation reacted strongly with both Psa BV1 and BV2 LPS, as expected based on the close genetic identity between their TET loci (Fig. 2Bii). There was also weak cross‐reactivity of Psa BV1 with Psa BV3 and BV5 LPS preparations (Fig. 2Bii). Interestingly, the Pfm L1 antibody had a slight cross‐reactivity with Pfm L3 but not with the Psa isolates in the same grouping (Fig. 2Biii). This may be due to side‐chain modifications that are common between the two CPA polysaccharides. These results further support the different grouping of LPS between these strains but also indicate that antibody specificity is influenced by both backbone structure and side‐chain decorations.
The TET operon determines the variability of LPS banding in Psa
To confirm whether the TET operon, expressing the ABC transporter (wzt), putative oligosaccharide chain elongation GT (wbdA), and the o‐methyltransferase (wbdD), are responsible for the different LPS profiles, this operon was deleted in Psa BV1 (Fig. 3A; dark green region, Supporting Information Fig. S2) and replaced with that from Psa BV3 (Fig. 3A, blue region, Supporting Information Fig. S2). The Psa BV1 TET operon knock‐out (ΔLPS KO) lacked LPS and possessed a rapid sedimentation phenotype, but had a very weak R‐LPS colony morphology, as observed for the BV3 mutants (Fig. 3B; Supporting Information Figs. S3A and S4). Psa BV1 with the BV3 LPS knocked back in (four knock‐in lines, ΔLPS + LPS_BV3 #1–2, #1–4, #2–1, and #2–5), but not for the KO revertants that failed to retain this region (e.g. #1–3), restored these LPS‐associated phenotypes (Fig. 3B, Supporting Information Figs. S3A, B and S4). Furthermore, the LPS profile was identical to that of wild‐type BV3, proving this locus codes for the genes involved in generating the BV‐specific LPS oligosaccharide ladder. A Western blot of the LPS gel of these strains was probed with the Psa BV3 antibody (Fig. 3C), which showed that transfer of the TET locus from Psa BV3 to the Psa BV1 ΔLPS KO also transferred the antibody specificity. In summary, this genetic TET‐swap analysis provided direct evidence that these genes were necessary and sufficient for the differences in LPS between these strains.
Fig. 3.
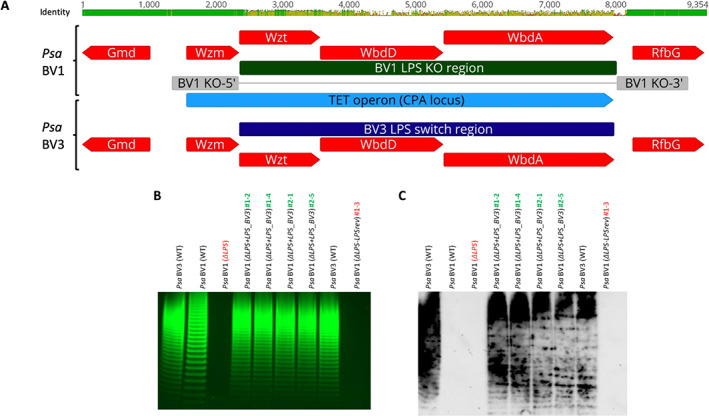
Effects of CPA TET operon swap on LPS banding and immunological recognition in Pseudomonas syringae pv. actinidiae (Psa).
A. Genetic polymorphism of the TET operon for Psa BV1 (ICMP 9617) versus BV3 (ICMP 18884). DNA sequences were aligned in Geneious v11. Nucleotide identity is shown on the top bar, the TET operon is annotated in light blue, coding sequences in red with predicted biochemical function indicated, the original TET operon from BV1 indicated in dark green with upstream (KO‐5′) and downstream (KO‐3′) regions for generating the LPS TET operon knock‐out in grey, and the TET operon swap region by knock‐in from BV3 indicated in dark blue.
B. LPS profiles of Psa BV3 (lane 1 and lane 8), BV1 (lane 2), BV1 TET operon knockout (ΔLPS; lane 3), four BV1‐to‐BV3 TET operon knock‐in complemented isolates (ΔLPS + LPS_BV3 #1–2, #1–4, #2–1, and #2–5; lanes 4–7), and one BV1 revertant to knock‐out isolates (ΔLPS‐LPSrev #1–3; lane 9). Pro‐Q™ Emerald 300 staining of LPS preparations on a 4%–12% gradient Tris‐glycine SDS gel. LPS extract (15 μl) for each sample was applied per lane.
C. Immuno‐blot of LPS extracts from wild‐type, knock‐out (KO), KO‐complemented, and KO‐revertant strains run on a gradient SDS‐PAGE gel as for (B), probed with polyclonal antibodies to Psa BV3 in a 5000:1 ratio.
LPS is required for full pathogenicity of Psa in kiwifruit plantlets
Previously, LPS mutations have been found to affect host colonization by P. syringae (Kutschera et al., 2019a). To investigate the role of LPS in the virulence or pathogenicity of Psa, we infected kiwifruit plantlets with Psa BV3 R‐LPS Tn5 mutants (ΔwbpL, Δwzm, ΔwbdD, Δwzt, and Δgmd) (Mesarich et al., 2017) and the Psa BV1 knock‐out (ΔLPS), two knock‐in (ΔLPS + LPS_BV3 #1–4 and #2–1) and two knock‐out revertant (ΔLPS‐LPSrev #1–3 and #2–4) mutants, along with their wild‐type counterparts. All LPS mutants showed at least a log reduction in growth in planta compared to wild‐type strains, indicating that LPS is required for full host colonization (Fig. 4A and B) and symptom development (Supporting Information Fig. S5A and B). Meanwhile, the knock‐in BV1ΔLPS + LPS_BV3 strains with complemented LPS production restored wild‐type growth to the ΔLPS mutant (Fig. 4B; Supporting Information Fig. S5B) and this did not occur in the strains that had reverted to ΔLPS.
Fig. 4.
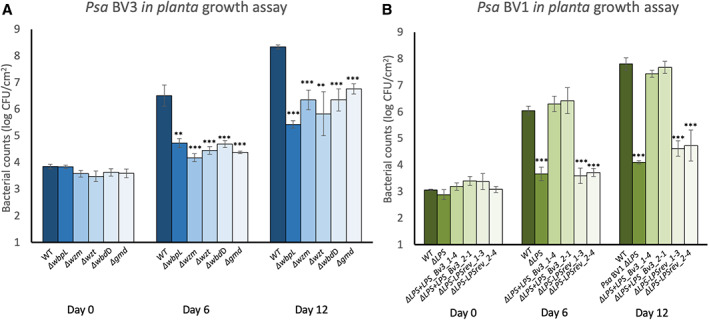
The CPA TET operon is required for full pathogenicity of Pseudomonas syringae pv. actinidiae (Psa) in host plants.
A. Psa BV3 or BV3 R‐LPS mutants (Mesarich et al., 2017) were flood‐inoculated at ~5 × 10⁶ CFU/ml on Actinidia chinensis var. chinensis ‘Zesy002’, and bacterial growth was determined at 0, 6, and 12 days post‐inoculation. Error bars represent standard error of the mean from four pseudo‐biological replicates. Asterisks indicate results of Student's t‐test between selected sample and wild type; **P < 0.01, ***P < 0.001). The experiment was conducted three times with similar results.
B. Psa BV1, BV1 LPS knock‐out mutant (ΔLPS), two independent BV1 knock‐outs complemented by knock‐in with LPS from BV3 (+LPS_BV3 #1‐4 and #2‐1), and two independent BV1 revertant‐to‐knock‐out LPS (‐LPSrev #1‐3 and #2‐4) were flood‐inoculated at ~5 × 10⁶ CFU/ml on A. chinensis var. chinensis ‘Hort16A’, and bacterial growth was determined at 0, 6, and 12 days post‐inoculation. Error bars represent standard error of the mean from four replicates. Asterisks indicate results of Student's t‐test between selected sample and wild type (Psa BV3); ***P < 0.001. The experiment was conducted twice with similar results.
The TET operon from P. syringae isolates is highly variable but correlates with LPS
Having identified the TET operon in P. syringae, we set out to investigate this operon in a range of isolates the P. syringae species complex and closely related plant‐associated Pseudomonas species. In P. syringae, the composition of the CPA backbone (d‐ and/or l‐Rha), the number of sugars in the repeat, and the bonds linking the sugars within the oligosaccharide, vary between different P. syringae isolates (Ovod et al., 1997a; Zdorovenko and Zdorovenko, 2010). BLASTx and conserved domain database (CDD) searches identified the CPA locus in other P. syringae pathovars and epiphytic isolates. We also included several P. viridiflava isolates (See Supporting Information Table S1 for details of all isolates analysed). Comparison of these loci revealed variation in the sugar biosynthetic pathways comprising the CPA locus, including the TET operon (Supporting Information Fig. S6). In some P. syringae isolates, the GT and o‐methyltransferase genes were fused (Supporting Information Fig. S6). The TET operon showed a high degree of sequence variation between P. syringae pathovars and isolates. Variation in CPA sugar biosynthetic pathways and the sequence divergence of the TET operon made the identification of this region in P. syringae challenging, but as noted previously, the CPA locus was consistently located adjacent to genes encoding a chemotactic receptor, DnaJ molecular chaperone and a tRNA‐Met (Fig. 1A). A gene encoding an integrase was often located adjacent to the tRNA‐Met in an orientation reminiscent of an integron (Domingues et al., 2012; Gillings, 2014). Given that tRNAs are often sites for integration of mobile elements, this might explain the modular and variable nature of the CPA locus in P. syringae. However, a canonical integron structure was not found using programs such as integron finder (Cury et al., 2016).
Phylogenetic analysis of the concatenated proteins from the TET operon generated a tree with five main clades (including the two clades identified in Psa and Pfm), each representing different sets of alleles of this operon from the P. syringae and P. viridiflava species complexes (Fig. 5A). As observed with Psa and Pfm isolates, the topology of the tree made from these sequences is very different from the corresponding tree generated from five core genes (gyrB, rpoA, gapA, pgi, acnD) from the respective genomes (Supporting Information Fig. S1). This indicates that the TET operon has an evolutionary history driven by recombination or horizontal gene transfer that is distinct from the evolution of the core genome.
Fig. 5.
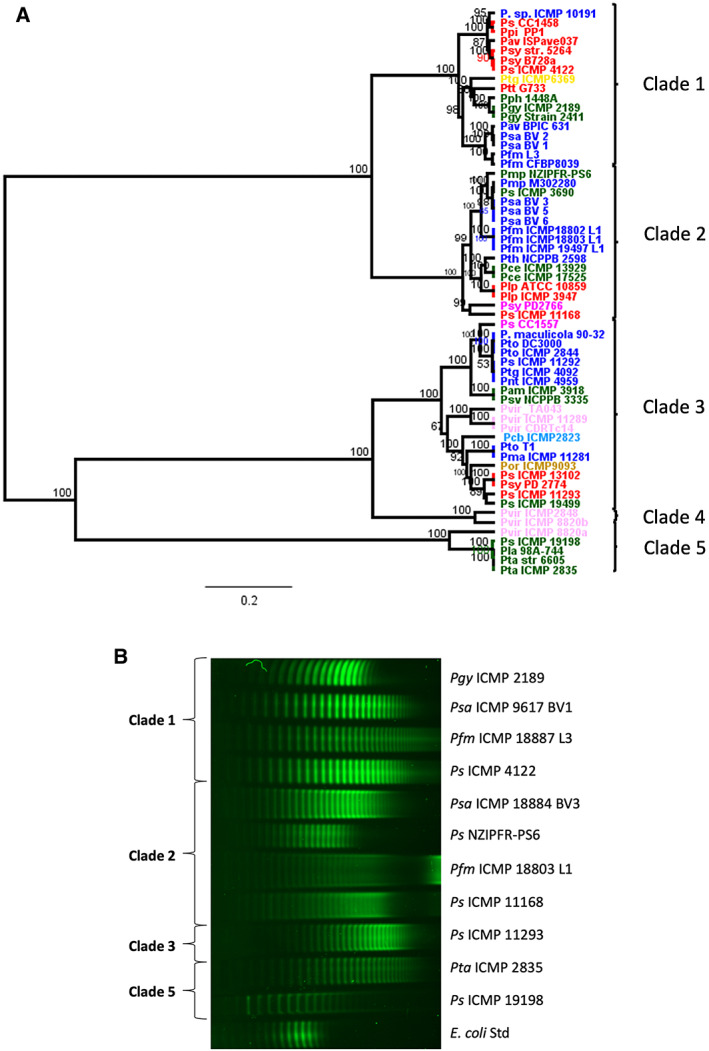
A. Phylogenetic comparison of TET operons from various Pseudomonas syringae strains. Amino acid sequences from three proteins of the CPA locus (Wzt, WbdD and WbdA) were aligned in Geneious v11 and neighbour‐joining phylogenetic trees built for their TET operons. Strains were grouped into numbered clades as indicated. Strains are coloured according to their core genome phylogenies as previously described (Dillon et al., 2019b): phylogroup 1 blue; phylogroup 2 red; phylogroup 3 green; phylogroup 4 orange; phylogroup 5 light‐blue; phylogroup 6 yellow; phylogroup 7 pink; phylogroup 10 mauve.
B. LPS profiles of Pseudomonas syringae representing phylogenetic clades for the TET operon. Pro‐Q™ Emerald 300 staining of lipopolysaccharide (LPS) preparations on a 4%–12% gradient Tris‐glycine SDS gel from representatives of P. syringae strains from Supporting Information Table S1 (top to bottom, lanes 1–11), with Escherichia coli control (Std, lane 12). Banding patterns were grouped into clades on their designations from (A). A total of 2–15 μl LPS extract for each sample (normalized by trial runs) was applied per lane.
Since genetic variation in the CPA between even closely related isolates of Psa and Pfm is reflected in different LPS profiles, we performed a broader analysis of LPS profiles across different clades of P. syringae (Fig. 5A). Eleven isolates of P. syringae were chosen, representing four TET operon phylogenetic clades. The banding patterns were different for all isolates, but similarity within clades was observed. Notably, the spacing between bands was clearly similar within clades but varied between them (Fig. 5B). Interestingly, the range of molecular weights of different LPS molecules within clades was highly variable, suggesting the efficiency of the chain terminating enzyme (WbdD) varies within a clade. While considerable variability has been demonstrated in P. syringae CPA, the functional relevance of this is less well understood.
Correlation between tailocin sensitivity and TET operon variability
Like phages, many R‐type syringacins (tailocins) use LPS as a receptor. Recently the R‐syringacin killing and sensitivity spectra for a diverse range of P. syringae isolates were characterized (Baltrus et al., 2019). A feature of both spectra is that dendrograms generated from the killing and sensitivity matrices do not match MLST phylogenetic trees (Baltrus et al., 2019). Since LPS is a likely receptor for R‐syringacins, we hypothesized that there might be a correlation between the patterns of variation in tailocin sensitivity within P. syringae isolates and the genetic variation in the TET operon responsible for the structure of the CPA backbone.
To test this hypothesis, we generated a UPGMA phylogenetic tree from the TET operons from 29 of the isolates tested for tailocin killing and sensitivity by Baltrus et al. (2019). This was compared to a hierarchical clustering tree generated from the sensitivity profile of the same isolates using a tanglegram (Fig. 6A). Tanglegrams compare phylogenetic trees to determine how similar they are and correlation coefficients can be calculated from the similarity between different pairs of trees (Galili, 2015). The correlation coefficient between the sensitivity and TET operon trees was 0.987, indicating a high degree of congruence (Supporting Information Fig. S7). Both trees comprise two main clades, and there was a 100% correlation among the isolates between the clades in both trees. In contrast, tanglegrams between either the sensitivity profile or the TET operon and an MLST phylogenetic tree had low correlation coefficients of 0.011 and −0.003, respectively, indicating poor congruence (Fig. 6B and C; Supporting Information Fig. S7). These results suggest a strong relationship between tailocin sensitivity and the structure of the CPA oligosaccharide of LPS in P. syringae. They provide further evidence that LPS is a tailocin receptor in P. syringae, explaining the complex host range observed for these proteins (Baltrus et al., 2019) and providing a plausible explanation for the diversification pattern of these loci.
Fig. 6.
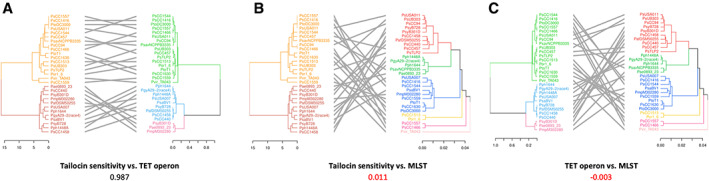
Tanglegram comparison of tailocin sensitivity, TET operon, and core gene MLST phylogenies.
A. Tanglegram of sensitivity matrix phylogeny (left) and TET operon phylogeny (right).
B. Tanglegram of sensitivity matrix phylogeny (left) and core gene MLST phylogeny (right).
C. Tanglegram of TET operon phylogeny (left) and core gene MLST phylogeny (right). Hierarchical clustering analysis using the ward.D2 method was used to build a tailocin sensitivity phylogeny from the sensitivity matrix provided in the study by Baltrus et al. (2019), which is transposed from a syringacin killing matrix. The TET operon phylogeny was produced by using the TET operon genome sequences of selected strains, assembled into a phylogeny using the UPGMA clustering method, as was the MLST phylogeny. The co‐phenetic entanglement coefficients for each comparison are indicated below each panel title. Axes in each panel represent Euclidean distance. Colours represent broad clade groupings, with the cut‐offs being Euclidean distances of 10, 0.5, and 0.02 for the sensitivity, TET, and MLST phylogenies respectively. This Euclidean cut‐off for the MLST branches allows representative separation by phylogroup for the strains used.
Discussion
LPS is a highly complex macromolecule located on the surface of the bacterial cell wall that interfaces with the environment and other organisms. It is often used as a receptor or ligand for recognition by other bacteria, phages, bacteriocins and the defence system of host organisms. LPS is made up of a modular structure that can generate structural variability, particularly in the OPS, which can help bacteria resist parasitic organisms, toxins and host defences (King et al., 2009). The structure and function of LPS from human and animal bacterial pathogens have been explored in depth where it has been shown that LPS interacts directly with the host immune system and hence immunity is a strong driver for genetic variation at loci coding for LPS (Lerouge and Vanderleyden, 2002; Maldonado et al., 2016).
In contrast, the role of LPS in plant‐pathogenic and epiphytic bacteria is less clear. In this study, we have identified the CPA locus in Psa and shown it is responsible for the biosynthesis of the predominant OPS in P. syringae. The locus is highly modular with operons predicted to be involved in the biosynthesis of various sugars, although only those for l‐Rha and d‐Rha have been convincingly identified through similarity at the protein level. The TET operon that codes for proteins involved in the polymerization and transport of the backbone oligosaccharide through the inner membrane was also identified for the first time in P. syringae. The TET operon was present in the majority of P. syringae and P. viridiflava CPA loci examined. Phylogenetic analysis of three of the proteins in the TET operon revealed five distinct clades, which most likely reflect the different repeating unit structures of the CPA Rha‐backbone oligosaccharide. There are two elements that contribute overall to the structural variability of the CPA in P. syringae. One is the nature of the backbone oligosaccharide, which can be tri‐ or tetra‐saccharides of either d‐Rha, l‐Rha or both, linked by α1‐2, α1‐3, or β1‐4 bonds (Ovod et al., 1997a). The other is the side‐chain decoration, which is usually a single sugar residue attached by a variety of different linkages. In addition, acetylation is a common back‐bone modification. Unfortunately, it is not possible to directly correlate the considerable structural data known about P. syringae LPS accurately with the clades resolved in Fig. 5A because the isolates for which structural LPS information is known are not those that have been sequenced (Zdorovenko and Zdorovenko, 2010).
The mechanism by which the different operons within the CPA locus are shuffled between P. syringae isolates to generate the observed structural variability could occur via homologous recombination or insertion via an integron‐like cassette. The structure of the CPA locus in Psa BV3 resembles that of an integron, although an intact phage‐like integrase adjacent to the tRNA‐Met was not present in all other P. syringae isolates. In addition, a classic integron promoter and attC insertion sequences were not found using programs such as integron finder. The presence of operons from P. viridiflava in the phylogenetic trees suggest that the mechanism of recombination between isolates is not exclusive to the P. syringae species complex, but also includes other closely related species such as P. viridiflava that share the same ecological (plant‐associated) niche. There did not appear to be any obvious geographical bias for any of the CPA clades. While this study is unlikely to be an exhaustive identification of TET operon variants, a significant proportion of available P. syringae whole genome sequences collected from isolates from a wide range of geographical locations were analysed. Since members of four clades were isolated recently from kiwifruit in New Zealand, the TET operon alleles identified are likely to be ubiquitous among P. syringae populations.
The variation at the TET locus is also reminiscent of that at the capsule locus within the Klebsiella pneumoniae clonal group 258 (Wyres et al., 2015). In this case, it has been shown that extensive intra‐clonal variation at the capsule polysaccharide synthesis locus is mediated by large‐scale recombination events. This has been responsible for generation of the 78 immunologically distinct capsule variants which have been described in K. pneumoniae (Wyres et al., 2015). A similar mechanism may explain the variation observed for the TET operon and CPA locus in P. syringae.
Tailocins are a subset of bacteriocins derived from phage tail proteins that have been co‐opted by host bacteria as a means for killing closely related bacterial isolates occupying the same ecological niche (Ghequire and De Mot, 2015). What has been demonstrated recently within P. syringae is the depth and complexity of both the killing and sensitivity spectra generated from a wide range of isolates (Baltrus et al., 2019). While it is clear that LPS is a receptor for some tailocins ( Kutschera et al., 2019a; Kandal et al., 2020), a link between the sensitivity to tailocins and the structural variation in LPS has not been demonstrated until recently. Carim et al. (2020) have shown within the genus Pseudomonas that OSA composition and display are the most important contributors to tailocin sensitivity. Our results also indicate a strong but not perfect relationship between tailocin sensitivity and CPA within P. syringae. This suggests that killing by tailocins (and by inference infection by phages) may drive diversity in LPS structure in the wider P. syringae population. It appears less likely that recognition by plant defences is selecting for variation at the CPA locus. Instead, it has been shown that a medium chain 3‐hydroxyl fatty acids of the lipid A molecule of LPS is detected by the plant pathogen associated molecular pattern receptor LORE (Kutschera et al., 2019b). It is interesting to note that the genetic variation driving differences at both the CPA locus and the tailocin killing spectrum in P. syringae appears to be mediated by localized recombination events (Baltrus et al., 2019).
As has been reported previously for other P. syringae LPS mutants (Kutschera et al., 2019a; Kandel et al., 2020), those in both the Psa BV3 and BV1 backgrounds displayed significantly reduced in planta growth compared to their wild‐type strains at both 6‐ and 12‐days post‐inoculation (Fig. 4). The aggregation of LPS knockout isolates in solution may also affect the motility of these mutants in planta and could be responsible for reduced pathogenicity. Alternatively, LPS mutants may be more sensitive to host antimicrobial compounds. Although mutants lacking LPS have been shown to be highly resistant to particular bacteriophages and/or tailocins, the loss of pathogenicity probably ensures that strains completely lacking LPS are strongly selected against in planta (Kandel et al., 2020).
These findings, firstly that LPS is a trait conferred by a predictable locus, and secondly that LPS is required for pathogenicity, offer intriguing possibilities for a durable disease resistance program using bacteriophage/tailocin‐mediated control. While the locus is open to recombination, the identification of the population of TET operon alleles present on a plant species may facilitate the development of a comprehensive mixture of bacteriophage/tailocin that covers the most common alleles to be deployed to increase efficacy and durability of this treatment by circumventing escape through recombination at the TET operon locus.
Experimental procedures
Bacterial isolates used in this study
Metadata for the bacterial isolates and genomes used in this study are listed in Supporting Information Table S1. Lysogeny broth (LB), and M9 minimal media (M9) (Sambrook and Russell, 2001) were supplemented with agar 1.5% (w/v) and 50 μg/ml kanamycin (Km) where required. Escherichia coli and Pseudomonas isolates were routinely cultured at 37°C and 28°C respectively. All kits and reagents were used, except where specified, in accordance with the manufacturer's instructions.
Bioinformatics
Bioinformatics analysis was carried out using the Geneious v11 platform (www.geneious.com). For unannotated genomes, the RAST pipeline was used for gene calling (Aziz et al., 2008). GenBank searches were carried out using BLAST (Boratyn et al., 2013). Sequences were searched for attI and attC motifs using Integron Finder https://github.com/gem-pasteur/Integron_Finder (Cury et al., 2016).
LPS purification
For small‐scale preparations of LPS, the hot‐phenol method was used (Westphal and Jann, 1965). Overnight bacterial cultures were resuspended in 500 μl phosphate‐buffered saline (ThermoFisher Scientific, MA, USA) to an A600 of between 2 and 5. An equal volume of Tris‐saturated phenol (Sigma‐Aldrich, Mo, USA, P4557) was added and the sample was incubated at 68°C for 90 min with intermittent vortexing. The supernatant was sequentially treated with DNase I (37°C) and RNase (65°C), each for 1 h. The samples were treated with phenol/chloroform/isoamyl alcohol, followed by chloroform/isoamyl alcohol and stored at −20°C. To generate antigen used for immunization and polyclonal antibody generation, large‐scale extraction of LPS from Psa BV1 and BV3, and Pfm L1 was performed using the hot‐phenol method of Maier and Brill (1978). Cells were harvested in late exponential phase, collected by centrifugation and freeze‐dried for storage at −20°C.
LPS were resolved using 4%–12% premade NuPAGE™ Bis‐Tris SDS gels on a Novex system with MOPS as the running buffer. Gels were stained using the Pro‐Q™ Emerald 300 Lipopolysaccharide Gel Stain Kit (Molecular Probes, OR, USA). For Western blotting, gels were transferred to a polyvinylidene difluoride (PDVF) membrane (Millipore, Burlington, MA, USA). The anti‐Psa antibodies (see below) were used at 1:5000 dilution and the Anti‐Rabbit IgG‐Peroxidase antibody (Sigma‐Aldrich, St Louis, MO, USA) was used at 1:10 000 dilution. Chemiluminescence was developed using the Clarity Max Western ECL (Bio‐Rad, Hercules, CA, USA).
Production of antibodies to Psa biovars
Heat‐killed cells from Psa BV1 (ICMP 9617), Psa BV3 (ICMP 18884), and Pfm L1 (ICMP 18803) in Freund's complete adjuvant were each used to individually immunize two rabbits by subcutaneous injection of 108 cells. Rabbits were rested for 4 weeks and immunized every 2 weeks by three further injections. Blood was collected 1 week after the last injection, and rabbit IgG was purified from serum using ammonium sulphate fractionation and protein‐A sepharose chromatography (Ey et al., 1978). These polyclonal antibodies were further purified by affinity chromatography through matrices attached to LPS extracted from the above isolates not used for immunization in each of the three cases. The aim of this step was to remove antibodies that bound to antigens in common with other isolates, to give an isolate‐specific polyclonal antibody preparation. For example to purify antibodies specific for Psa BV3, IgG were passed through affinity columns with LPS from Psa BV1 and Pfm L1. For preparation of the matrices LPS was dissolved in buffer and oxidized using periodate. Excess periodate was removed by gel filtration using a PD10 column. Oxidized LPS was reacted with biotin hydrazide to biotinylate the LPS as per method sheet 28 020 (Thermo Fisher). LPS matrices for affinity chromatography were prepared by attachment of biotin‐LPS to streptavidin‐labelled sepharose columns. Biovar‐specific LPS antibodies were purified by standard affinity chromatography as described by the manufacturer (GE Life Sciences, PA, USA).
LPS locus knock‐out and knock‐in
To generate the LPS TET operon (wzt – wbdA; ~5.3 kb) deletion in Psa BV1 (ICMP 9617), a modified pK18mobsacB vector‐based method was utilized (Kvitko and Collmer, 2011). DNA fragments containing the upstream (~1 kb) and downstream (~1 kb) regions of the LPS knock‐out region were amplified using PCR with primer pairs PsaJ_LPS‐KO_UP‐F/PsaJ_LPS‐KO_UP‐R and PsaJ_LPS‐KO_DN‐F/PsaJ_LPS‐KO_DN‐R, respectively, with the UP‐R and DN‐F primers carrying added XbaI restriction enzyme sites (Supporting Information Table S2). Each PCR fragment was gel‐purified using an EZNA gel extraction kit (Custom Science, Auckland, NZ, USA) and digested with XbaI, re‐purified with an EZNA PCR product purification kit and ligated (to the XbaI‐cut overhangs) to form a 2 kb KO fragment. The 2 kb fragment containing both the upstream and downstream fragments for the KO region was then re‐amplified by PCR using primers PsaJ_LPS‐KO_UP‐F and PsaJ_LPS‐KO_DN‐R. This PCR product was cloned into the Eco53kI blunt‐end restriction enzyme site of pK18mobsacB that had first been mutagenized to remove the non‐MCS Eco53kI site to generate pK18BΔE (Schafer et al., 1994). The pK18BΔE vector carrying the ~2 kb KO fragment, called pΔLPS, was transformed into E. coli DH5α, plated on X‐gal/IPTG/kanamycin LB agar for blue/white selection. Positive transformants were confirmed by Sanger sequencing (Macrogen, Seoul, South Korea). Psa BV1 was electroporated with the pΔLPS construct and transformants were selected on LB agar with nitrofurantoin, cephalexin and kanamycin. Selected colonies were subsequently streaked onto LB agar containing 10% (w/v) sucrose to counter‐select plasmid integration, forcing removal of the sacB gene, resulting in either revertants to wild‐type or knock‐outs. KOs were confirmed using colony PCR with primers PsaJ_LPS‐KO_Check‐F and PsaJ_LPS‐KO_Check‐R, with PCR products sent for Sanger sequencing with the nested cloning PsaJ_ LPS ‐KO_UP‐F and PsaJ_ LPS ‐KO_DN‐R primers, as well as using internal gene‐specific primers. Selected colonies were also plated on kanamycin‐containing medium to confirm loss of the plasmid backbone containing kanamycin resistance and the sacB gene.
To clone the knock‐in (KI) construct of the Psa BV3 LPS TET operon for complementation of the Psa BV1 LPS TET operon knockout (Psa BV1 ΔLPS), the golden gate cloning system was used (Engler et al., 2009). Firstly, the destination vector was generated by restriction digestion using AseI and NheI of pK18mobsacB to remove the multiple cloning site (MCS). This was replaced with a golden gate‐compatible (BsaI restriction enzyme site‐flanked) MCS from pICH86988 using In‐Fusion cloning according to kit instructions (Takara Bio, USA) to generate a golden gate cloning‐compatible version of the pK18mobsacB vector; pK18B‐GG. The pK18B‐GG vector was transformed into E. coli DH5α, plated on kanamycin LB agar and screened by BsaI restriction digest. Positive transformants were confirmed by Sanger sequencing (Macrogen, South Korea). Entry‐level vectors for the LPS‐KI construct were generated for the LPS region from Psa BV3 (ICMP 18884), divided into four modules (modules 1–4), with overlap‐fusions of the upstream (5′) and downstream (3′) regions of the Psa BV1 ΔLPS (for modules 1 and 4, respectively, with modules made by overlap PCR) and an additional module 5 for the downstream region of the Psa BV1 ΔLPS by PCR‐amplification. These were cloned into pICH41021 with the cloning primers (Supporting Information Table S2) designed to synonymously mutate internal BsaI, Eco53kI, and PstI restriction enzyme sites (Supporting Information Fig. S2). These five LPS‐KI modules in pICH41021 were then single‐pot cloned (by golden gate assembly) into destination pK18B‐GG to generate the LPS‐KI vector: pLPSbv3. The pLPSbv3 vector was transformed into E. coli DH5α, plated on kanamycin LB agar and screened by nested colony PCR for correct assembly. Positive transformants were confirmed by Sanger sequencing (Macrogen). Psa BV1 ΔLPS was transformed with pLPSbv3 and transformants were selected on LB agar with nitrofurantoin, cephalexin and kanamycin. Selected colonies were subsequently streaked onto LB agar containing 10% (w/v) sucrose to counter‐select plasmid integration, resulting in revertants to knock‐out or LPS‐complemented mutants. Complementation knock‐in mutants were screened using colony PCR with primers for PsaJ_LPS‐KO_Check‐F and PsaJ_LPS‐KO_Check‐R, as well as gene‐specific primers and sent for Sanger sequencing. Complemented knock‐in mutants (ΔLPS + LPS_BV3) and non‐complemented knock‐out revertants (ΔLPS‐LPSrev) were further confirmed by plating on kanamycin‐containing agar to confirm loss of the sacB gene.
In planta growth and symptomology of Psa
Psa infection assays were based on those published previously with some modifications (McAtee et al., 2018). A. chinensis Planch. var. chinensis ‘Zesy002’ or ‘Hort16A’ plantlets, grown from axillary buds on Murashige and Skoog rooting medium without antibiotics in sterile 400‐ml plastic tubs (pottles) with three plantlets per pottle, were purchased (Multiflora, Auckland, NZ). Plantlets were kept at 20°C under Gro‐Lux fluorescent lights under long‐day conditions (16 h light:8 h dark) and used when the plantlets were between 10 and 14 weeks old. Overnight liquid cultures of wild‐type or mutant strains of Psa were pelleted at 6000 g, re‐suspended in 500 ml of 10 mM MgSO4 to an A600 = 0.05 (~5 × 10⁶ CFU/ml, determined by plating). The surfactant Silwet™ L‐77 (Lehle Seeds, Round Rock, USA) was added to the inoculum at 0.0025% (v/v) to facilitate leaf wetting. Pottles of ‘Zesy002’ or ‘Hort16A’ plantlets were filled with the inoculum, submerging the plantlets for 3 min, drained, sealed, and then incubated under previously described plant growth conditions. To assess in planta growth, leaf samples of four leaf discs per replicate, removed with a 1‐cm diameter cork‐borer, were taken at 2 h (day 0), day 6, and day 12 post‐inoculation. All four pseudo‐biological replicates per treatment were taken from the same pottle. To estimate Psa growth inside the plant, the leaf discs were surface sterilized, placed in Eppendorf tubes containing three sterile stainless‐steel ball bearings and 350 μl 10 mM MgSO4, and macerated in a Storm 24 Bullet Blender (Next Advance, NY, USA) for two bursts of 1 min each at maximum speed. A 10‐fold dilution series of the leaf homogenates was made in sterile 10 mM MgSO4 until a dilution of 10−8 and each dilution was plated as 10 μl droplets on LB agar supplemented with nitrofurantoin and cephalexin. After 2 days of incubation at 20°C, the CFU per cm2 of leaf area was ascertained from dilutions. To observe disease symptoms on the plants, infected pottles were kept up to 50 days post‐inoculation and photographs taken of whole pottles and a representative infected leaf. Infection severity was qualitatively assessed based on typical symptoms (in order of increasing severity): chlorotic haloes, necrotic leaf spots, leaf death, and plant death. Each of these growth assay experiments were conducted at least three times.
Hierarchical clustering and dendrogram analysis
Hierarchical cluster analysis was conducted in R (R‐CoreTeam, 2018) using the ward.D2 method, as per the clustering analysis in the study by Baltrus et al. (2019). The ‘phylogram’ vignette was used to convert hierarchical clusters into dendrograms (Paradis and Schliep, 2018). The tanglegram function in the ‘dendextend’ package was used to visually compare dendrograms by connecting matching leaf node labels with lines (Galili, 2015). The ladder function was used to untangle dendrograms by rotating the tree branches at their nodes without altering their topology, allowing for clear visualization (Galili, 2015). The cor.dendlist function was used to calculate the cophenetic correlation coefficient for the compared dendrograms (Galili, 2015). Cophenetic correlation values (correlation coefficients) range from −1 to 1, with values close to 0 indicating that the compared dendrograms are not statistically similar. The resulting cophenetic correlation matrix was then visualized using the ‘corrplot’ package (Wei and Simko, 2017).
Supporting information
Fig. S1. MLST genome phylogenetic tree for Pseudomonas syringae and Pseudomonas viridiflava strains. Five genes (gyrB, ropD, gapA, pgi and acnB) from selected representatives of P. syringae phylogroups were concatenated and aligned in Geneious v11 and neighbour‐joining phylogenetic trees built. Strains grouped as expected into their phylogroups and are coloured according to their core genome phylogenies as previously described (Dillon et al., 2019b): phylogroup 1 blue; phylogroup 2 red; phylogroup 3 green; phylogroup 4 orange; phylogroup 5 purple; phylogroup 6 yellow; phylogroup 7 pink; phylogroup 9 grey; phylogroup 10 mauve; phylogroup 11 chocolate; phylogroup 13 claret.
Fig. S2. Schematic for knock‐out and knock‐in swap of the TET locus in Pseudomonas syringae pv. actinidiae (Psa) BV1. One‐kilobase flanking regions upstream (UP) and downstream (DN) of the polymorphic region of the TET operon in wild‐type (WT) Psa BV1 (green; encoding Wzt, WbdD, and WbdA proteins in red) were PCR‐cloned and fused at a primer‐introduced internal XbaI site and used in pK18mobsacB vector‐mediated knock‐out of the BV1 TET locus to generate BV1_LPS‐KO. To generate the BV1‐to‐BV3 LPS swap (knock‐in complementation), a pK18mobsacB vector‐mediated method was also used. First, Eco53kI, BsaI and PstI sites were removed during PCR (primer‐driven) to facilitate blunt‐end cloning of modules, golden gate (GG) cloning, and evasion of the BV1‐encoded restriction enzyme, respectively. The knock‐in pK18mobsacB vector was built (GG assembly) from five modules with sizes indicated. Modules 2, 3, and 5 were PCR‐amplified and blunt‐end cloned into pICH41021 shuttle vector directly. Modules 1 and 4 were first cloned as two parts (A and B) from their respective Psa BVs and then fused by overlap PCR mediated by primer sequences designed to introduce overlap regions during amplification of part A and B. Following overlap PCR, modules 1 and 4 were blunt‐end cloned into the pICH41021 shuttle vector. The modules were then assembled into the final pK18mobsacB knock‐in construct. The BV1_LPS‐KO was then subsequently complemented with TET operon from BV3 (blue).
Fig. S3. Bacterial cell sedimentation for Pseudomonas syringae pv. actinidiae (Psa) in inoculation buffer. (A) Psa BV3 and two R‐LPS mutants, ΔwbpL and Δgmd (Mesarich et al., 2017) were grown overnight in LB liquid culture, pelleted by centrifugation, resuspended in 10 mM MgSO4 buffer, and normalized to OD600 of 0.4. (B) Psa BV3 and BV1 (wild‐type; WT), Psa BV1 LPS knock‐out (ΔLPS), four BV1‐to‐BV3 TET operon‐complemented knock‐in isolates (ΔLPS + LPS_BV3 #1–2, #1–4, #2–1, and #2–5; green), and four BV1 revertant to knock‐out isolates (ΔLPS‐LPSrev: #1–3, #1–6, #2–4, and #2–8; red) were grown overnight in LB liquid culture, pelleted by centrifugation, resuspended in 10 mM MgSO4 buffer, and normalized to OD600 of 0.5. Photographs of cell suspensions in both (A) and (B) were taken immediately after resuspension in buffer (T0) and after an hour standing at room temperature (T1).
Fig. S4. Colony morphologies for Pseudomonas syringae pv. actinidiae (Psa) BV1 mutant and complemented strains. Psa BV3 mutants (ΔwbpL or Δgmd) (Mesarich et al., 2017) and BV1 (wild‐type; WT), Psa BV1 LPS knock‐out (ΔLPS), four BV1‐to‐BV3 TET operon complemented knock‐in isolates (ΔLPS + LPS_BV3 #1–2, #1–4, #2–1, and #2–5; green), and four BV1 revertant to knock‐out isolates (ΔLPS‐LPSrev: #1–3, #1–6, #2–4, and #2–8; red) were grown on LB agar plates, for 3 days and photographs of colonies were taken under a stereomicroscope.
Fig. S5. The CPA TET operon is required for symptom development of Pseudomonas syringae pv. actinidiae (Psa) in host plants. (A) Psa BV3 or BV3 R‐LPS mutants (Mesarich et al., 2017) were flood‐inoculated at ~106 CFU/ml on Actinidia chinensis var. chinensis ‘Zesy002’, and photographs of symptom development in pottles and representative leaves taken at 50 days post‐inoculation. (B) Psa BV1, BV1 LPS knock‐out mutant (ΔLPS), or two independent BV1 knock‐outs complemented LPS from BV3 (+LPS_BV3) mutants were flood‐inoculated at ~106 CFU/ml on A. chinensis var. chinensis ‘Hort16A’, and photographs of symptom development in pottles and representative leaves taken at 50 days post‐inoculation. Lesions are indicated by white arrows.
Fig. S6. Comparative schematic of the CPA locus from isolates of P. syringae. Isolates chosen to illustrate the variation at this locus were Psa BV1 ICMP 9853, Psy B728a, Psa BV3 ICMP 18884. Ps ICMP 11168, Ps ICMP 19499, Pto DC3000, Pta ICMP 2835 and Ps ICMP 19198. From the left tRNA‐Met (red) and genes encoding DnaJ and a methylchemotactic receptor (grey) are found in all isolates. Genes encoding D‐Rha and L‐Rha are coloured dark and light blue respectively. Genes encoding the TET operon are various shades of green reflecting the different versions of this locus in each isolate. Note the fusion of the last two genes of this operon in isolates Ps ICMP 19499, Pto DC3000, Pta ICMP 2835 and Ps ICMP 19198. Genes that have not been functionally identified but are likely to have a role in CPA biosynthesis are coloured orange.
Fig. S7. Cophenetic entanglement coefficients for phylogenetic trees for the TET operon and MLST analysis generated using different tree‐building methods (UPGMA, Neighbour joining (NJ), or RAxML) compared to each other and to the R‐syringacin (tailocin) sensitivity tree for data from Baltrus et al. (2019). The cophenetic correlation matrix between the trees have values ranging between −1 to 1, with near 0 values indicating that the two trees are not statistically similar. Values between −0.25 and 0.25 (indicated by the red box on the scale) are poorly correlated and outlined in the table and associated scale. UPGMA was selected over RAxML and NJ for tree‐building in Fig. 6 due to the nature of comparing the sensitivity phenotype with genetic similarity treated as a ‘phenotype’ (thus creating phenetic trees rather than phylogenetic trees). This allowed for pairwise comparisons instead of inferring an evolutionary relationship that NJ and RAxML trees are better at conveying.
Table S1. Metadata for isolates used in this study
Table S2. The sequence of primers used in this study. All primers were synthesized by Macrogen, South Korea.
Acknowledgements
This work was funded (including a post‐doctoral fellowship to J.J.) by the Bio‐protection Research Centre (Tertiary Education Commission, New Zealand). L.M.H. would like to thank Zespri International for an MSc scholarship. The authors would like to thank Rick Broadhurst (AgResearch, Ruakura, New Zealand) for rabbit immunology. The authors would also like to thank Jo Bowen (PFR) and Iain Hay (UoA) for critically reading the manuscript.
References
- Aziz, R.K. , Bartels, D. , Best, A.A. , DeJongh, M. , Disz, T. , Edwards, R.A. , et al (2008) The RAST server: rapid annotations using subsystems technology. BMC Genomics 9: 75. [DOI] [PMC free article] [PubMed] [Google Scholar]
- Baltrus, D.A. , Clark, M. , Smith, C. , and Hockett, K.L. (2019) Localized recombination drives diversification of killing spectra for phage‐derived syringacins. ISME J 13: 237–249. [DOI] [PMC free article] [PubMed] [Google Scholar]
- Boratyn, G.M. , Camacho, C. , Cooper, P.S. , Coulouris, G. , Fong, A. , Ma, N. , et al (2013) BLAST: a more efficient report with usability improvements. Nucl Acids Res 41: W29–W33. [DOI] [PMC free article] [PubMed] [Google Scholar]
- Butler, M.I. , Stockwell, P.A. , Black, M.A. , Day, R.C. , Lamont, I.L. , and Poulter, R.T.M. (2013) Pseudomonas syringae pv. actinidiae from recent outbreaks of kiwifruit bacterial canker belong to different clones that originated in China. PLoS One 8: e57464. [DOI] [PMC free article] [PubMed] [Google Scholar]
- Carim, S. , Azadeh, A.L. , Kazakov, A.E. , Price, M.N. , Walian, P.J. , Chakraborty, R. , et al (2020) Systematic discovery of pseudomonad genetic factors involved in sensitivity to tailocins. bioRxiv 2005: 2027.113977. [DOI] [PMC free article] [PubMed] [Google Scholar]
- Cunty, A. , Poliakoff, F. , Rivoal, C. , Cesbron, S. , Saux, M.L. , Lemaire, C. , et al (2015) Characterization of Pseudomonas syringae pv. actinidiae (Psa) isolated from France and assignment of Psa biovar 4 to a de novo pathovar: Pseudomonas syringae pv. actinidifoliorum pv. Nov. Plant Pathol 64: 582–596. [Google Scholar]
- Cury, J. , Jové, T. , Touchon, M. , Néron, B. , and Rocha, E.P.C. (2016) Identification and analysis of integrons and cassette arrays in bacterial genomes. Nucl Acids Res 44: 4539–4550. [DOI] [PMC free article] [PubMed] [Google Scholar]
- Cuthbertson, L. , Kimber, M.S. , and Whitfield, C. (2007) Substrate binding by a bacterial ABC transporter involved in polysaccharide export. Proc Natl Acad Sci 104: 19529–19534. [DOI] [PMC free article] [PubMed] [Google Scholar]
- DebRoy, C. , Fratamico, P.M. , Yan, X. , Baranzoni, G. , Liu, Y. , Needleman, D.S. , et al (2016) Comparison of O‐antigen gene clusters of all O‐serogroups of Escherichia coli and proposal for adopting a new nomenclature for O‐typing. PLoS ONE 11: e0147434. [DOI] [PMC free article] [PubMed] [Google Scholar]
- Dillon, M.M. , Almeida, R.N.D. , Laflamme, B. , Martel, A. , Weir, B.S. , Desveaux, D. , and Guttman, D.S. (2019a) Molecular evolution of Pseudomonas syringae type III secreted effector proteins. Front Plant Sci 10: 418. [DOI] [PMC free article] [PubMed] [Google Scholar]
- Dillon, M.M. , Thakur, S. , Almeida, R.N.D. , Wang, P.W. , Weir, B.S. , and Guttman, D.S. (2019b) Recombination of ecologically and evolutionarily significant loci maintains genetic cohesion in the Pseudomonas syringae species complex. Genome Biol 20: 3. [DOI] [PMC free article] [PubMed] [Google Scholar]
- Domingues, S. , da Silva, G.J. , and Nielsen, K.M. (2012) Integrons: vehicles and pathways for horizontal dissemination in bacteria. Mobile Genet Elements 2: 211–223. [DOI] [PMC free article] [PubMed] [Google Scholar]
- Engler, C. , Gruetzner, R. , Kandzia, R. , and Marillonnet, S. (2009) Golden gate shuffling: a one‐pot DNA shuffling method based on type iis restriction enzymes. PLoS ONE 4: e5553. [DOI] [PMC free article] [PubMed] [Google Scholar]
- Ey, P.L. , Prowse, S.J. , and Jenkin, C.R. (1978) Isolation of pure IgG1, IgG2a and IgG2b immunoglobulins from mouse serum using protein A‐sepharose. Immunochemistry 15: 429–436. [DOI] [PubMed] [Google Scholar]
- Frampton, R.A. , Acedo, E.L. , Young, V.L. , Chen, D.N. , Tong, B. , Taylor, C. , et al (2015) Genome, proteome and structure of a T7‐like bacteriophage of the kiwifruit canker phytopathogen Pseudomonas syringae pv. actinidiae . Viruses 7: 3361–3379. [DOI] [PMC free article] [PubMed] [Google Scholar]
- Frampton, R.A. , Taylor, C. , Moreno, A.V.H. , Visnovsky, S.B. , Petty, N.K. , Pitman, A.R. , and Fineran, P.C. (2014) Identification of bacteriophages for biocontrol of the kiwifruit canker phytopathogen Pseudomonas syringae pv. actinidiae . Appl Environ Microbiol 80: 2216–2228. [DOI] [PMC free article] [PubMed] [Google Scholar]
- Fujikawa, T. , and Sawada, H. (2016) Genome analysis of the kiwifruit canker pathogen Pseudomonas syringae pv actinidiae biovar 5. Sci Rep 6: 21399. [DOI] [PMC free article] [PubMed] [Google Scholar]
- Galili, T. (2015) Dendextend: an R package for visualizing, adjusting and comparing trees of hierarchical clustering. Bioinformatics 31: 3718–3720. [DOI] [PMC free article] [PubMed] [Google Scholar]
- Ghequire, M.G.K. , and De Mot, R. (2015) The tailocin tale: peeling off phage tails. Trends Microbiol 23: 587–590. [DOI] [PubMed] [Google Scholar]
- Gillings, M.R. (2014) Integrons: past, present, and future. Microbiol Mol Biol Rev 78: 257–277. [DOI] [PMC free article] [PubMed] [Google Scholar]
- Hockett, K.L. , Clark, M. , Scott, S. , and Baltrus, D.A. (2017) Conditionally redundant bacteriocin targeting by Pseudomonas syringae . BioRxiv 167: 593. [Google Scholar]
- Hockett, K.L. , Renner, T. , and Baltrus, D.A. (2015) Independent co‐option of a tailed bacteriophage into a killing complex in Pseudomonas . MBio 6: e00452. [DOI] [PMC free article] [PubMed] [Google Scholar]
- Holtappels, D. , Kerremans, A. , Busschots, Y. , Van Vaerenbergh, J. , Maes, M. , Lavigne, R. , and Wagemans, J. (2020) Preparing for the KIL: receptor analysis of Pseudomonas syringae pv. porri phages and their impact on bacterial virulence. Int J Mol Sci 21: 2930. [DOI] [PMC free article] [PubMed] [Google Scholar]
- Jann, B. , Reske, K. , and Jann, K. (1975) Heterogeneity of lipopolysaccharides: analysis of polysaccharide chain lengths by sodium dodecylsulfate‐polyacrylamide gel electrophoresis. Eur J Biochem 60: 239–246. [DOI] [PubMed] [Google Scholar]
- Kandel, P.P. , Baltrus, D.A. , and Hockett, K.L. (2020) Pseudomonas can survive tailocin killing via persistence‐like and heterogenous resistance mechanisms. J Bacteriol 202: JB.00142‐00120. [DOI] [PMC free article] [PubMed] [Google Scholar]
- King, J.D. , Kocincova, D. , Westman, E.L. , and Lam, J.S. (2009) Review: lipopolysaccharide biosynthesis in Pseudomonas aeruginosa . Innate Immun 15: 261–312. [DOI] [PubMed] [Google Scholar]
- Koh, Y. , Cha, B. , Chung, H. , and Lee, D. (1994) Outbreak and spread of bacterial canker in kiwifruit. Korean J Plant Pathol 10: 68–72. [Google Scholar]
- Kutschera, A. , Schombel, U. , Wröbel, M. , Gisch, N. , and Ranf, S. (2019a) Loss of wbpL disrupts O‐polysaccharide synthesis and impairs virulence of plant‐associated Pseudomonas strains. Mol Plant Pathol 20: 1535–1549. [DOI] [PMC free article] [PubMed] [Google Scholar]
- Kutschera, A. , Dawid, C. , Gisch, N. , Schmid, C. , Raasch, L. , Gerster, T. , et al (2019b) Bacterial medium‐chain 3‐hydroxy fatty acid metabolites trigger immunity in Arabidopsis plants. Science 364: 178–181. [DOI] [PubMed] [Google Scholar]
- Kvitko, B.H. , and Collmer, A. (2011) Construction of Pseudomonas syringae pv. tomato DC3000 mutant and polymutant strains In Plant Immunity: Methods and Protocols, McDowell J.M. (ed). Totowa, NJ: Humana Press, pp. 109–128. [DOI] [PubMed] [Google Scholar]
- Lam, J. , Taylor, V. , Islam, S. , Hao, Y. , and Kocíncová, D. (2011) Genetic and functional diversity of Pseudomonas aeruginosa lipopolysaccharide. Front Microbiol 2: 118. [DOI] [PMC free article] [PubMed] [Google Scholar]
- Lerouge, I. , and Vanderleyden, J. (2002) O‐antigen structural variation: mechanisms and possible roles in animal/plant–microbe interactions. FEMS Microbiol Rev 26: 17–47. [DOI] [PubMed] [Google Scholar]
- Liston, S.D. , Clarke, B.R. , Greenfield, L.K. , Richards, M.R. , Lowary, T.L. , and Whitfield, C. (2015) Domain interactions control complex formation and polymerase specificity in the biosynthesis of the Escherichia coli O9a antigen. J Biol Chem 290: 1075–1085. [DOI] [PMC free article] [PubMed] [Google Scholar]
- Maier, R.J. , and Brill, W.J. (1978) Involvement of Rhizobium japonicum O antigen in soybean nodulation. J Bacteriol 133: 1295–1299. [DOI] [PMC free article] [PubMed] [Google Scholar]
- Maldonado, R.F. , Sá‐Correia, I. , and Valvano, M.A. (2016) Lipopolysaccharide modification in gram‐negative bacteria during chronic infection. FEMS Microbiol Rev 40: 480–493. [DOI] [PMC free article] [PubMed] [Google Scholar]
- Mann, E. , Kelly, S.D. , Al‐Abdul‐Wahid, M.S. , Clarke, B.R. , Ovchinnikova, O.G. , Liu, B. , and Whitfield, C. (2019) Substrate recognition by a carbohydrate‐binding module in the prototypical ABC transporter for lipopolysaccharide O antigen from Escherichia coli O9a. J Biol Chem 294: 14978–14990. [DOI] [PMC free article] [PubMed] [Google Scholar]
- Marcelletti, S. , Ferrante, P. , Petriccione, M. , Firrao, G. , and Scortichini, M. (2011) Pseudomonas syringae pv. actinidiae draft genomes comparison reveal strain‐specific features involved in adaptation and virulence to Actinidia species. PLoS ONE 6: 17. [DOI] [PMC free article] [PubMed] [Google Scholar]
- Mazzaglia, A. , Studholme, D.J. , Taratufolo, M.C. , Cai, R.M. , Almeida, N.F. , Goodman, T. , et al (2012) Pseudomonas syringae pv. actinidiae (Psa) isolates from recent bacterial canker of kiwifruit outbreaks belong to the same genetic lineage. PLoS ONE 7: 11. [DOI] [PMC free article] [PubMed] [Google Scholar]
- McAtee, P.A. , Brian, L. , Curran, B. , van der Linden, O. , Nieuwenhuizen, N.J. , Chen, X. , et al (2018) Re‐programming of Pseudomonas syringae pv. actinidiae gene expression during early stages of infection of kiwifruit. BMC Genomics 19: 822. [DOI] [PMC free article] [PubMed] [Google Scholar]
- McCann, H.C. , Li, L. , Liu, Y. , Li, D. , Hui, P. , Zhong, C. , et al (2017) The origin and evolution of a pandemic lineage of the kiwifruit pathogen Pseudomonas syringae pv actinidiae . Genome Biol Evol 9: 932–944. [DOI] [PMC free article] [PubMed] [Google Scholar]
- McCann, H.C. , Rikkerink, E.H.A. , Bertels, F. , Fiers, M. , Lu, A. , Rees‐George, J. , et al (2013) Genomic analysis of the kiwifruit pathogen Pseudomonas syringae pv. actinidiae provides insight into the origins of an emergent plant disease. PLoS Pathog 9: e1003503. [DOI] [PMC free article] [PubMed] [Google Scholar]
- Mesarich, C.H. , Rees‐George, J. , Gardner, P.P. , Ghomi, F.A. , Gerth, M.L. , Andersen, M.T. , et al (2017) Transposon insertion libraries for the characterization of mutants from the kiwifruit pathogen Pseudomonas syringae pv actinidiae . PLoS ONE 12: e0172790. [DOI] [PMC free article] [PubMed] [Google Scholar]
- Ovod, V. , Rudolph, K. , and Krohn, K. (1997a) Demonstration of the immunological diversity of O‐chains of lipopolysaccharide of Pseudomonas syringae and inferring of the serogroup‐ and serotype‐specific epitopes with monoclonal antibodies In Pseudomonas Syringae Pathovars and Related Pathogens, Rudolph K., Burr T.J., Mansfield J.W., Stead D., Vivian A., and von Kietzell J. (eds). Dordrecht: Springer, pp. 532–537. [Google Scholar]
- Ovod, V. , Rudolph, K. , and Krohn, K. (1997b) Serological classification of Pseudomonas syringae pathovars based on monoclonal antibodies towards the lipopolysaccharide‐O‐chains In Pseudomonas Syringae Pathovars and Related Pathogens, Rudolph K., Burr T.J., Mansfield J.W., Stead D., Vivian A., and von Kietzell J. (eds). Dordrecht: Springer, pp. 526–531. [Google Scholar]
- Paradis, E. , and Schliep, K. (2018) Ape 5.0: an environment for modern phylogenetics and evolutionary analyses in R. Bioinformatics 35: 526–528. [DOI] [PubMed] [Google Scholar]
- Pinheiro, L.A.M. , Pereira, C. , Frazão, C. , Balcão, V.M. , and Almeida, A. (2019) Efficiency of phage φ6 for biocontrol of Pseudomonas syringae pv. syringae: an in vitro preliminary study. Microorganisms 7: 286. [DOI] [PMC free article] [PubMed] [Google Scholar]
- R‐CoreTeam . (2018) R: A Language and Environment for Statistical Computing. Vienna: R Foundation for Statistical Computing; https://www.R-project.org. [Google Scholar]
- Raetz, C.R. , and Whitfield, C. (2002) Lipopolysaccharide endotoxins. Annu Rev Biochem 71: 635–700. [DOI] [PMC free article] [PubMed] [Google Scholar]
- Riley, M.A. , and Wertz, J.E. (2002) Bacteriocins: evolution, ecology, and application. Annu Rev Microbiol 56: 117–137. [DOI] [PubMed] [Google Scholar]
- Rooney, W.M. , Grinter, R.W. , Correia, A. , Parkhill, J. , Walker, D.C. , and Milner, J.J. (2020) Engineering bacteriocin‐mediated resistance against the plant pathogen Pseudomonas syringae . Plant Biotechnol J 18(5): 1296–1306. [DOI] [PMC free article] [PubMed] [Google Scholar]
- Sambrook, J. , and Russell, D.W. (2001) Molecular Cloning: A Laboratory Manual, 3rd ed New York, NY: Cold Spring Harbour. [Google Scholar]
- Sawada, H. , Kondo, K. , and Nakaune, R. (2016) Novel biovar (biovar 6) of Pseudomonas syringae pv. actinidiae causing bacterial canker of kiwifruit (Actinidia deliciosa) in Japan. Jpn J Phytopathol 82: 101–115. [Google Scholar]
- Schafer, A. , Tauch, A. , Jager, W. , Kalinowski, J. , Thierbach, G. , and Puhler, A. (1994) Small mobilizable multipurpose cloning vectors derived from the Escherichia coli plasmids pk18 and pk19 ‐ selection of defined deletions in the chromosome of Corynebacterium glutamicum . Gene 145: 69–73. [DOI] [PubMed] [Google Scholar]
- Scortichini, M. , Marcelletti, S. , Ferrante, P. , Petriccione, M. , and Firrao, G. (2012) Pseudomonas syringae pv. actinidiae: a re‐emerging, multi‐faceted, pandemic pathogen. Mol Plant Pathol 13: 631–640. [DOI] [PMC free article] [PubMed] [Google Scholar]
- Serizawa, S. , Ichikawa, T. , Takikawa, Y. , Tsuyumu, S. , and Goto, M. (1989) Occurrence of bacterial canker of kiwifruit in Japan description of symptoms, isolation of the pathogen and screening of bactericides. Jpn J Phytopathol 55: 427–436. [Google Scholar]
- Takikawa, Y. , Serizawa, S. , Ichikawa, T. , Tsuyumu, S. , and Goto, M. (1989) Pseudomonas syringae pv. actinidiae pv. Nov the causal bacterium of canker of kiwifruit in Japan. Jpn J Phytopathol 55: 437–444. [Google Scholar]
- Vanneste, J.L. , Yu, J. , Cornish, D.A. , Tanner, D.J. , Windner, R. , Chapman, J.R. , et al (2013) Identification, virulence, and distribution of two biovars of Pseudomonas syringae pv. actinidiae in New Zealand. Plant Dis 97: 708–719. [DOI] [PubMed] [Google Scholar]
- Wei, T. and Simko, V . (2017) R package ‘corrplot’: visualization of a correlation matrix (version 0.84) https://github.com/taiyun/corrplot.
- Westphal, O. , and Jann, K. (1965) Bacterial lipopolysaccharide: extraction with phenol‐water and further application of the procedure. Meth Carbohydr Chem 5: 83–91. [Google Scholar]
- Wyres, K.L. , Gorrie, C. , Edwards, D.J. , Wertheim, H.F.L. , Hsu, L.Y. , Van Kinh, N. , et al (2015) Extensive capsule locus variation and large‐scale genomic recombination within the Klebsiella pneumoniae clonal group 258. Genome Biol Evol 7: 1267–1279. [DOI] [PMC free article] [PubMed] [Google Scholar]
- Zdorovenko, E.L. , Ovod, V.V. , Zatonsky, G.V. , Shashkov, A.S. , Kocharova, N.A. , and Knirel, Y.A. (2001) Location of the O‐methyl groups in the O‐polysaccharide of Pseudomonas syringae pv. phaseolicola . Carbohydr Res 330: 505–510. [DOI] [PubMed] [Google Scholar]
- Zdorovenko, G.M. , and Zdorovenko, E.L. (2010) Pseudomonas syringae lipopolysaccharides: immunochemical characteristics and structure as a basis for strain classification. Microbiology 79: 47–57. [PubMed] [Google Scholar]
Associated Data
This section collects any data citations, data availability statements, or supplementary materials included in this article.
Supplementary Materials
Fig. S1. MLST genome phylogenetic tree for Pseudomonas syringae and Pseudomonas viridiflava strains. Five genes (gyrB, ropD, gapA, pgi and acnB) from selected representatives of P. syringae phylogroups were concatenated and aligned in Geneious v11 and neighbour‐joining phylogenetic trees built. Strains grouped as expected into their phylogroups and are coloured according to their core genome phylogenies as previously described (Dillon et al., 2019b): phylogroup 1 blue; phylogroup 2 red; phylogroup 3 green; phylogroup 4 orange; phylogroup 5 purple; phylogroup 6 yellow; phylogroup 7 pink; phylogroup 9 grey; phylogroup 10 mauve; phylogroup 11 chocolate; phylogroup 13 claret.
Fig. S2. Schematic for knock‐out and knock‐in swap of the TET locus in Pseudomonas syringae pv. actinidiae (Psa) BV1. One‐kilobase flanking regions upstream (UP) and downstream (DN) of the polymorphic region of the TET operon in wild‐type (WT) Psa BV1 (green; encoding Wzt, WbdD, and WbdA proteins in red) were PCR‐cloned and fused at a primer‐introduced internal XbaI site and used in pK18mobsacB vector‐mediated knock‐out of the BV1 TET locus to generate BV1_LPS‐KO. To generate the BV1‐to‐BV3 LPS swap (knock‐in complementation), a pK18mobsacB vector‐mediated method was also used. First, Eco53kI, BsaI and PstI sites were removed during PCR (primer‐driven) to facilitate blunt‐end cloning of modules, golden gate (GG) cloning, and evasion of the BV1‐encoded restriction enzyme, respectively. The knock‐in pK18mobsacB vector was built (GG assembly) from five modules with sizes indicated. Modules 2, 3, and 5 were PCR‐amplified and blunt‐end cloned into pICH41021 shuttle vector directly. Modules 1 and 4 were first cloned as two parts (A and B) from their respective Psa BVs and then fused by overlap PCR mediated by primer sequences designed to introduce overlap regions during amplification of part A and B. Following overlap PCR, modules 1 and 4 were blunt‐end cloned into the pICH41021 shuttle vector. The modules were then assembled into the final pK18mobsacB knock‐in construct. The BV1_LPS‐KO was then subsequently complemented with TET operon from BV3 (blue).
Fig. S3. Bacterial cell sedimentation for Pseudomonas syringae pv. actinidiae (Psa) in inoculation buffer. (A) Psa BV3 and two R‐LPS mutants, ΔwbpL and Δgmd (Mesarich et al., 2017) were grown overnight in LB liquid culture, pelleted by centrifugation, resuspended in 10 mM MgSO4 buffer, and normalized to OD600 of 0.4. (B) Psa BV3 and BV1 (wild‐type; WT), Psa BV1 LPS knock‐out (ΔLPS), four BV1‐to‐BV3 TET operon‐complemented knock‐in isolates (ΔLPS + LPS_BV3 #1–2, #1–4, #2–1, and #2–5; green), and four BV1 revertant to knock‐out isolates (ΔLPS‐LPSrev: #1–3, #1–6, #2–4, and #2–8; red) were grown overnight in LB liquid culture, pelleted by centrifugation, resuspended in 10 mM MgSO4 buffer, and normalized to OD600 of 0.5. Photographs of cell suspensions in both (A) and (B) were taken immediately after resuspension in buffer (T0) and after an hour standing at room temperature (T1).
Fig. S4. Colony morphologies for Pseudomonas syringae pv. actinidiae (Psa) BV1 mutant and complemented strains. Psa BV3 mutants (ΔwbpL or Δgmd) (Mesarich et al., 2017) and BV1 (wild‐type; WT), Psa BV1 LPS knock‐out (ΔLPS), four BV1‐to‐BV3 TET operon complemented knock‐in isolates (ΔLPS + LPS_BV3 #1–2, #1–4, #2–1, and #2–5; green), and four BV1 revertant to knock‐out isolates (ΔLPS‐LPSrev: #1–3, #1–6, #2–4, and #2–8; red) were grown on LB agar plates, for 3 days and photographs of colonies were taken under a stereomicroscope.
Fig. S5. The CPA TET operon is required for symptom development of Pseudomonas syringae pv. actinidiae (Psa) in host plants. (A) Psa BV3 or BV3 R‐LPS mutants (Mesarich et al., 2017) were flood‐inoculated at ~106 CFU/ml on Actinidia chinensis var. chinensis ‘Zesy002’, and photographs of symptom development in pottles and representative leaves taken at 50 days post‐inoculation. (B) Psa BV1, BV1 LPS knock‐out mutant (ΔLPS), or two independent BV1 knock‐outs complemented LPS from BV3 (+LPS_BV3) mutants were flood‐inoculated at ~106 CFU/ml on A. chinensis var. chinensis ‘Hort16A’, and photographs of symptom development in pottles and representative leaves taken at 50 days post‐inoculation. Lesions are indicated by white arrows.
Fig. S6. Comparative schematic of the CPA locus from isolates of P. syringae. Isolates chosen to illustrate the variation at this locus were Psa BV1 ICMP 9853, Psy B728a, Psa BV3 ICMP 18884. Ps ICMP 11168, Ps ICMP 19499, Pto DC3000, Pta ICMP 2835 and Ps ICMP 19198. From the left tRNA‐Met (red) and genes encoding DnaJ and a methylchemotactic receptor (grey) are found in all isolates. Genes encoding D‐Rha and L‐Rha are coloured dark and light blue respectively. Genes encoding the TET operon are various shades of green reflecting the different versions of this locus in each isolate. Note the fusion of the last two genes of this operon in isolates Ps ICMP 19499, Pto DC3000, Pta ICMP 2835 and Ps ICMP 19198. Genes that have not been functionally identified but are likely to have a role in CPA biosynthesis are coloured orange.
Fig. S7. Cophenetic entanglement coefficients for phylogenetic trees for the TET operon and MLST analysis generated using different tree‐building methods (UPGMA, Neighbour joining (NJ), or RAxML) compared to each other and to the R‐syringacin (tailocin) sensitivity tree for data from Baltrus et al. (2019). The cophenetic correlation matrix between the trees have values ranging between −1 to 1, with near 0 values indicating that the two trees are not statistically similar. Values between −0.25 and 0.25 (indicated by the red box on the scale) are poorly correlated and outlined in the table and associated scale. UPGMA was selected over RAxML and NJ for tree‐building in Fig. 6 due to the nature of comparing the sensitivity phenotype with genetic similarity treated as a ‘phenotype’ (thus creating phenetic trees rather than phylogenetic trees). This allowed for pairwise comparisons instead of inferring an evolutionary relationship that NJ and RAxML trees are better at conveying.
Table S1. Metadata for isolates used in this study
Table S2. The sequence of primers used in this study. All primers were synthesized by Macrogen, South Korea.