Abstract
Aneurysm rupture has been suggested to be related to aneurysm geometry, morphology, and complex flow activity, therefore understanding aneurysm-specific hemodynamics is crucial. 4D Flow MRI has shown to be a feasible tool for assessing hemodynamics in intracranial aneurysms with high spatial resolution. However, it requires averaging over multiple heartbeats and cannot account for cycle-to-cycle hemodynamics variations. This study aimed to assess cycle-to-cycle flow dynamics variations in a patient-specific intracranial aneurysm model using tomographic particle image velocimetry (tomo-PIV) at a high image rate under pulsatile flow conditions. Time-resolved and time-averaged velocity flow fields within the aneurysm sac and estimations of wall shear stress (WSS) were compared with those from 4D Flow MRI. A one-way ANOVA showed a significant difference between cardiac cycles (p-value < 0.0001); however, differences were not significant after PIV temporal and spatial resolution was matched to that of MRI (p-value 0.9727). This comparison showed the spatial resolution to be the main contributor to assess cycle-to-cycle variability. Furthermore, the comparison with 4D Flow MRI between velocity components, streamlines, and estimated WSS showed good qualitative and quantitative agreement. This study showed the feasibility of patient-specific in-vitro experiments using tomo-PIV to assess 4D Flow MRI with high repeatability in the measurements.
Key terms: Intracranial aneurysm, patient-specific, experimental validation, Particle Image Velocimetry, hemodynamics, phase-contrast MRI, wall shear stress
3. INTRODUCTION
An intracranial aneurysm is a dilatation of the wall of an artery supplying blood to the brain.14 These are common, occurring in 3–6% of adults, and may also be lethal due to the potential to rupture.21 Since cases of aneurysm rupture are less than 2% per year and the mortality associated with rupture is 40–50%, there is often significant uncertainty when weighing the risks and benefits of treatment compared with observation and follow-up imaging.21 Reported studies over several decades have identified that both anatomical and hemodynamic features, such as high wall shear stress (WSS) and blood-flow patterns at arterial bifurcations and regions of high vessel curvature, correlate well with aneurysm rupture status.11,13,20 Therefore, reliable clinical imaging techniques capable of volumetric measurements are required to understand better the pathophysiology of aneurysms.
4D Flow MRI is a clinical imaging technique that uses time-resolved three-dimensional (3D) phase-contrast MRI with 3D velocity encoding to non-invasively visualize anatomy and quantify blood velocities.16,22,28 It has been applied to analyze multiple vascular territories and cardiovascular diseases. Previous cardiovascular disease applications, including intracranial aneurysm cases, have shown the potential of this technique to directly impact treatment planning.5,9,10,17 However, limitations in temporal and spatial resolution may limit the visualization of complex flow features required to calculate velocity parameters such as WSS.1,4,26 In addition, 4D Flow MRI needs to average multiple heartbeats to acquire time-resolved data, so it does not allow for a beat-to-beat analysis of blood flow.
4D Flow MRI has previously been validated in-vivo with 2D PC MRI17,31 and ultrasound flow measurements,9,17,29 which are known as well-established reference standards in the clinic. On the other hand, in-vitro experiments offer some advantages over in-vivo imaging methods, such as controlled flow conditions while removing patient and user-specific variations. Previous studies have used particle image velocimetry (PIV) as the in-vitro experimental technique to study flows in intracranial aneurysms due to its achievable high spatial and temporal resolution.7,19,30,33 More recently, volumetric PIV techniques, such as tomographic PIV (tomo-PIV), have been introduced to study aneurysm flows.2,23 Tomo-PIV can acquire instantaneous measurements of all three velocity components in an illuminated volume, which is ideal for the study of complex flows, as seen in aneurysm sacs. Although these studies included volumetric measurements in aneurysm flows, velocity fluctuations within cardiac cycles are still unstudied.
In this study, velocity measurements from 4D Flow MRI were qualitatively and quantitatively compared to those from tomo-PIV using a patient-specific intracranial aneurysm model. Velocity fluctuations were investigated by acquiring multiple cardiac cycles using tomo-PIV at a high image rate under pulsatile flow conditions. These cycles were later averaged to compare velocities and estimations of WSS to 4D Flow MRI measurements. The purpose of this study was to better understand aneurysm flow while taking into account cycle-to-cycle fluctuations and to analyze the ability of 4D Flow MRI to assess complex flows in anatomical geometries.
4. MATERIALS AND METHODS
4.1. Aneurysm Model Fabrication
Patient-specific 3D images were obtained under an institutionally approved IRB protocol. A data set of anterior circulation internal carotid aneurysm was retrospectively selected from a database of clinical exams. A physical model of the aneurysm geometry was fabricated following the process previously published by our group.24 Projections from 3D computed tomography (CT) angiogram were segmented into a volume, as shown in Figure 1A, and exported in STL (Stereolithography) format. The geometry was scaled by a factor of 2, post-processed to smooth surface imperfections and to add tubing connectors to inlets and outlets using 3-matic (Materialise, Belgium), as shown in the virtual model (Figure 1B). The model was 3D printed, using a water-dissolvable material, and submerged in silicone (Sylgard 184, Dow Corning, MI). The aneurysm core was then dissolved after the silicone was cured, resulting in the final model (Figure 1C).
Figure 1:

Patient-specific model fabrication process. The aneurysm geometry was taken from a 3D CT Angiogram (A), converted into a virtual model (B), 3D printed out of poly-vinyl alcohol, submerged in a silicone block, and finally dissolved to create a patient-specific intracranial aneurysm model (C). The area of interest where tomo-PIV was acquired is shown in the green circle.
4.2. Flow Loop
A system containing a pulsatile pump (BDC PD-1100, BDC Laboratories, CO) with a compliance chamber and resistance valve, plastic tubing, and the patient-specific silicone model was connected in a closed-loop to mimic the systemic circulation (Figure 2B–C). A mixture of 58% glycerol and 42% deionized water was used to match the refractive index of the silicone model (n = 1.41), with a density of 1.14 g/cm3 and dynamic viscosity of 8.24 cP at room temperature. Index matching is required for PIV to achieve optical transparency, minimizing errors due to the optical distortions of the model and the liquid interface. The fluid was seeded with PMMA fluorescent particles with Rhodamine-B dye, mean diameter and density of 10 μm and 1.19 g/cm3, respectively. These parameters result in a Stokes number lower than 10−6, which ensures that the particles do not interfere with the fluid flow streamlines.
Figure 2:

A) Cardiac waveform used for (B) 4D Flow MRI and (C) tomo-PIV experimental setups. An ultrasonic flow sensor was placed on the outlet of the pump to measure flow during each experiment.
The inlet flow was programmed with a cardiac waveform of 35% systole with 60 beats per minute, resulting in a Womersley number of 5.93. The cardiac waveform was measured during each experiment using a non-intrusive ultrasonic flow sensor (Transonic, NY) to ensure an average flow of 0.31 L/min and 1.1 L/min at peak-systole. These flow parameters resulted in Reynolds numbers (Re) of 144 and 486, respectively. Figure 2A shows the averaged cardiac waveform measured for each experiment with their standard deviation. The model was situated 8 meters downstream from the pump with an equal return length to be scanned in the MRI scanner. The same tube length, inlet flow, and liquid mixture with particles were used in both the MRI and PIV experiments.
4.3. 4D Flow MRI
The in-vitro model was scanned in a clinical 3T MRI system (Discovery MR 750, GE Healthcare, WI) using an 8-channel high-resolution head coil (Figure 2B). 4D Flow MRI data were achieved using a cardiac-gated time-resolved 5-point radially undersampled phase contrast acquisition called PC-VIPR.12 Acquisition parameters included an imaging volume of 22 × 22 × 22 cm with spherical encoding, 0.5 mm isotropic spatial resolution, velocity encoding (Venc) of 100 cm/s, and a repetition time of 9.0 ms. Post-processing was done with an un-wrapping technique to create time-resolved data. With a heart rate of 60 beats per minute and a scan time of 12 minutes, the post-processed data represented one cardiac cycle that was an average of over 720 cardiac cycles. After imaging, data were reconstructed to 20 time-points per cardiac cycle.
4.4. PIV Measurement
Tomo-PIV experiments were performed using a Flowmaster PIV system (LaVision, Germany) with a dual-pulse 527 nm Nd:YLF laser (Photonics Industries International, Inc., NY). The laser illuminated a volume of 4 mm thick in the direction perpendicular to three high-speed cameras (two Phantom v341 and one Phantom v311, Vision Research, NJ), equipped with 60 mm f/2.8D lenses and long-pass filters (570nm cut-off). Figure 2C shows the experimental setup with cameras angled at −25, 0 and 25 degrees. Camera calibration was performed on a two-level calibration plate submerged on a custom-built silicone casing with the same refractive index as in the experiments, filled with the working fluid to better replicate the optical conditions. This tomo-PIV setup was validated in a previous work where velocity measurements on a straight tube were compared with stereo-PIV and 4D Flow MRI.18
A total of 4 cardiac cycles were acquired, and flow inlet conditions were replicated from those used for the MRI experiment. Data acquisition was synchronized with the pulsatile pump, and double-frame images were acquired at a frame rate of 400 Hz, with a time separation of 300 μs for a maximum particle displacement of 180 μm. For full aneurysm analysis, the in-vitro model was transversely moved in increments of 2 mm a total of three times to acquire data through the desired volume. After reconstruction, these volumes were registered and segmented using the STL geometry used to fabricate the silicone model.
Before volume reconstruction, the images were pre-processed for subtraction of the local minimum, Gaussian smoothing (3 × 3), and intensities were normalized with a local average to reduce errors caused by light scattering and improve particle images.6 Moreover, volume self-calibration was applied to correct errors of misalignment between the calibration plate and the laser sheet,32 reducing calibration error to less than 0.05 pixels. Volume reconstruction was achieved using the fast-MART algorithm (Elsinga et al.),6 with six iterations. Lastly, 3D cross-correlation was performed for velocity vector calculation using a multi-pass iteration process with window size 32 × 32 × 32 voxels and a 75% overlap for three passes. This allowed for an average of 15.4 particles per interrogation window, which is known to reduce noise.25 The resulting spatial resolution was 0.17 × 0.17 × 0.17 mm. Currently, no methods to evaluate uncertainty for tomo-PIV is available, so uncertainty was calculated on the planes of interest using the standard deviation and mean vector field for each interrogation window.27 This resulted in an average uncertainty of 5.4%, with 95% confidence assuming a normal distribution.
4.5. Data Analysis
For the assessment of cycle-to-cycle variations, a one-way ANOVA for repeated measures was performed to determine the significant difference in volumetric velocities. In addition, the ANOVA comparison was extended to compare each cycle while undersampling the data to match the temporal and spatial resolution obtained with 4D Flow MRI, as it is explained in Figure 3. This analysis results in a p-value for each comparison to identify the resolution that has the highest impact. To visualize regions with large variation, the angle between two velocity vectors of two cardiac cycles, corresponding to the same location, was calculated by their dot product, using the following equation:
| (1) |
Where a and b are vectors at the same spatial location in different cycles, and θ is the angle between them. An angle of 0° would mean that both velocity vectors are aligned.
Figure 3:
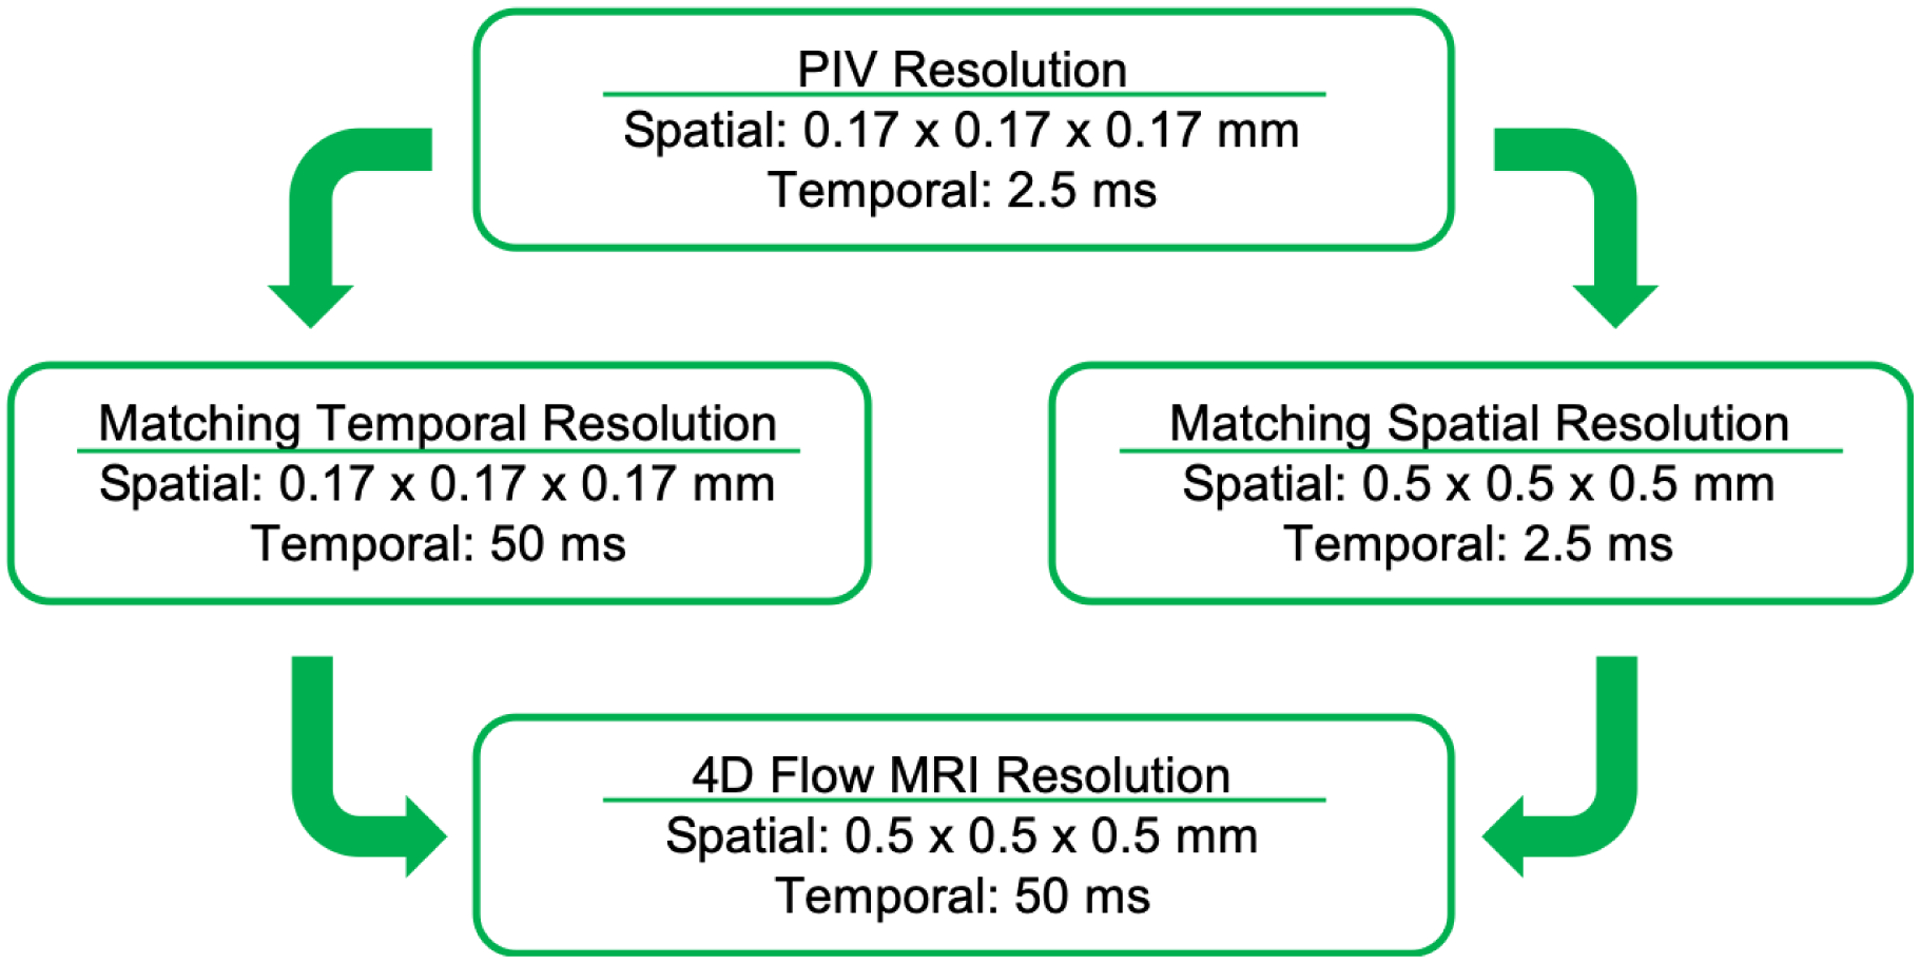
Schematic description of the undersampling of the PIV data for the cycle-to-cycle analysis.
An averaged cardiac cycle was calculated, from the four independent PIV acquisitions, and reconstructed into 20 time-points matching the temporal distribution of 4D Flow MRI. Taking advantage of the ability of the pulsatile pump to generate a gating signal for data acquisition during PIV and 4D Flow MRI experiments, time-points were registered in both data sets to represent the same temporal phase within the cardiac cycle. Data were visualized and quantified in Ensight (ANSYS Inc., PA), by placing cut-planes in regions of interest within the aneurysm sac. A point-by-point comparison between tomo-PIV and 4D Flow MRI was made with grids created at each extracted plane. These grids were used to reduce the PIV spatial resolution to match that of 4D Flow MRI (0.5 × 0.5 mm) through linear interpolation. Relationships in velocity components and magnitudes were evaluated by calculating the root-mean-square error (RMSE) and by generating Bland-Altman plots. Normal distribution was assumed, and the bias was calculated with a 95% confidence interval.
WSS was estimated and analyzed with an in-house MATLAB script (MathWorks, MA) using the aneurysm surface points obtained from STL files and approximating their corresponding velocities with interpolation of the measured velocity components at full spatial resolution.1 The STL files were created by manually segmenting the velocity fields from 4D Flow MRI and tomo-PIV. These files were used to determine the unit inward normal vector for each surface point. The velocity components corresponding to each surface point were computed by applying the linear least squares method to velocities interpolated from the measured data. Finally, these were used to estimate the magnitude WSS based on the following equation:
| (2) |
Where μ is the dynamic viscosity of the fluid, v is the three-dimensional velocity vector, and n is the normal vector at the wall. The derivative was calculated with the cross product of each velocity vector and their surface inward unit normal vector.
5. RESULTS
5.1. Cycle-to-Cycle Variation Assessment
The inlet flow at the aneurysm neck was calculated for each cardiac cycle and compared to the flow measured with 4D Flow MRI at the same location. Figure 4A shows the average flow and standard deviations obtained with PIV, including the comparison to 4D Flow MRI, which resulted in a mean difference of 15.8%. These were not significantly different according to a one-way t-test (p-value = 0.22). Furthermore, the difference in the time-averaged flow between techniques was 3.4%. Figure 4B shows the velocity magnitudes obtained in the mid-plane of the aneurysm sac with the averaged cycles. These show a jet entering from left to right and flow recirculating, resulting in two vortices and a region of low velocities at the center.
Figure 4:
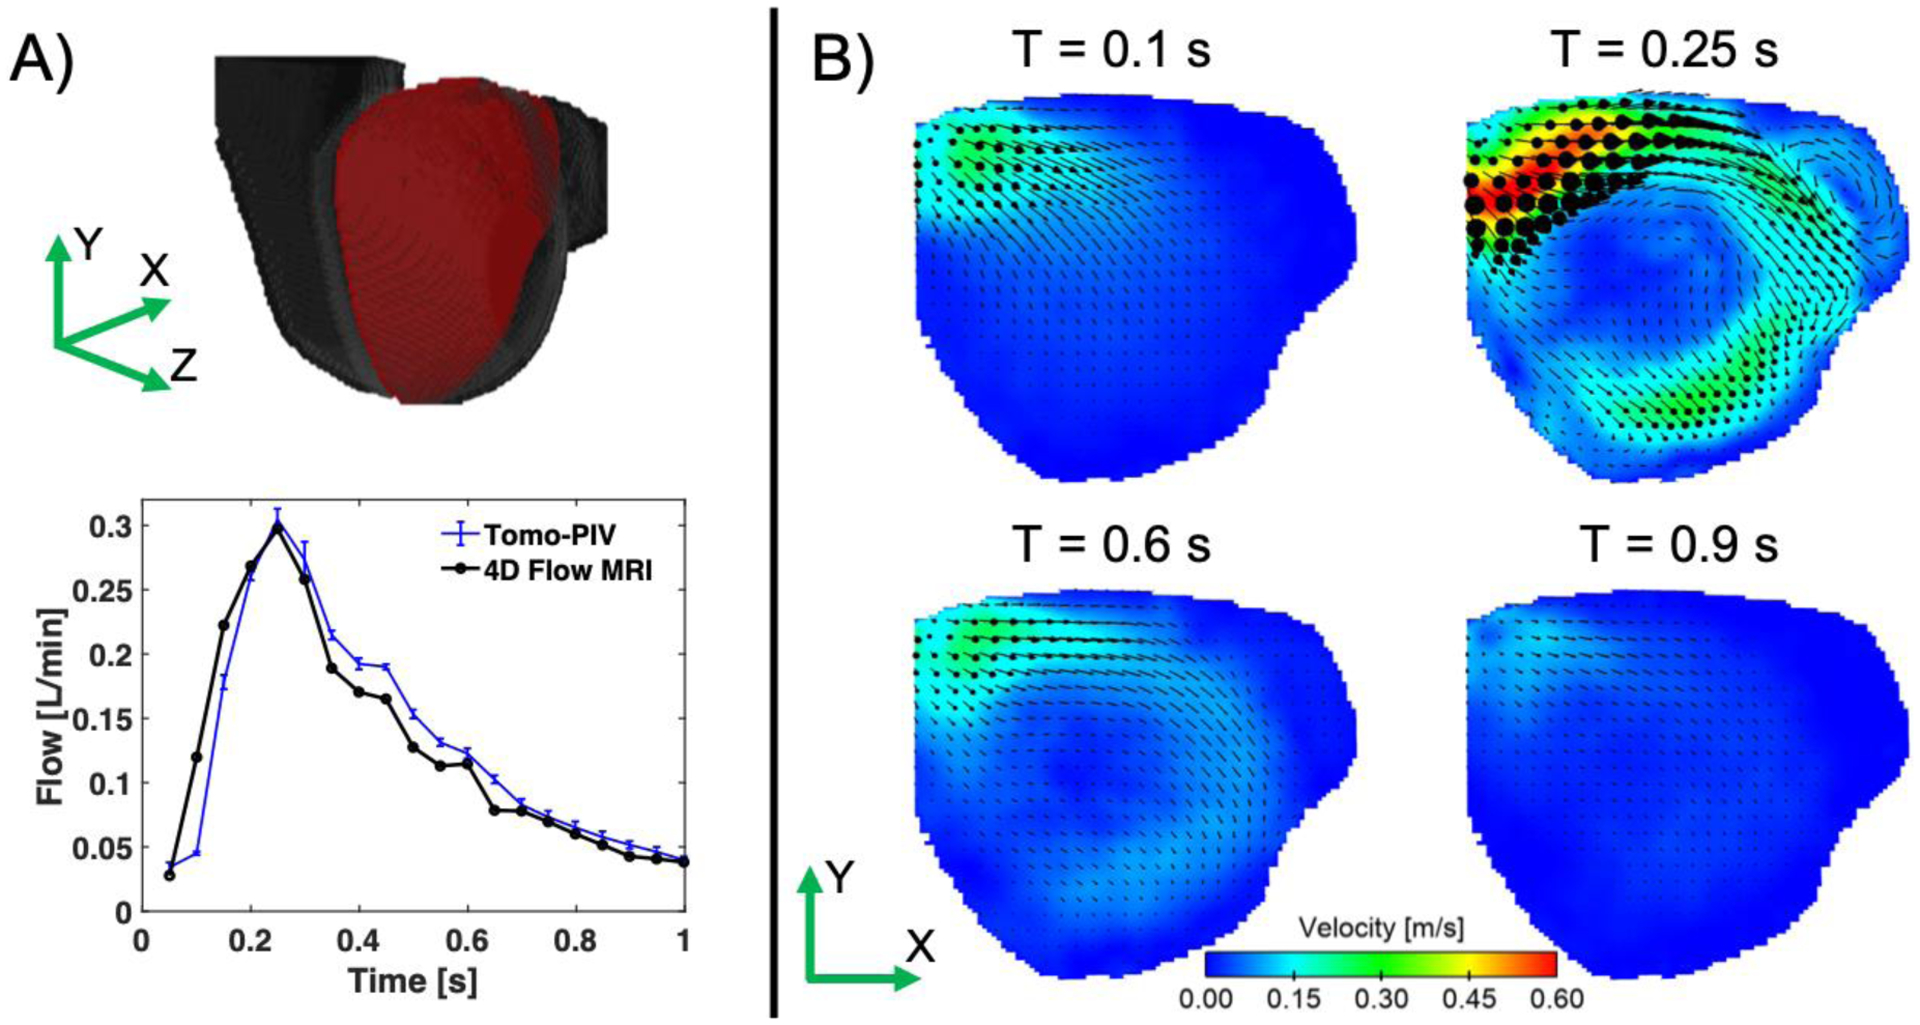
A) Inlet flow for tomo-PIV and 4D Flow MRI calculated at the aneurysm neck. The error bars represent the standard deviation from all the cardiac cycles acquired with tomo-PIV. B) Velocity magnitudes at the middle plane of the aneurysm (shown by the red plane on the volume) obtained with the averaged cardiac cycles at time-points 0.1, 0.2, 0.6 and 0.9 s.
The one-way ANOVA analysis revealed a statistical difference among all cardiac cycles when comparing the full resolution PIV data (p-value < 0.0001). Figure 5 shows the averaged angle difference between cycles at the same location and the time-points shown in Figure 4B. Histograms (Figure 5B) represent angle differences of the entire volume at the corresponding times. These show that two variation trends are happening during the cardiac cycle. First, at peak-systole (T = 0.25 s), the angle difference between cycles is high in the center of the aneurysm, where a vortex is present and velocities are low. Second, the differences increase near the wall during diastole and the largest difference is observed at the beginning of systole (T = 0.1 s).
Figure 5:
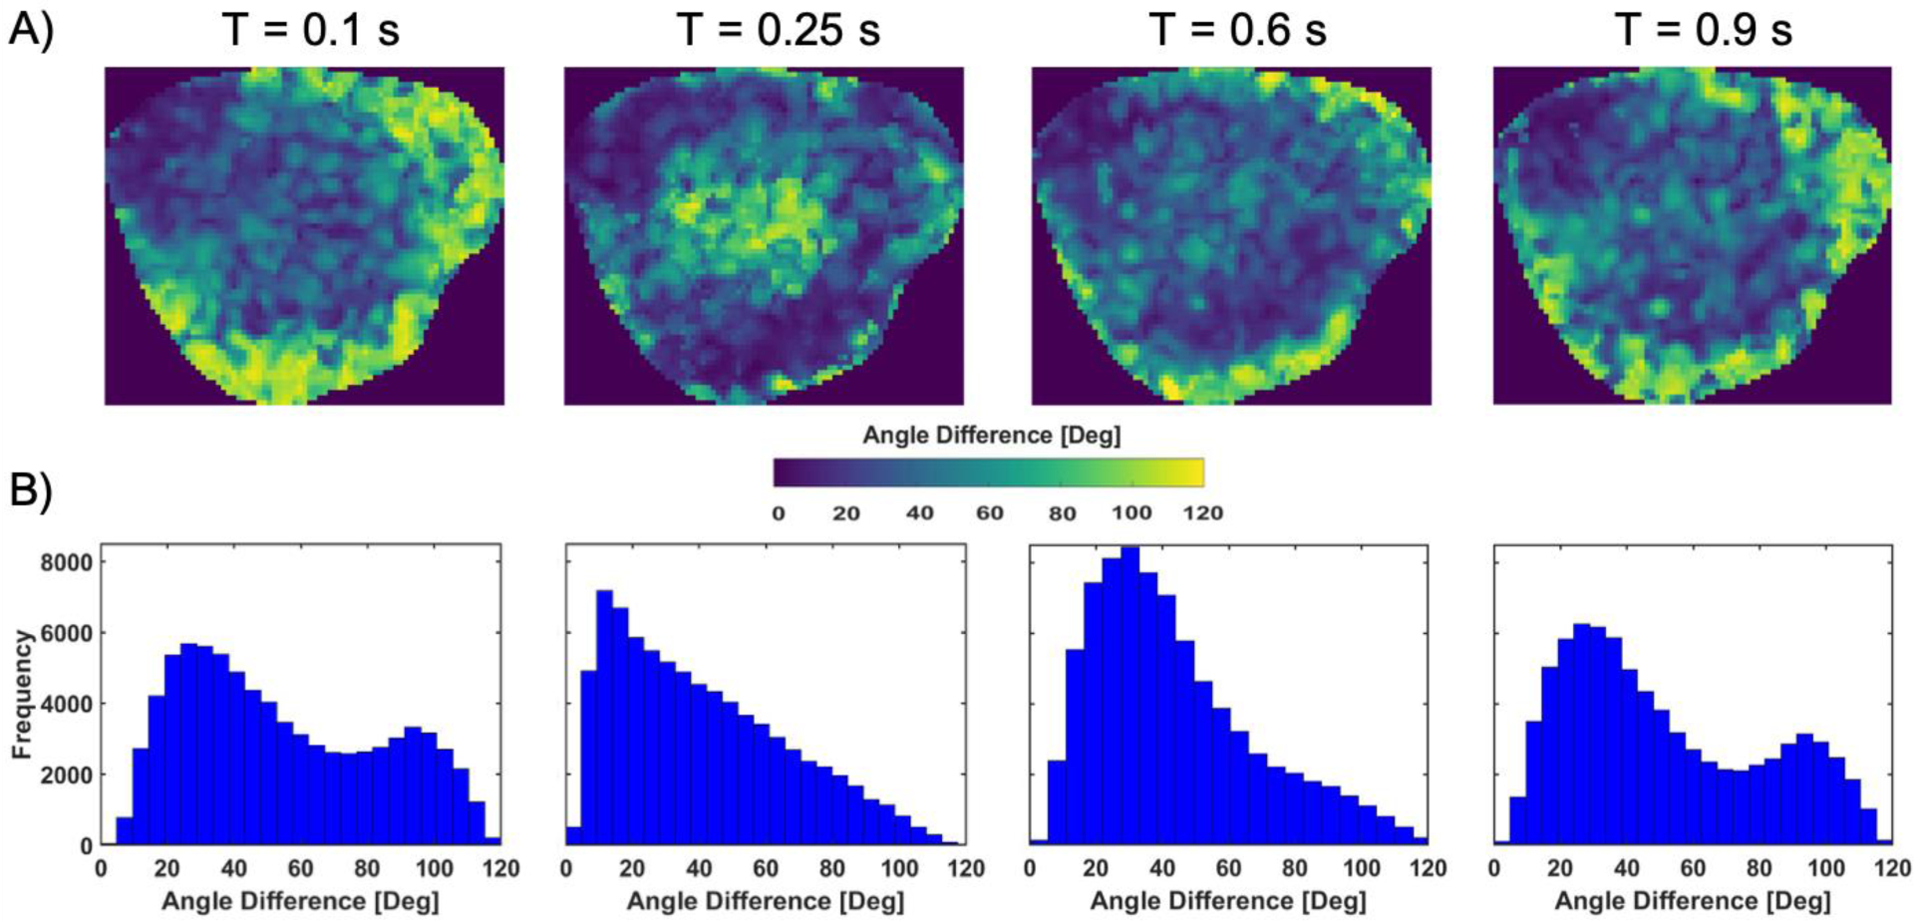
A) Averaged angle difference between two velocity vectors of two cardiac cycles, calculated by their dot product, at the location and the time-points shown in Figure 4B. B) Histograms showing the frequency of angle difference for the acquired volume at the corresponding times.
The one-way ANOVA analysis for the undersampled data when matching temporal and spatial resolutions resulted in p-values of 0.0241 and 0.0652, respectively. This analysis showed no significant difference when cardiac cycles were compared with the undersampled data with a spatial resolution of 0.5 × 0.5 × 0.5 mm while maintaining a high image rate. Furthermore, the ANOVA analysis for the data matching the temporal and spatial resolutions of 4D Flow MRI resulted in a p-value of 0.9727.
5.2. Tomo-PIV and 4D Flow MRI Comparison
Velocity results from 4D Flow MRI and the characteristic cycle from tomo-PIV were qualitatively analyzed using velocity streamlines, as shown in Figure 6. This visualization shows the complexity of the flow inside the aneurysm sac, where flow enters with high velocities through the aneurysm neck, recirculates clockwise, and leaves through the right corner of the neck. Although agreement can be observed between techniques, a slight overestimation of the velocities was seen at peak-systole with 4D Flow MRI. In addition, the recirculation on the right side of the aneurysm sac was not visible with 4D Flow MRI.
Figure 6:
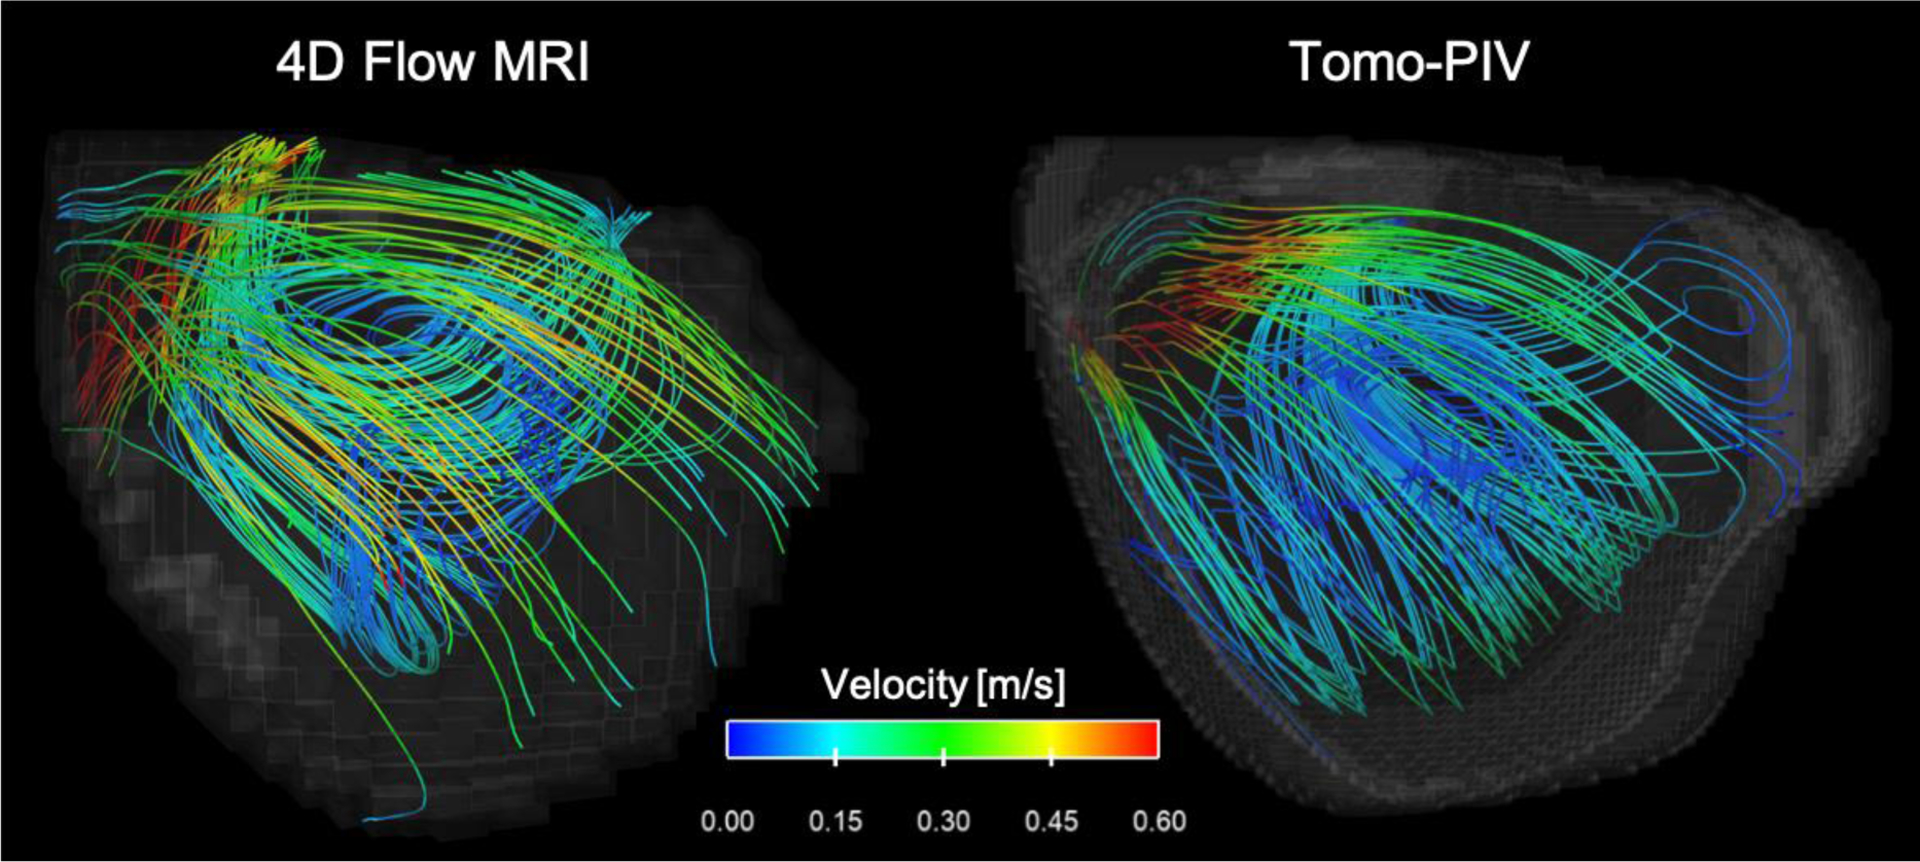
Velocity streamlines for 4D Flow MRI and tomo-PIV at peak-systole (T = 0.25 s).
Figure 7A shows the time-averaged WSS on the aneurysm estimated using the velocities measured with 4D Flow MRI and the velocities from the characteristic cycle obtained with tomo-PIV. A small section of the aneurysm wall was not included in the field of view, so this area has zero velocity and hence shows zero WSS. Tomo-PIV identified a low WSS region not visible with 4D Flow MRI at the same location of flow recirculation seen by the velocity streamlines (Figure 6). Both techniques identified regions of high WSS where the flow jet enters the aneurysm. However, 4D Flow MRI shows a larger area of medium WSS downstream from the inlet jet. This was also seen in the complete distribution shown in Figure 7B, where 4D Flow MRI shows a slight overestimation of the mean WSS.
Figure 7:
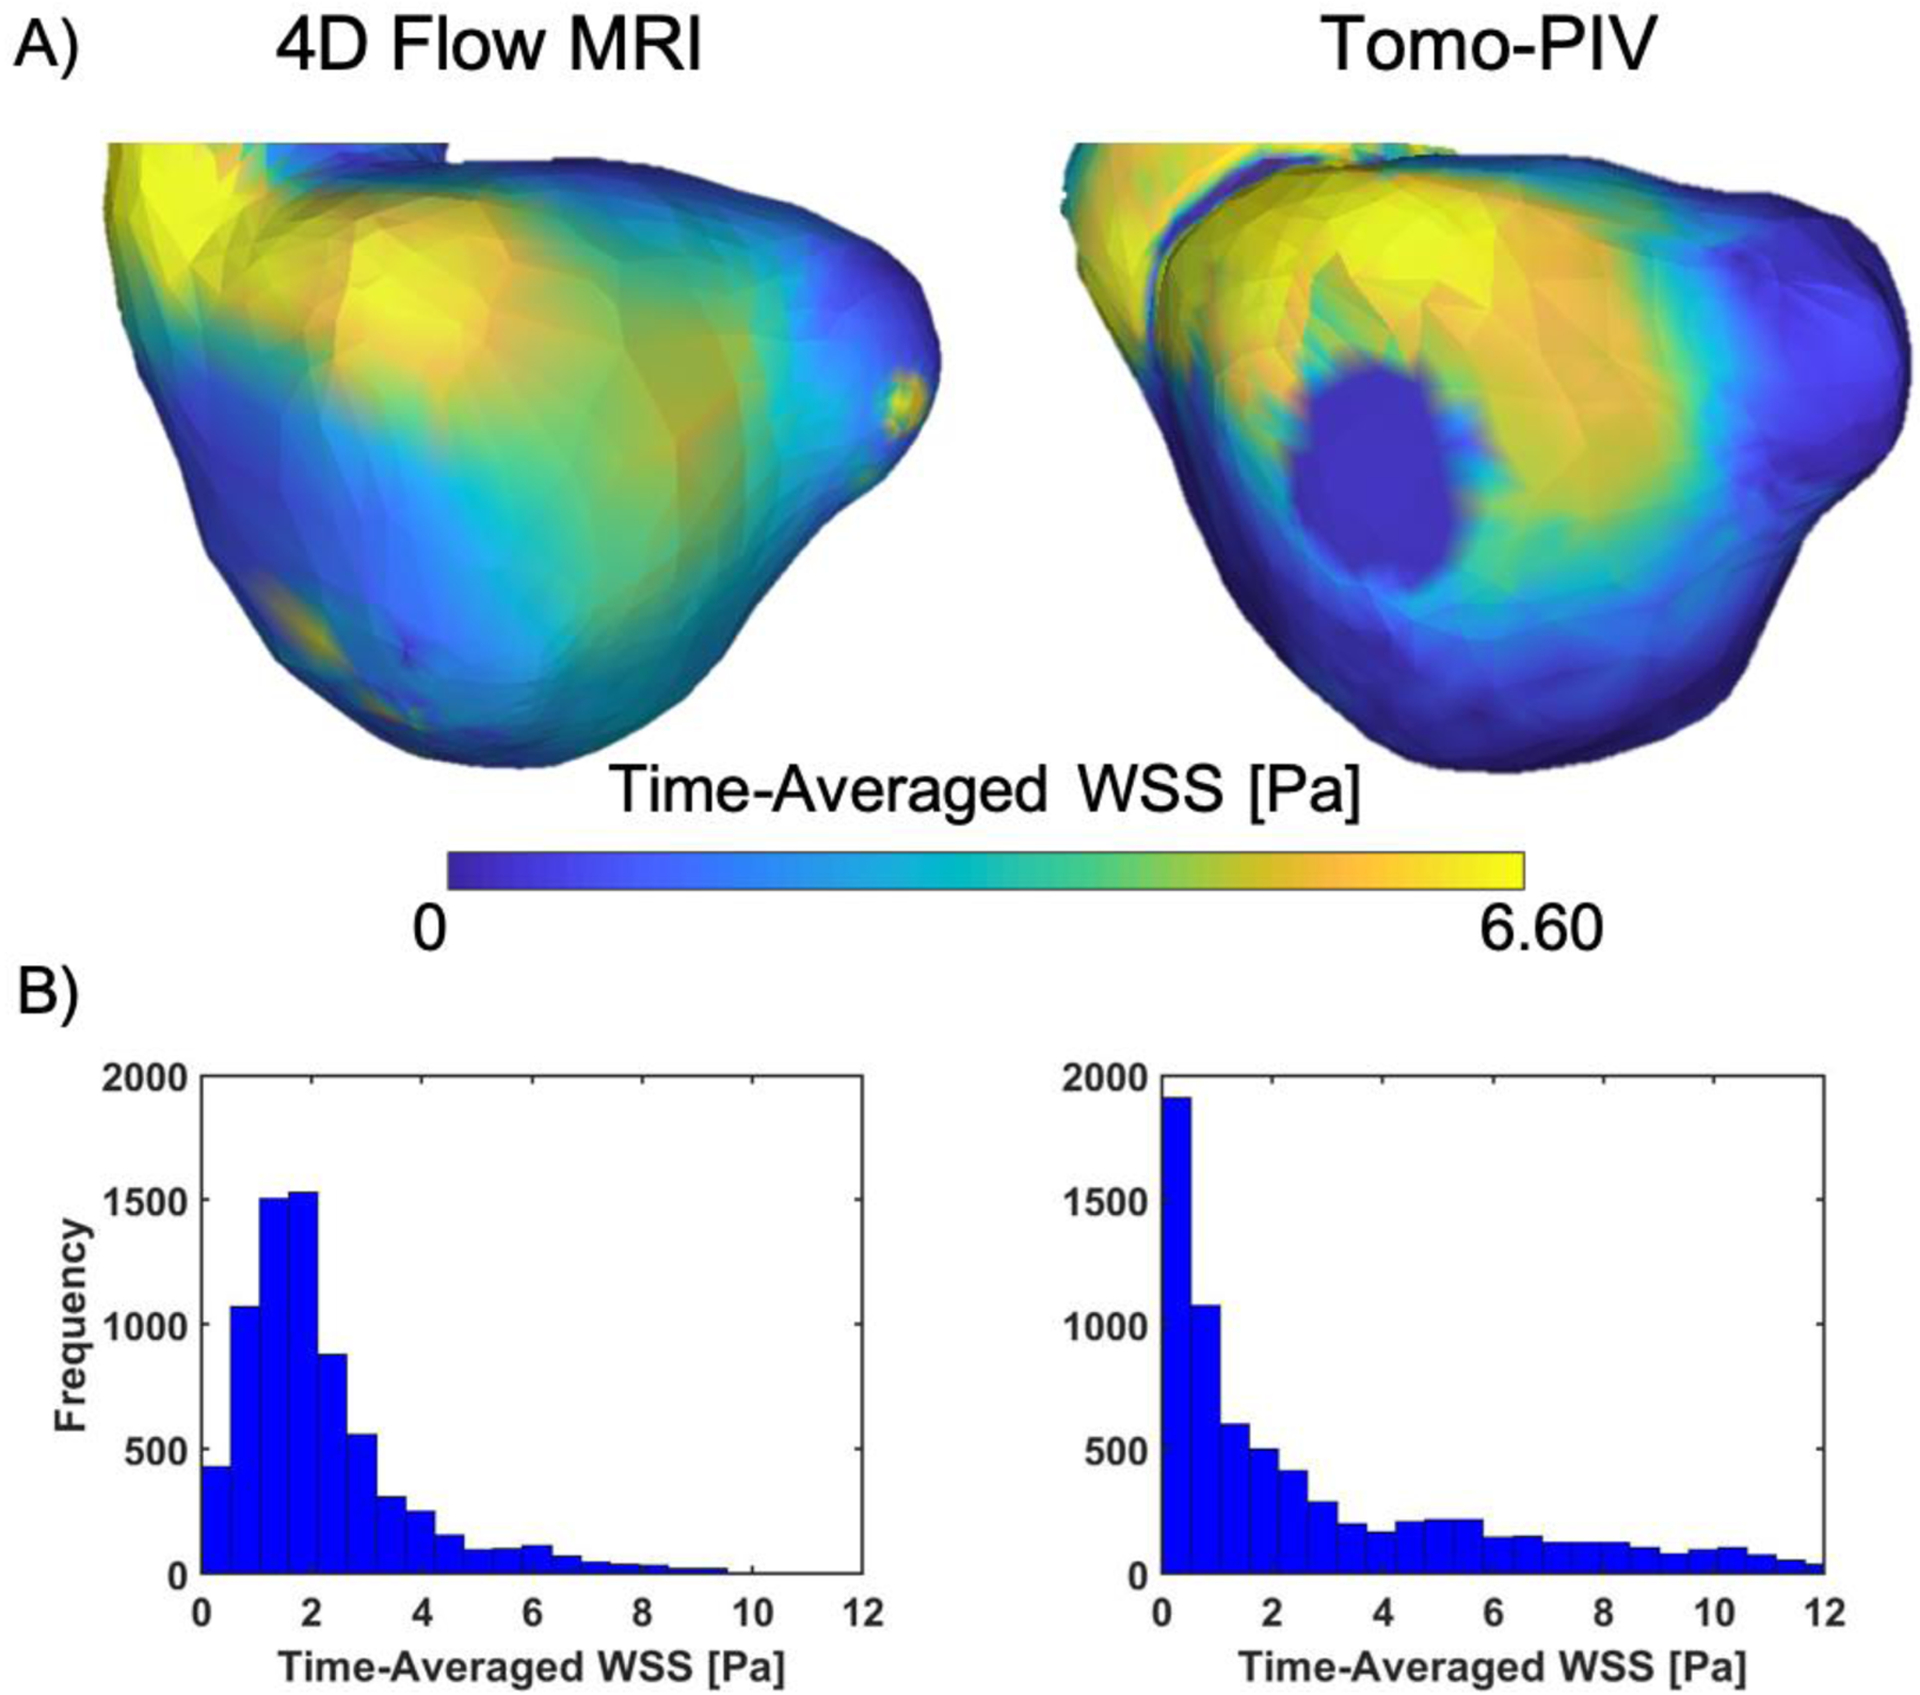
A) Time-averaged WSS. B) Histograms representing the complete distribution of time-averaged WSS. The region with no WSS was not considered for the tomo-PIV distribution.
A point-by-point comparison between PIV and 4D Flow MRI was made using extracted planes matching temporal and spatial resolutions at three locations of interest. Figure 8 shows Bland-Altman plots representing the differences in velocity components and velocity magnitude between the time-averaged data. These show good agreement with the largest velocity bias in Vy (3.86 ± 4.78, 2.13 ± 4.09, and 3.20 ± 4.99 (cm/s) for locations 1, 2, and 3, respectively). This difference in the y-component of the velocity is well represented in Figure 6 by the velocity streamlines. Each average velocity component, Vx, Vy, Vz, was also compared between techniques calculating RMSE of 1.78, 2.31, 1.98 (cm/s), and correlation coefficient (R) values of 0.89, 0.64, 0.90, respectively. Again, Vy showed to be the biggest contributor to error.
Figure 8:
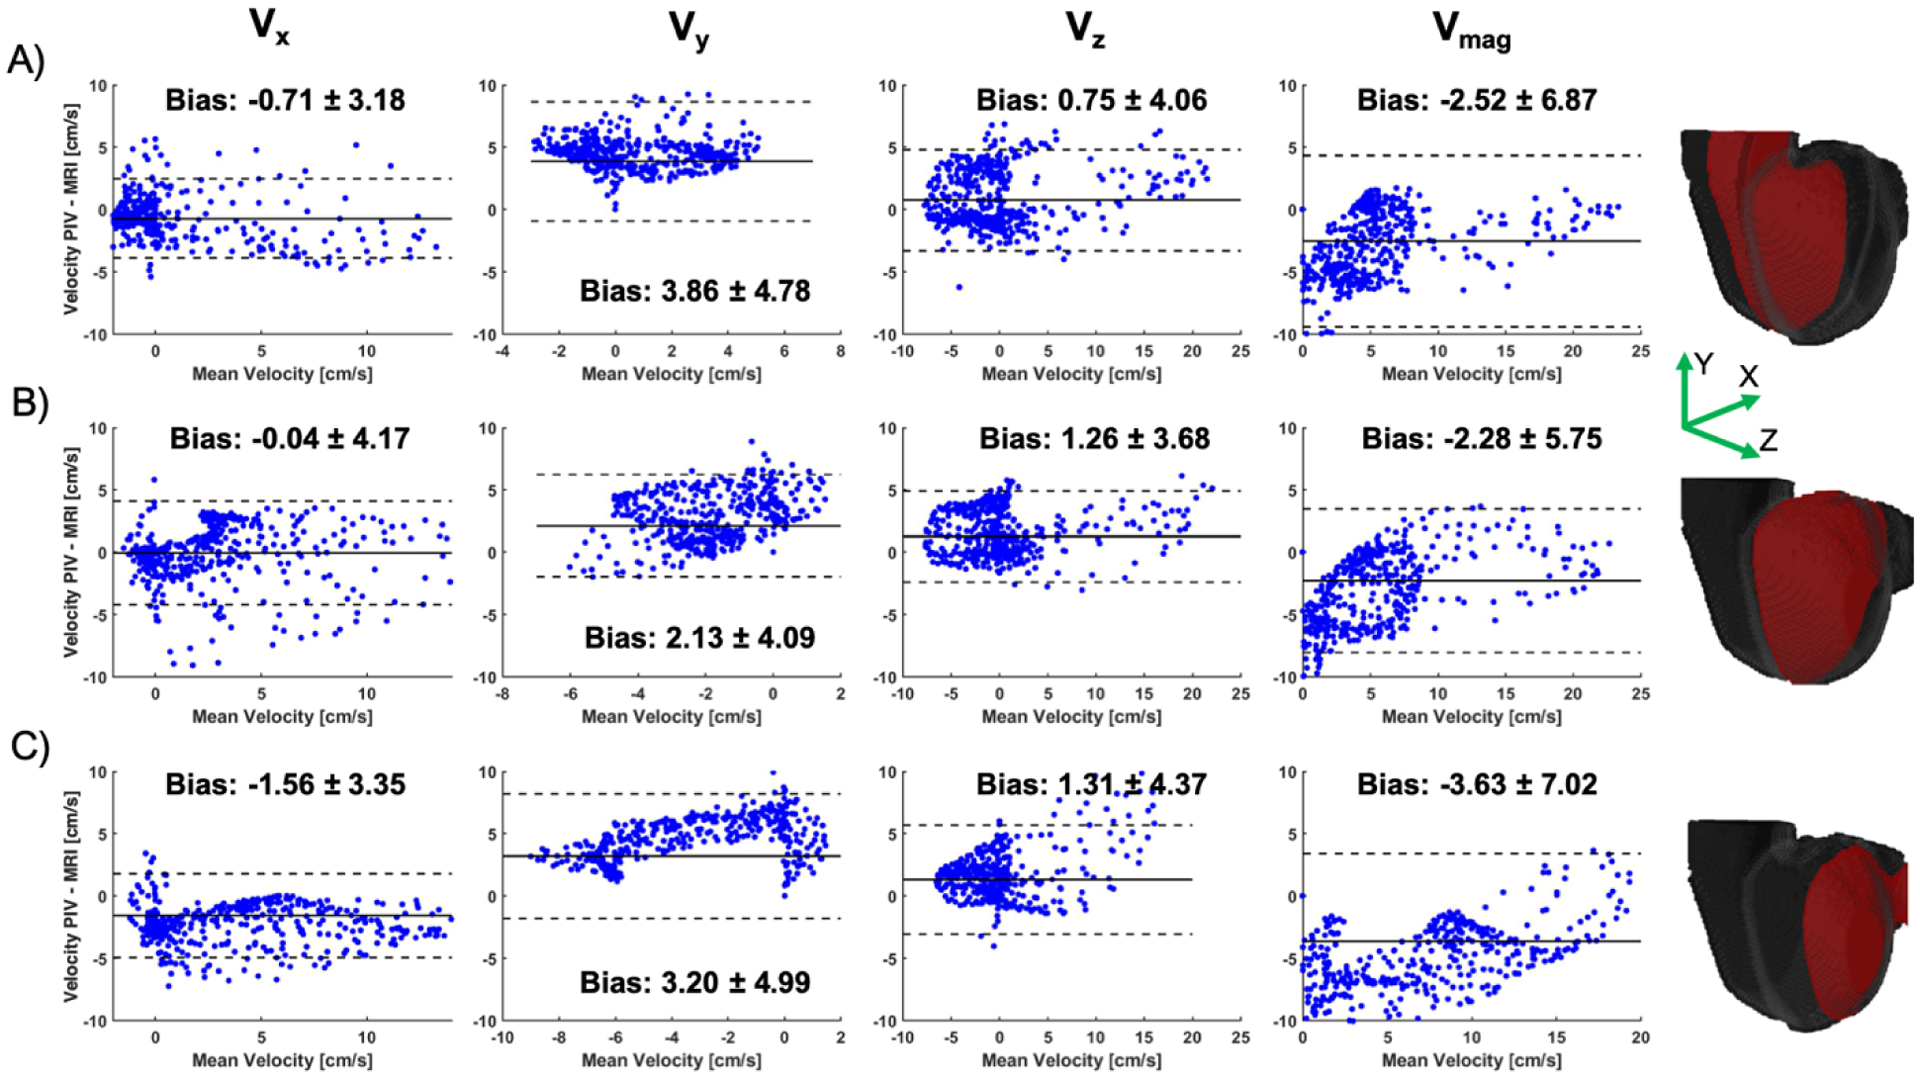
Bland-Altman plots showing the difference in time-averaged velocity components (Vx, Vy, Vz and Vmag) at three locations (A-C) in the volume. These locations are shown by the red planes on the right.
6. DISCUSSION
Controlled in vitro experiments with high spatial and temporal resolution are essential to evaluate and analyze flows in intracranial aneurysms in order to expand the clinical use of 4D Flow MRI and measure its reliability in disease assessment. This project builds upon a previous comparison of 4D Flow MRI and tomo-PIV18 in an idealized endovascular model. Here we provide not only a qualitative analysis but also a point-by-point comparison in a patient-specific intracranial aneurysm model. Specifically, this study was aimed at providing the next step to validate 4D Flow MRI as a clinical tool and to understand and assess disturbed flows under pulsatile conditions, as seen in intracranial aneurysms. The higher temporal and spatial resolution of tomo-PIV allows for the assessment of cycle-to-cycle fluid dynamics variations caused by the pulsatile nature of cardiovascular flows. Additionally, it allows for the calculation of derived parameters, such as WSS.
Regions of high cycle-to-cycle variation in flow dynamics were found (Figure 5), with the largest differences occurring during end-diastole, as shown by the histograms. While high variability was seen at full spatial and temporal resolutions, the differences were not significant when the data were undersampled to match the resolution of 4D Flow MRI. However, the variability was still statistically significant when only the temporal resolution was undersampled, suggesting that spatial resolution was the main contributor to the assessment of cycle-to-cycle variability.
A qualitative agreement was found when comparing velocities obtained with 4D Flow MRI and tomo-PIV. Similar velocity magnitudes and flow fields were seen with both techniques. The high velocities caused by the inlet jet at peak-systole (T = 0.25 s) were captured well with MRI (Figure 6). Additionally, the velocity streamlines analysis (Figure 6) shows that volumetric flow fields from 4D Flow MRI and tomo-PIV are qualitatively similar in flow behavior, with some disparities in the vortex orientation. These are commonly found in MRI acquisitions with accelerating flows and complex patterns due to displacement artifacts;8,15 however, these were minimal in this study. Furthermore, a slight overestimation of the velocities at peak-systole and a missing recirculation region in the MRI results, suggest that the velocity encoding (Venc) selected was suboptimal. This motivates the need for development and implementation of dual-Venc protocols that allows for quantification of high and low velocities.
The quantitative results show good agreement between the velocity values measured with 4D Flow MRI and those from the averaged data set from tomo-PIV, as denoted by the correlation coefficients of each velocity component. The greatest difference between velocities resulting from 4D Flow MRI and tomo-PIV was in Vy, which was consistent along the entire volume. The velocity bias for the velocity magnitude was also affected by Vy, as illustrated by the Bland-Altman plots in Figure 8. Although this analysis did not include the individual time-points of the cardiac cycle, the resulting correlation coefficient and velocity bias was representative of the individual calculations.
Statistically significant differences between cardiac cycles are likely due to the aneurysm flow characteristics and its pulsatile nature, not a repeatability error while acquiring tomo-PIV. It is then possible that the acquisition and averaging of four cardiac cycles is not sufficient to create a comparable data set to the 720 cycles that are averaged in the 4D Flow MRI dataset. However, there remains a relationship between average velocity values within the aneurysm captured from 4D Flow MRI and those measured with tomo-PIV. Cycle-to-cycle differences in aneurysmal flow are important to acknowledge and make the time-resolved nature of 4D Flow MRI possibly more beneficial for analyzing intracranial aneurysms.
Limitations of the in vitro experiments with tomo-PIV in this study include the lack of plane registration for the spatial comparison, which may contribute to differences in the point-by-point velocity comparisons. However, special care was taken to maintain even plane spacing between techniques. Another limitation was the need to scale the aneurysm geometry by a factor of 2 due to the camera setup and lens restrictions. This has an effect on the WSS calculations of 4D Flow MRI since high noise near the wall is expected due to the spatial resolution, which can result in higher discrepancies than the ones obtained here. Another limitation was the need for a laser thickness of 4 mm to maintain accurate velocity measurements, which did not cover the entire aneurysm on a single acquisition. Increasing the laser thickness with the presented camera setup can cause a decrease in the signal to noise ratio and an increase in uncertainty.3
In conclusion, this study showed the feasibility of patient-specific in-vitro experiments of intracranial aneurysms to assess 4D Flow MRI, resulting in a good quantitative and qualitative agreement compared to velocity measurements obtained from tomo-PIV under pulsatile conditions. This work showed a significant difference in the direction and magnitude of PIV-derived velocities measured in different cardiac cycles at high image rates. However, this difference decreases when averaging in time and space to match the resolutions of 4D Flow MRI. The results showed strongly suggest that tomo-PIV can serve as a validation technique for 4D Flow MRI in patient-specific intracranial aneurysm models with high repeatability in the measurements. Thanks to the superior temporal and spatial resolution of PIV, tomo-PIV has the potential to study multiple clinical applications seeking to improve understanding of complex flow regimes such as turbulent flow and boundary layer effects. Furthermore, the use of 4D Flow MRI provides a helpful, non-invasive tool to assess intracranial aneurysm flows. With future work, it may be a platform to study and understand how physiological parameters may induce aneurysm rupture.
ACKNOWLEDGEMENTS
The authors are grateful to the Medical Physics Department for the MRI acquisition support at the University of Wisconsin-Madison, Carson Hoffman for his assistance with writing scripts in MATLAB, and Dr. Charles Strother for his critical comments preparing the manuscript. This study was partially supported by a K12 Career Development Award, K12DK100022.
Footnotes
CONFLICT OF INTEREST
The authors state that there are no conflicts of interest related to this research study.
REFERENCES
- 1.Bieging ET, Frydrychowicz A, Wentland A, Landgraf BR, Johnson KM, Wieben O, and François CJ. In vivo three-dimensional mr wall shear stress estimation in ascending aortic dilatation. J. Magn. Reson. Imaging 33:589–597, 2011. [DOI] [PMC free article] [PubMed] [Google Scholar]
- 2.Brindise MC, Rothenberger S, Dickerhoff B, Schnell S, Markl M, Saloner D, Rayz VL, and Vlachos PP. Multi-modality cerebral aneurysm haemodynamic analysis: in vivo 4D flow MRI, in vitro volumetric particle velocimetry and in silico computational fluid dynamics . J. R. Soc. Interface 16:20190465, 2019. [DOI] [PMC free article] [PubMed] [Google Scholar]
- 3.Buchmann NA, Atkinson C, Jeremy MC, and Soria J. Tomographic particle image velocimetry investigation of the flow in a modeled human carotid artery bifurcation. Exp. Fluids 50:1131–1151, 2011. [Google Scholar]
- 4.Chang W, Frydrychowicz A, Kecskemeti S, Landgraf B, Johnson K, Wu Y, Wieben O, Mistretta C, and Turski P. The effect of spatial resolution on wall shear stress measurements acquired using radial phase contrast magnetic resonance angiography in the middle cerebral arteries of healthy volunteers: Preliminary results. Neuroradiol. J 24:115–120, 2011. [DOI] [PMC free article] [PubMed] [Google Scholar]
- 5.Elkins CJ, and Alley MT. Magnetic resonance velocimetry: Applications of magnetic resonance imaging in the measurement of fluid motion. Exp. Fluids 43:823–858, 2007. [Google Scholar]
- 6.Elsinga GE, Scarano F, Wieneke B, and Van Oudheusden BW. Tomographic particle image velocimetry. Exp. Fluids 41:933–947, 2006. [Google Scholar]
- 7.Ford MD, Nikolov HN, Milner JS, Lownie SP, Demont EM, Kalata W, Loth F, Holdsworth DW, and Steinman DA. PIV-Measured Versus CFD-Predicted Flow Dynamics in Anatomically Realistic Cerebral Aneurysm Models. J. Biomech. Eng 130:021015, 2008. [DOI] [PubMed] [Google Scholar]
- 8.Frayne R, and Rutt BK. Understanding acceleration-induced displacement artifacts in phase-contrast MR velocity measurements. J. Magn. Reson. Imaging 5:207–215, 1995. [DOI] [PubMed] [Google Scholar]
- 9.Frydrychowicz A, Roldán-Alzate A, Winslow E, Consigny D, Campo CA, Motosugi U, Johnson KM, Wieben O, and Reeder SB. Comparison of radial 4D Flow-MRI with perivascular ultrasound to quantify blood flow in the abdomen and introduction of a porcine model of pre-hepatic portal hypertension. Eur. Radiol 27:5316–5324, 2017. [DOI] [PMC free article] [PubMed] [Google Scholar]
- 10.Gatehouse PD, Keegan J, Crowe LA, Masood S, Mohiaddin RH, Kreitner KF, and Firmin DN. Applications of phase-contrast flow and velocity imaging in cardiovascular MRI. Eur. Radiol 15:2172–2184, 2005. [DOI] [PubMed] [Google Scholar]
- 11.Cerebral J, Ollikainen E, Flow BJC Conditions in the Intracranial Aneurysm Lumen Are Associated with Inflammation and Degenerative Changes of the Aneurysm Wall. AJNR Am J Neuroradiol , 2017.doi: 10.1001/jama.1953.02940200020005 [DOI] [PMC free article] [PubMed] [Google Scholar]
- 12.Johnson KM, and Markl M. Improved SNR in phase contrast velocimetry with five-point balanced flow encoding. Magn. Reson. Med 63:349–355, 2010. [DOI] [PMC free article] [PubMed] [Google Scholar]
- 13.Kang H, Ji W, Qian Z, Li Y, Jiang C, Wu Z, Wen X, Xu W, and Liu A. Aneurysm characteristics associated with the rupture risk of intracranial aneurysms: A self-controlled study. PLoS One 10:1–10, 2015. [DOI] [PMC free article] [PubMed] [Google Scholar]
- 14.Keedy A An overview of intracranial aneurysms. McGill J. Med 9:141–146, 2006. [PMC free article] [PubMed] [Google Scholar]
- 15.Kouwenhoven M, Hofman MBM, and Sprenger M. Motion Induced Phase Shifts in MR: Acceleration Effects in Quantitative Flow Measurements—A Reconsideration. Magn. Reson. Med 33:766–777, 1995. [DOI] [PubMed] [Google Scholar]
- 16.Markl M, Frydrychowicz A, Kozerke S, Hope M, and Wieben O. 4D flow MRI. J. Magn. Reson. Imaging 36:1015–1036, 2012. [DOI] [PubMed] [Google Scholar]
- 17.Meckel S, Leitner L, Bonati LH, Santini F, Schubert T, Stalder AF, Lyrer P, Markl M, and Wetzel SG. Intracranial artery velocity measurement using 4D PC MRI at 3 T: Comparison with transcranial ultrasound techniques and 2D PC MRI. Neuroradiology 55:389–398, 2013. [DOI] [PubMed] [Google Scholar]
- 18.Medero R, Hoffman C, and Roldán-Alzate A. Comparison of 4D Flow MRI and Particle Image Velocimetry Using an In Vitro Carotid Bifurcation Model. Ann. Biomed. Eng , 2018.doi: 10.1007/s10439-018-02109-9 [DOI] [PMC free article] [PubMed] [Google Scholar]
- 19.van Ooij P, Guédon A, Poelma C, Schneiders J, Rutten MCM, Marquering HA, Majoie CB, van Bavel E, and Nederveen AJ. Complex flow patterns in a real-size intracranial aneurysm phantom: Phase contrast MRI compared with particle image velocimetry and computational fluid dynamics. NMR Biomed. 25:14–26, 2012. [DOI] [PubMed] [Google Scholar]
- 20.Qiu T, Jin G, Xing H, and Lu H. Association between hemodynamics, morphology, and rupture risk of intracranial aneurysms: a computational fluid modeling study. Neurol. Sci 38:1009–1018, 2017. [DOI] [PMC free article] [PubMed] [Google Scholar]
- 21.Rinkel GJE, Djibuti M, Algra A, and van Gijn J. Prevalence and Risk of Rupture of Intracranial Aneurysms. Stroke 29:251–256, 1998. [DOI] [PubMed] [Google Scholar]
- 22.Roldán-Alzate A, García-Rodríguez S, Anagnostopoulos PV, Srinivasan S, Wieben O, and François CJ. Hemodynamic study of TCPC using in vivo and in vitro 4D Flow MRI and numerical simulation. J. Biomech 48:1325–1330, 2015. [DOI] [PMC free article] [PubMed] [Google Scholar]
- 23.Roloff C, Stucht D, Beuing O, and Berg P. Comparison of intracranial aneurysm flow quantification techniques: standard PIV vs stereoscopic PIV vs tomographic PIV vs phase-contrast MRI vs CFD. J. Neurointerv. Surg neurintsurg-2018–013921, 2018.doi: 10.1136/neurintsurg-2018-013921 [DOI] [PubMed] [Google Scholar]
- 24.Ruedinger KL, Medero R, and Roldán-Alzate A. Fabrication of Low-Cost Patient-Specific Vascular Models for Particle Image Velocimetry. Cardiovasc. Eng. Technol 10:500–507, 2019. [DOI] [PMC free article] [PubMed] [Google Scholar]
- 25.Scarano F Tomographic PIV: Principles and practice. Meas. Sci. Technol 24:, 2013. [Google Scholar]
- 26.Schnell S, Ansari SA, Vakil P, Wasielewski M, Carr ML, Hurley MC, Bendok BR, Batjer H, Carroll TJ, Carr J, and Markl M. Three-dimensional hemodynamics in intracranial aneurysms: Influence of size and morphology. J. Magn. Reson. Imaging 39:120–131, 2014. [DOI] [PMC free article] [PubMed] [Google Scholar]
- 27.Sciacchitano A, and Wieneke B. PIV uncertainty propagation. , 2016.doi: 10.1088/0957-0233/27/8/084006 [DOI] [Google Scholar]
- 28.Stankovic Z, Allen BD, Garcia J, Jarvis KB, and Markl M. 4D flow imaging with MRI. Cardiovasc. Diagn. Ther 4:173–92, 2014. [DOI] [PMC free article] [PubMed] [Google Scholar]
- 29.Stankovic Z, Csatari Z, Deibert P, Euringer W, Jung B, Kreisel W, Geiger J, Russe MF, Langer M, and Markl M. A feasibility study to evaluate splanchnic arterial and venous hemodynamics by flow-sensitive 4D MRI compared with Doppler ultrasound in patients with cirrhosis and controls. Eur. J. Gastroenterol. Hepatol 25:669–75, 2013. [DOI] [PubMed] [Google Scholar]
- 30.Ugron Á, Farinas MI, Kiss L, and Paál G. Unsteady velocity measurements in a realistic intracranial aneurysm model. Exp. Fluids 52:37–52, 2012. [Google Scholar]
- 31.Wentland AL, Grist TM, and Wieben O. Repeatability and Internal Consistency of Abdominal 2D and 4D Phase Contrast MR Flow Measurements. Acad. Radiol 20:699–704, 2013. [DOI] [PMC free article] [PubMed] [Google Scholar]
- 32.Wieneke B Volume self-calibration for 3D particle image velocimetry. Exp. Fluids 45:549–556, 2008. [Google Scholar]
- 33.Yagi T, Sato A, Shinke M, Takahashi S, Tobe Y, Takao H, Murayama Y, and Umezu M. Experimental insights into flow impingement in cerebral aneurysm by stereoscopic particle image velocimetry : transition from a laminar regime. , 2013. [DOI] [PMC free article] [PubMed] [Google Scholar]


