

Summary
Mature body size is genetically correlated with growth rate, an important economic trait in the sheep industry. Mature body size has been studied extensively in humans as well as cattle and other domestic animal populations but not in sheep. Six‐hundred and sixteen ewes, across 22 breeds, were measured for 28 linear measurements representing various skeletal parts. PCA from these measures generated principal components 1 and 2 which represented 66 and 7% of the phenotypic variation respectively. Two‐hundred and twenty sheep were genotyped on the Illumina Ovine HD beadchip for a GWAS investigating mature body size and linear body measurements. Forty‐six (Bonferroni P < 0.05) SNP associations across 14 chromosomes were identified utilizing principal component 1, representing overall body size, revealing mature body size to have fewer loci of large effect than other domestic species such as dogs and horses. Genome‐wide associations for individual linear measures identified major quantitative trait loci for withers height and ear length. Withers height was associated (Bonferroni P < 0.05) with 12 SNPs across six chromosomes whereas ear length was associated with a single locus on chromosome 3, containing MSRB3. This analysis identified several loci known to be associated with mature body size in other species such as NCAPG, LCORL, and HMGA2. Mature body size is more polygenic in sheep than other domesticated species, making the development of genomic selection for the trait the most efficient option for maintaining or reducing mature body size in sheep.
Keywords: complex trait, ear length, genome‐wide association studies, principal component analysis, withers height
Introduction
Growth rate is an important economic trait for sheep producers in the USA because live weight at slaughter or carcass weight determines a producer’s income from lamb sales. Taylor (1980) showed that mature size can be used as the only parameter in a model of growth curves. Therefore, as producers select lambs for increased growth rates, an increase in mature body size is likely to occur as an unintended consequence (Herd et al. 1993; Borg et al. 2009). Mature weight has been shown to be heritable with estimates of 0.30 in the Chios breed, 0.38–0.53 in Targhee, 0.73–0.76 in South African Merino and 0.41–0.43 in Lleyn (Mavrogenis & Constantinou 1990; Borg et al. 2009; Ceyhan et al. 2015; Nemutandani et al. 2018). US sheep breeds vary in mature weight from a low of approximately 32 kg seen in breeds such as the Shetland to a high of 114 kg seen in the Suffolk. Increases in mature body size may lead to increased energy demands, resulting in higher feed maintenance requirements of the ewe flock. There are also indirect impacts on handling facilities designed for smaller sheep and physical handling may become more difficult during shearing and other management tasks. Genetic correlations between mature weight and lamb growth rates and weaning weights have been estimated to range from 0.31 to 0.84 across multiple breeds and studies (Mavrogenis & Constantinou 1990; Safari et al. 2007; Borg et al. 2009; Ceyhan et al. 2015; Nemutandani et al. 2018). Whereas improved growth rate results in more lamb being sold, the increase in ewe maintenance and other indirect costs negatively impact a shepherd’s bottom line, reducing the economic benefit.
There have been few studies on using linear measures to estimate mature body size within sheep (Mavule et al. 2013). A previous study estimated heritabilities for various linear body measurements ranging from 0.26 to 0.57 across three different sheep breeds (Janssens & Vandepitte 2004). Linear measurements could be used to estimate mature body size in sheep, similar to frame scoring in cattle (Dhuyvetter 1995). Studies on horses and dogs have used linear measures in PCA successfully to approximate mature body size (Chase et al. 2002; Brooks et al. 2010). Genomic studies on mature body size have been successful in determining the genetic nature of mature body size in cattle, horses and dogs (Sutteret al. 2007; Pryce et al. 2011; Makvandi‐Nejad et al. 2012; Bouwman et al. 2018).
Previous GWASs in sheep have focused on mapping growth rates, weight, height and other carcass traits (Al‐Mamun et al. 2015; Bolormaa et al. 2016; Kominakis et al. 2017; Zhang et al. 2019), but to date, no GWASs have been reported specifically for mature body size in sheep. These studies have associated weight and height with genes such as NCAPG and LCORL (Al‐Mamun et al. 2015), which appear to be shared across mammals for influencing mature body size, whereas others have highlighted a single aspect of body size such as associating SMARCA5 and GAB1 with chest width in the Hulun Buir sheep (Zhang et al. 2019). The aim of this study was to identify genetic associations with mature body size across several sheep breeds present within the US.
Materials and methods
Sample collection
All sampling followed Cornell University’s Institutional Care and Use Committee Standards (Protocol no. 2014‐0121) for animal handling after obtaining owner consent from private commercial flocks. Whole blood was collected from the jugular vein into 10 ml vacutainers with K2EDTA anticoagulant. DNA was extracted from whole blood using the Qiagen Puregene Protocol (Gentra Systems Inc.) and stored at −80°C until genotyping.
The following measurements were collected, modeled after those used in horses and dogs (Sutter et al. 2007; Brooks et al. 2010): (1) eye to eye, (2) ear to ear, (3) head length, (4) jaw width, (5) muzzle circumference, (6) left eye to mouth, (7) left eye to jaw, (8) left ear length, (9) neck circumference, (10) chest girth, (11) maximum girth, (12) neck length, (13) withers to dock, (14) chest width, (15) forearm length, (16) fore cannon length, (17) fore pastern length, (18) fore cannon circumference, (19) fore pastern circumference, (20) fore hoof circumference, (21) dock to stifle length, (22) stifle to hock length, (23) hind cannon length, (24) hind pastern length, (25) hind cannon circumference, (26) hind pastern circumference, (27) hind hoof circumference, (28) withers height and (29) height at the hips. A brief description of each measure can be found in Appendix S1. Skeletal measures were chosen instead of adult weight because adult weight is not regularly recorded within some US sheep flocks and does not distinguish between body shapes or size variations.
All measures were collected with a flexible tape measure pulled taut against the skin to ensure minimal variability from wool length differences. Measurements were taken within four weeks of shearing for wool sheep or after spring shedding and prior to winter wool growth in hair sheep, which prevented wool length from being an impediment to collecting body measurements and minimized variation owing to wool or hair growth. All ewes measured were at least one and a half years of age. Sheep were restrained, either tied by a halter or held by the head. All measures were collected by a single data collector to minimize potential bias. Maximum girth was excluded from subsequent analysis owing to varying pregnancy status among ewes measured. Ewes were sampled to represent a diversity of breeds in breed groups, economic uses and mature body sizes. Six‐hundred and sixteen ewes, across 22 breeds, had a full set of the 28 measures for use in downstream analysis. This dataset includes breeds such as Suffolk and Hampshire that represent common large breeds used as terminal sires in the US sheep industry. At the other end of the size spectrum are Shetland, Jacob and Icelandic, representing smaller breeds primarily used for wool within the US. We were fortunate to sample nine breeds listed as heritage breeds by the Livestock Conservancy™, representing genetically unique populations with varying body sizes, which included the Romeldale, Jacob, Hog Island, Clun Forest and others. The number of ewes measured per breed can be found in Table 1.
Table 1.
Number of individuals measured, genotyped, and mean principal component 1 (PC1) score per breed
| Breed | Count | Mean PC1 value (±SD) | |
|---|---|---|---|
| Measured | Genotyped | ||
| Shetland 1 | 9 | 4 | −11.23 ± 1.08 |
| Icelandic | 29 | 4 | −5.80 ± 1.70 |
| Jacob 1 | 28 | 4 | −5.70 ± 1.33 |
| Hog Island 1 | 29 | 4 | −4.94 ± 1.23 |
| Finnsheep | 21 | 4 | −4.84 ± 1.22 |
| Clun Forest 1 | 24 | 4 | −3.74 ± 0.98 |
| Finn × Dorset | 28 | 0 | −3.32 ± 1.46 |
| Romanov × Katahdin | 2 | 2 | −2.72 ± 0.78 |
| Karakul 1 | 12 | 0 | −1.68 ± 0.96 |
| Katahdin | 33 | 33 | −1.65 ± 1.28 |
| California Red | 7 | 0 | −1.44 ± 1.38 |
| Leicester Longwool 1 | 9 | 0 | −0.97 ± 1.14 |
| Scottish Blackface | 10 | 0 | −0.79 ± 0.87 |
| Romeldale 1 | 42 | 0 | −0.38 ± 1.66 |
| Teeswater | 1 | 0 | −0.15 |
| Tunis 1 | 3 | 0 | 0.22 ± 1.89 |
| Dorset | 125 | 62 | 0.49 ± 1.88 |
| Polypay | 30 | 20 | 0.60 ± 1.44 |
| Bluefaced Leicester | 2 | 0 | 1.69 ± 0.27 |
| Lincoln 1 | 8 | 4 | 3.07 ± 1.37 |
| Romney | 59 | 4 | 3.79 ± 1.96 |
| Lincoln cross | 1 | 0 | 4.84 |
| Suffolk | 94 | 67 | 5.98 ± 1.55 |
| Hampshire | 10 | 4 | 7.60 ± 0.87 |
| Total | 616 | 220 | −1.10 × 10 1 ± 4.31 |
Indicates heritage status as determined by The Livestock Conservancy™.
Phenotypic analysis
The six‐hundred and sixteen ewes and 28 measures were used in a correlation matrix PCA, performed using r statistical software (R Core Team 2018). PCA was used to reduce the dimension of the measurement data while retaining as much variance as possible.
Genome‐wide associations
Two‐hundred and twenty ewes representing 14 breeds were genotyped on the Illumina Ovine HD SNP chip (Illumina Inc.). Some individuals had already been genotyped for prior studies (Posbergh et al. 2019) so additional ewes were selected to represent the extreme values in body size as reflected in PC1 score. The number of ewes genotyped per breed can be found in Table 1. Quality control was applied, and SNPs were retained if they passed the following thresholds: SNP MAF greater than 0.01, SNP call rate greater than 0.9, individual call rate greater than 0.9, mapped on the autosomes and no more than two alleles per SNP. Following this quality control, 217 ewes and 506 939 SNPs were utilized for the associations. GWAs were performed using emmax to fit the genomic relationship matrix as a random effect to adjust for potential population structure in the dataset (Kang et al. 2010). An additive model was used, and no additional covariates or fixed effects were added. Phenotypes utilized for GWA were principal components 1 and 2 and individual body measures using the full dataset of 217 ewes. A Bonferroni threshold of 0.05 was used to account for multiple testing. Genome coordinates are from the rambouillet version 1.0 assembly. Quality control and genome‐wide associations were performed using the SNP and variation suite (version 8.7.2 win64; Golden Helix www.goldenhelix.com). Candidate genes were considered if they were within a 1 Mb window surrounding an associated marker.
Results
Body measures and PCA
Principal component 1 (PC1) had all 28 factors significantly loading (>0.40) in the same direction and was interpreted as overall mature body size (Fig. 1). Figure 2 shows the distribution of PC1 scores sorted by the median value of each breed for breeds which had five or more individuals sampled. Principal component 2 (PC2) was predominantly influenced by jaw width and neck circumference loading negatively and fore cannon length loading positively (>0.40; Fig. 1). Despite the rest of the loadings being less than 0.40, nearly all of the widths and circumferences loaded in one direction whereas the lengths loaded in the opposite direction, leading us to interpret PC2 as overall thickness. The remaining 26 PCs explained little phenotypic variance (<3% individually) and the loadings became increasingly difficult to interpret so we chose to utilize only PC1 and PC2 for further study. Principal components 1 and 2 explained 66.3 and 7.85% of the phenotypic variance respectively. See Fig. 3 for a scatterplot of PC1 vs. PC2 across the 616 measured ewes.
Figure 1.
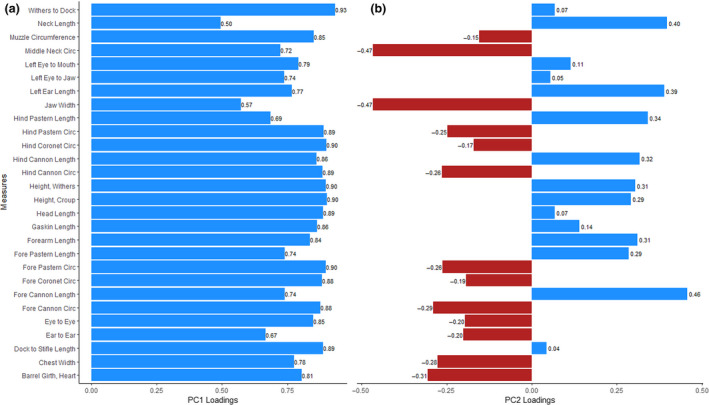
Factor loadings for individual linear measures within principal components 1 and 2. A blue bar indicates a positive loading value and a red bar indicates a negative loading value. (a) Principal component 1, representing overall body size, shows all positive loading values for linear measures. (b) Principal component 2 generally distinguishes body thickness from length
Figure 2.
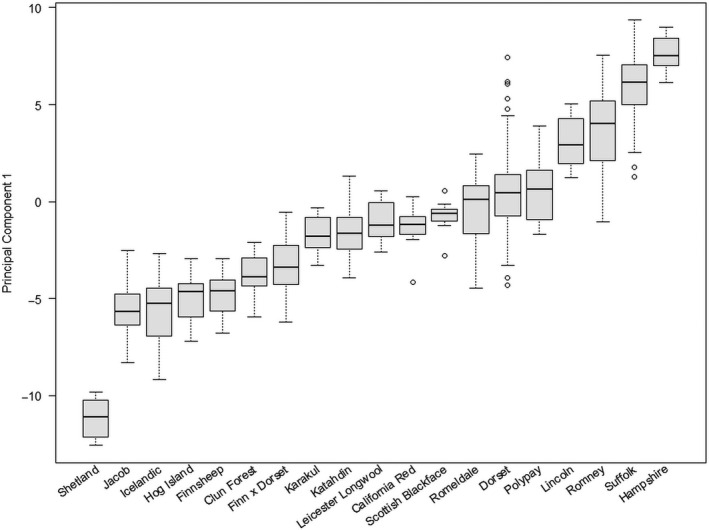
Boxplot of linear body measure principal component 1 scores sorted by median values for each breed. Only breeds which had five or more ewes were included in this figure. Whiskers indicate 1.5× the interquartile range, whereas open circles indicate sampled data points
Figure 3.
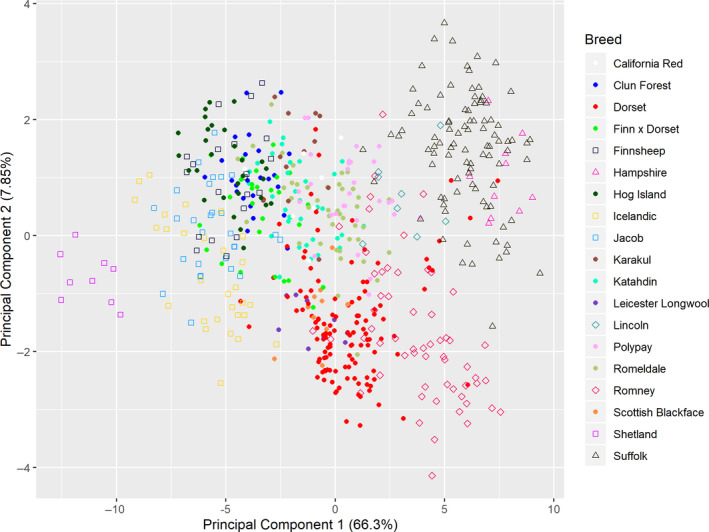
Scatterplot of principal components 1 and 2 from linear body measures (n = 607 excluding breeds with fewer than five samples per breed). Principal component 1 is represented on the x‐axis and principal component 2 is represented on the y‐axis with individual animals colored by breed. Percentage values in parentheses represent the percentage of phenotypic variation explained by the principal component
Genome‐wide associations
Principal components 1 and 2
Forty‐six SNPs, across 14 chromosomes, were associated with PC1 in the across‐breed analysis (Bonferroni corrected P‐value < 0.05; Fig. 4). These associated markers are close (within a 1 Mb window) to genes such as APP,IGFBP2,IGFBP5,HMGA2,MSRB3,NCAPG/LCORL and HOXA and HOXB clusters previously associated with body size in other species (Eckstein et al. 2002; Pearson et al. 2005; Sutter et al. 2007; Pryce et al. 2011; Makvandi‐Nejad et al. 2012; Bouwman et al. 2018). A full listing of PC1‐associated regions and nearby genes can be found in Table S1. The SNP with the highest −log10(P‐value), located on chromosome 10 at 30 964 378 bp, explained 19.6% of the variance. The association with PC2 did not yield any SNP associations which passed a Bonferroni corrected P‐value <0.05 threshold.
Figure 4.
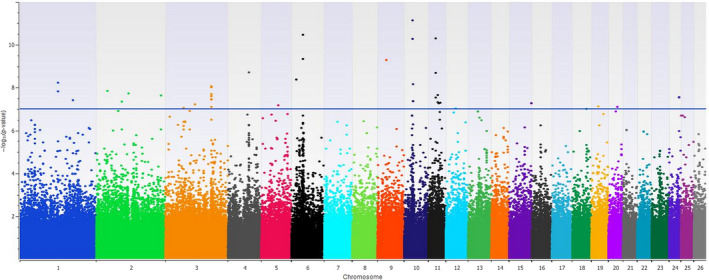
Manhattan plot showing −log10(P‐values) of the association with principal component 1, representing mature body size, in the across‐breed analysis. The horizontal blue line indicates the Bonferroni corrected threshold of 0.05
Withers height
Twelve SNPs, on six chromosomes, were associated (Bonferroni corrected P‐value < 0.05) with withers height in the across‐breed analysis (Fig. 5). Seven SNPs are located on chromosome 3 in the same region as identified in the PC1 analysis containing HMGA2 and MSRB3. The others are located on chromosomes 1, 9, 11, 12 and 20. A full listing of withers height‐associated regions and nearby genes can be found in Table S2.
Figure 5.

Manhattan plot showing −log10(P‐values) of the association with withers height in the across‐breed analysis. The horizontal blue line indicates the Bonferroni corrected threshold of 0.05
Ear length
The association with ear length identified 12 SNPs (Bonferroni P‐value < 0.05) located on chromosome 3 between 165 545 009 and 165 619 012 bp, which includes MSRB3. We also ran the association for ear length with PC1 included as a covariate to account for overall body size as larger sheep are expected to have larger ears (phenotypic r 2 = 0.77). This resulted in five SNPs passing a Bonferroni threshold of 0.05, all of which are a subset of the 12 SNPs associated without the PC1 correction. Figure 6 shows Manhattan plots of the associations for ear length without and with PC1 as a covariate.
Figure 6.
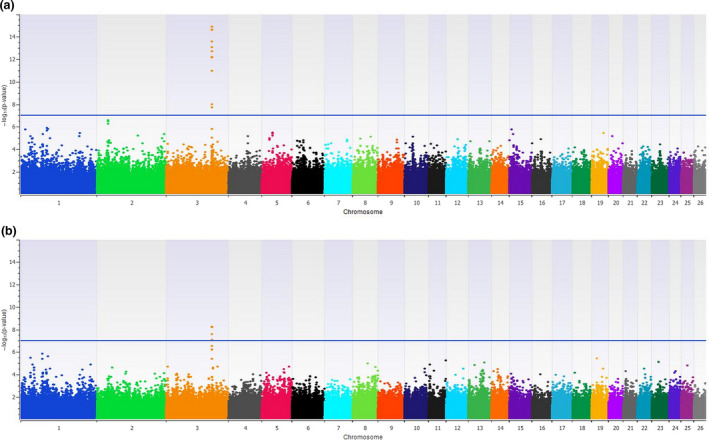
(a) Manhattan plot showing −log10(P‐values) of the association with ear length in the across‐breed analysis. (b) Manhattan plot showing −log10(P‐value) of the association with ear length which included principal component 1 as a covariate in the model. The horizontal blue line indicates the Bonferroni corrected threshold of 0.05
The remaining linear measurements did not yield SNPs which passed a Bonferroni multiple testing corrected P‐value of 0.05.
Discussion
This study found mature body size to have more QTL in sheep, although smaller effect sizes, than in other domesticated species, such as horses and dogs (Sutter et al. 2007; Makvandi‐Nejad et al. 2012). The associated regions highlight loci known to influence body size and shape in livestock such as NCAPG/LCORL,HMGA2 and HOXA/HOXB clusters (Pearson et al. 2005; Sutter et al. 2007; Pryce et al. 2011; Makvandi‐Nejad et al. 2012; Bouwman et al. 2018). Other regions include genes such as IGFBP2 and IGFBP5 which are both involved in regulating IGF action, which influences the rate of growth and development (Kelley et al. 1996). Sixteen genes (APP,BNC2,HMGA2,HOXB3,ITPR1,JAZF1,LCORL,MAP2K4,MSRB3,POLN,SLC7A1,TNFSF12,TNP1,ZBTB4,ZHX2 andZNF652) identified in the PC1 GWAS were previously associated with human height (Wood et al. 2014). This reinforces the conclusion from a cattle meta‐analysis that there is a shared set of genes which regulate mammalian body size (Bouwman et al. 2018). We also identified POLR2A,EIF4A1,ATP1B2,ACADVL,FGF11,TNFSF12 and TNK1 in an associated region on chromosome 11 which overlapped with genes identified in the Frizarta breed by markers suggestively associated (P‐value < 0.10) with body size (Kominakis et al. 2017). However, no other genes identified in Kominakis et al. overlapped with those identified in our PC1 associations. This difference is likely to be a result of looking within a single breed which may be fixed for certain size‐related loci owing to selection for uniformity within a breed. Specifically across breeds, HMGA2 and MSRB3 on chromosome 3 and RXFP2 on chromosome 10 have been found to be under selection across the world’s sheep breeds (Kijas et al. 2012). Similar selection signatures for size‐related genes have been detected around the HOXA cluster, NCAPG/LCORL and LAP3 across Russian sheep breeds (Yurchenko et al. 2019). The present results validate that selection for body size has occurred across sheep breeds by utilizing a direct phenotype instead of a population‐based approach. However, it is likely that this difference in mature body size is due to selection for production traits such as body growth, wool quality and/or milk production rather than strictly selecting for size as seen in various breeds of horses and dogs.
One unique finding was the linked block of markers found on chromosome 3 within methionine sulfoxide reductase B3 (MSRB3) that were associated with ear length. This gene was recently reported by Paris et al. for its association with large and/or floppy ear type in sheep using a population‐based approach (Paris et al. 2020). MSRB3 has also been shown to regulate ear size in pigs (Zhang et al. 2015; Chen et al. 2018) and to be associated with ear shape in dogs in several studies (Boyko et al. 2010; Vaysse et al. 2011; Webster et al. 2015). In contrast, a study investigating ear area in Duolang sheep did not find associations with MSRB3 which is probably due to study design differences such as a single‐breed, lower‐density (~50K) SNP GWA with ear area as the phenotype in their study (Gao et al. 2018) vs. a multibreed approximately 600K SNP GWA with ear length as the phenotype in the current study. Ear shape and size are important characteristics for breed identification in sheep and could influence thermoregulation. This gene is approximately 350 kbp upstream of HMGA2, a known gene influencing size in horses and dogs (Sutter et al. 2007; Makvandi‐Nejad et al. 2012). This region was also identified in the PC1 and withers height GWA, indicating the region is probably pleiotropic; further study is needed to identify the individual effects of each gene within the region on each of these size measures.
We attempted to work with flocks that collected mature and lamb weight records to perform direct associations between linear measurements, mature weight and growth rates. However, too few flocks had those data readily available. Future directions should involve collecting growth weight data, feed intake and mature size to identify the efficiency of animals rather than relying on single measures. For example, the fastest growing lamb may have the largest rate of gain because it consumed more feed and not because it is genetically more efficient, assuming that the lambs being compared are at the same stage of growth. Selecting for efficiency, rather than just growth, will probably optimize the ideal mature body size for a commercial ewe.
Currently sheep selection indexes in the US do not place a significant negative emphasis on mature body size, focusing on increased weaning and post‐weaning growth, lower fiber diameter and/or more lambs weaned. This singular focus on faster early growth is likely to contribute to US sheep increasing to an unsustainable mature body size, affecting management facilities, maintenance costs, processing facilities and ease of handling. Recording adult size on sheep flocks would provide a more precise estimate of mature weights and size across sheep breeds and flocks in the US. Developing automated phenotypic collection for mature body size and weight would probably encourage more frequent and accurate recording across flocks vs. individual measures using a measure tape. Genomic selection and/or marker‐assisted selection should be utilized as possible tools to prevent or limit the consequences arising from increased mature body size given its polygenic nature in sheep.
Supporting information
Table S1 List of associated (Bonferroni P‐value <0.05) regions for PC1: regions and genes within a 1 Mb window of the associated SNPs
Table S2 A list of associated (Bonferroni P‐value <0.05) regions for withers height and genes within a 1 Mb window of the associated SNP
Appendix S1. Brief description of the 29 linear body measures collected on each ewe
Acknowledgements
We thank the various shepherds who allowed us to sample and collect data on their ewes.
Data availability statement
Genotype and phenotype files have been deposited in Open Science Framework (https://osf.io/7qfnu/?view_only=5a013189c5d3490a8841f11deff83dcf).
References
- Al‐Mamun H.A., Kwan P., Clark S.A., Ferdosi M.H., Tellam R. & Gondro C. (2015) Genome‐wide association study of body weight in Australian Merino sheep reveals an orthologous region on OAR6 to human and bovine genomic regions affecting height and weight. Genetics Selection Evolution 47, 66. [DOI] [PMC free article] [PubMed] [Google Scholar]
- Bolormaa S., Hayes B.J., van der Werf J.H.J., Pethick D., Goddard M.E. & Daetwyler H.D. (2016) Detailed phenotyping identifies genes with pleiotropic effects on body composition. BMC Genomics 17, 224. [DOI] [PMC free article] [PubMed] [Google Scholar]
- Borg R.C., Notter D.R. & Kott R.W. (2009) Phenotypic and genetic associations between lamb growth traits and adult ewe body weights in western range sheep. Journal of Animal Science 87, 3506–14. [DOI] [PubMed] [Google Scholar]
- Bouwman A.C., Daetwyler H.D., Chamberlain A.J. et al (2018) Meta‐analysis of genome‐wide association studies for cattle stature identifies common genes that regulate body size in mammals. Nature Genetics 50, 362–7. [DOI] [PubMed] [Google Scholar]
- Boyko A.R., Quignon P., Li L. et al (2010) A Simple Genetic Architecture Underlies Morphological Variation in Dogs. PLOS Biology 8, e1000451. [DOI] [PMC free article] [PubMed] [Google Scholar]
- Brooks S.A., Makvandi‐Nejad S., Chu E., Allen J.J., Streeter C., Gu E., McCleery B., Murphy B.A., Bellone R. & Sutter N.B. (2010) Morphological variation in the horse: defining complex traits of body size and shape. Animal Genetics 41 (Suppl 2), 159–65. [DOI] [PubMed] [Google Scholar]
- Ceyhan A., Moore K. & Mrode R. (2015) The estimation of (co)variance components growth, reproduction, carcass, FECS and FECN traits in Lleyn sheep. Small Ruminant Research 131, 29–34. [Google Scholar]
- Chase K., Carrier D.R., Adler F.R., Jarvik T., Ostrander E.A., Lorentzen T.D. & Lark K.G. (2002) Genetic basis for systems of skeletal quantitative traits: principal component analysis of the canid skeleton. Proceedings of the National Academy of Sciences of the United States of America 99, 9930–5. [DOI] [PMC free article] [PubMed] [Google Scholar]
- Chen C., Liu C., Xiong X., Fang S., Yang H., Zhang Z., Ren J., Guo Y. & Huang L. (2018) Copy number variation in the MSRB3 gene enlarges porcine ear size through a mechanism involving miR‐584‐5p. Genetics Selection Evolution 50, 72. [DOI] [PMC free article] [PubMed] [Google Scholar]
- Dhuyvetter J. (1995) Beef cattle frame scores In: Extension Bulletin AS‐1091. North Dakota State Univ., Fargo, ND. [Google Scholar]
- Eckstein F., Pavicic T., Nedbal S., Schmidt C., Wehr U., Rambeck W., Wolf E. & Hoeflich A. (2002) Insulin‐like growth factor‐binding protein‐2 (IGFBP‐2) overexpression negatively regulates bone size and mass, but not density, in the absence and presence of growth hormone/IGF‐I excess in transgenic mice. Anatomy and Embryology 206, 139–48. [DOI] [PubMed] [Google Scholar]
- Gao L., Xu S.‐S., Yang J.‐Q., Shen M. & Li M.‐H. (2018) Genome‐wide association study reveals novel genes for the ear size in sheep (Ovis aries). Animal Genetics 49, 345–8. [DOI] [PubMed] [Google Scholar]
- Herd R., Oddy V. & Lee G. (1993) Effect of divergent selection for weaning weight on liveweight and wool growth responses to feed intake in Merino ewes. Australian Journal of Experimental Agriculture 33, 699–705. [Google Scholar]
- Janssens S. & Vandepitte W. (2004) Genetic parameters for body measurements and linear type traits in Belgian Bleu du Maine, Suffolk and Texel sheep. Small Ruminant Research 54, 13–24. [Google Scholar]
- Kang H.M., Sul J.H., Service S.K., Zaitlen N.A., Kong S., Freimer N.B., Sabatti C. & Eskin E. (2010) Variance component model to account for sample structure in genome‐wide association studies. Nature Genetics 42, 348–54. [DOI] [PMC free article] [PubMed] [Google Scholar]
- Kelley K.M., Oh Y., Gargosky S.E., Gucev Z., Matsumoto T., Hwa V., Ng L., Simpson D.M. & Rosenfeld R.G. (1996) Insulin‐like growth factor‐binding proteins (IGFBPs) and their regulatory dynamics. The International Journal of Biochemistry & Cell Biology 28, 619–37. [DOI] [PubMed] [Google Scholar]
- Kijas J.W., Lenstra J.A., Hayes B. et al (2012) Genome‐wide analysis of the world's sheep breeds reveals high levels of historic mixture and strong recent selection. PLoS Biology 10, e1001258. [DOI] [PMC free article] [PubMed] [Google Scholar]
- Kominakis A., Hager‐Theodorides A.L., Zoidis E., Saridaki A., Antonakos G. & Tsiamis G. (2017) Combined GWAS and ‘guilt by association’‐based prioritization analysis identifies functional candidate genes for body size in sheep. Genetics Selection Evolution 49, 41. [DOI] [PMC free article] [PubMed] [Google Scholar]
- Makvandi‐Nejad S., Hoffman G.E., Allen J.J. et al (2012) Four loci explain 83% of size variation in the horse. PLoS One 7, e39929. [DOI] [PMC free article] [PubMed] [Google Scholar]
- Mavrogenis A.P. & Constantinou A. (1990) Relationships between pre‐weaning growth, post‐weaning growth and mature body size in Chios sheep. Animal Science 50, 271–5. [Google Scholar]
- Mavule B.S., Muchenje V., Bezuidenhout C.C. & Kunene N.W. (2013) Morphological structure of Zulu sheep based on principal component analysis of body measurements. Small Ruminant Research 111, 23–30. [Google Scholar]
- Nemutandani K.R., Snyman M.A., Olivier W.J. & Visser C. (2018) Estimation of genetic parameters and comparison of breeding values for body weight with different models in a South African Merino stud. Small Ruminant Research 169, 34–41. [Google Scholar]
- Paris J.M., Letko A., Häfliger I.M., Ammann P. & Drögemüller C. (2020) Ear type in sheep is associated with the MSRB3 locus. Animal Genetics. 10.1111/age.12994 [DOI] [PubMed] [Google Scholar]
- Pearson J.C., Lemons D. & McGinnis W. (2005) Modulating Hox gene functions during animal body patterning. Nature Reviews Genetics 6, 893–904. [DOI] [PubMed] [Google Scholar]
- Posbergh C.J., Thonney M.L. & Huson H.J. (2019) Genomic approaches identify novel gene associations with out of season lambing in sheep. Journal of Heredity 110, 577–86. [DOI] [PubMed] [Google Scholar]
- Pryce J.E., Hayes B.J., Bolormaa S. & Goddard M.E. (2011) Polymorphic regions affecting human height also control stature in cattle. Genetics 187, 981–4. [DOI] [PMC free article] [PubMed] [Google Scholar]
- R Core Team (2018) R: A Language and Environment for Statistical Computing. R Foundation for Statistical Computing, Vienna. [Google Scholar]
- Safari E., Fogarty N.M., Gilmour A.R., Atkins K.D., Mortimer S.I., Swan A.A., Brien F.D., Greeff J.C. & Van Der Werf J.H.J. (2007) Genetic correlations among and between wool, growth and reproduction traits in Merino sheep. Journal of Animal Breeding and Genetics 124, 65–72. [DOI] [PubMed] [Google Scholar]
- Sutter N.B., Bustamante C.D., Chase K. et al (2007) A single IGF1 allele is a major determinant of small size in dogs. Science 316, 112–5. [DOI] [PMC free article] [PubMed] [Google Scholar]
- Taylor S.C.S. (1980) Genetically standardized growth equations. Anim Prod 30, 167–75. [Google Scholar]
- Vaysse A., Ratnakumar A., Derrien T. et al (2011) Identification of genomic regions associated with phenotypic variation between dog breeds using selection mapping. PLoS Genetics 7, e1002316. [DOI] [PMC free article] [PubMed] [Google Scholar]
- Webster M.T., Kamgari N., Perloski M., Hoeppner M.P., Axelsson E., Hedhammar Å., Pielberg G. & Lindblad‐Toh K. (2015) Linked genetic variants on chromosome 10 control ear morphology and body mass among dog breeds. BMC Genomics 16, 474. [DOI] [PMC free article] [PubMed] [Google Scholar]
- Wood A.R., Esko T., Yang J. et al (2014) Defining the role of common variation in the genomic and biological architecture of adult human height. Nature Genetics 46, 1173. [DOI] [PMC free article] [PubMed] [Google Scholar]
- Yurchenko A.A., Deniskova T.E., Yudin N.S. et al (2019) High‐density genotyping reveals signatures of selection related to acclimation and economically important traits in 15 local sheep breeds from Russia. BMC Genomics 20, 294. [DOI] [PMC free article] [PubMed] [Google Scholar]
- Zhang T., Gao H., Sahana G. et al (2019) Genome‐wide association studies revealed candidate genes for tail fat deposition and body size in the Hulun Buir sheep. Journal of Animal Breeding and Genetics 136, 362–70. [DOI] [PubMed] [Google Scholar]
- Zhang Y., Liang J., Zhang L. et al (2015) Porcine methionine sulfoxide reductase B3: molecular cloning, tissue‐specific expression profiles, and polymorphisms associated with ear size in Sus scrofa . Journal of Animal Science and Biotechnology 6, 60. [DOI] [PMC free article] [PubMed] [Google Scholar]
Associated Data
This section collects any data citations, data availability statements, or supplementary materials included in this article.
Supplementary Materials
Table S1 List of associated (Bonferroni P‐value <0.05) regions for PC1: regions and genes within a 1 Mb window of the associated SNPs
Table S2 A list of associated (Bonferroni P‐value <0.05) regions for withers height and genes within a 1 Mb window of the associated SNP
Appendix S1. Brief description of the 29 linear body measures collected on each ewe
Data Availability Statement
Genotype and phenotype files have been deposited in Open Science Framework (https://osf.io/7qfnu/?view_only=5a013189c5d3490a8841f11deff83dcf).