Abstract
Purpose
A new sequence combining chemical‐exchange saturation‐transfer (CEST) with traditional MRS is used to simultaneously determine metabolite content and effects of magnetization exchange.
Methods
A CEST saturation block consisting of a train of RF‐pulses is placed before a metabolite‐cycled semi‐LASER single‐voxel spectroscopy sequence. The saturation parameters are adjustable to allow optimization of the saturation for a specific target. Data were collected in brain from 20 subjects in experiments with different B1‐settings (0.4‐2.0 µT) on a 3T MR scanner. CEST Z‐spectra were calculated from water intensities and fitted with a multi‐pool Lorentzian model. Interrelated metabolite spectra were fitted in fitting tool for arrays of interrelated datasets (FiTAID).
Results
Evaluation of traditional Z‐spectra from water revealed exchange effects from amides, amines, and hydroxyls as well as an upfield nuclear Overhauser effect. The magnetization transfer effect was evaluated on metabolites and macromolecules for the whole spectral range and for the different B1 levels. A correction scheme for direct saturation on metabolites is proposed. Both magnetization‐transfer and direct saturation proved to differ for individual metabolites.
Conclusion
Using non‐water‐suppressed spectroscopy offers time‐saving simultaneous recording of the traditional CEST Z‐spectrum from water and the metabolite spectrum under frequency‐selective saturation. In addition, exchange and magnetization‐transfer effects on metabolites and macromolecules can be detected, which might offer additional possibilities for quantification or give further insight into the composition of the traditional CEST Z‐spectrum. Apparent magnetization‐transfer effects on macromolecular signals in the 1H‐MR spectrum have been found. Detailed knowledge of magnetization‐transfer effects is also relevant for judging the influence of water‐suppression on the quantification of metabolite signals.
Keywords: chemical exchange, macromolecules, magnetization transfer, metabolites, modeling, saturation
1. INTRODUCTION
Chemical exchange saturation transfer (CEST) is by now an established method in MRI to investigate metabolites that show magnetization exchange with water. Sequences and saturation schemes have been optimized for specifically targeted metabolites and different ways to quantify the Z‐spectrum (i.e., the record of the frequency‐dependence of the saturation effect) have been proposed. The large number of recent reviews and research reports on novel techniques 1 , 2 , 3 , 4 , 5 , 6 proves the high interest in the MR community but also its complexity.
Although CEST MRI offers a drastically improved sensitivity compared to traditional MRS, it also suffers from limited specificity because of spectral overlap and multiple causes for variations in exchange rates. A simultaneous look at the results from both techniques might help for the interpretation of exchange and saturation transfer (ST) effects. In addition, because both methods are time‐consuming, simultaneous performance would be beneficial in clinical use.
Furthermore for quantitative evaluations of metabolite spectra, it is of importance to know potential ST effects from water on individual metabolite resonances and possibly also the macromolecular (MM) signals when using water pre‐saturation techniques. Moreover, comprehensive evaluation of effects from frequency‐selective saturation allows exploring whether there is any intramolecular magnetization transfer or nuclear Overhauser effect (NOE) for macromolecules or even small metabolites.
The idea of combining CEST MRI with traditional MRS is not entirely new. In 2011, Walker‐Samuel et al presented the acquisition and post‐processing technique exchange‐modulated point‐resolved spectroscopy (EXPRESS), which is a PRESS sequence for extra‐cranial use and allows for separation of Z‐spectra from fat and water signals. 7 Specific ST effects from water onto metabolites and traditional magnetization transfer (MT) effects caused by off‐resonance irradiation on MRS‐invisible semisolid macromolecule resonances have been studied before in human and animal brain and muscle. 8 , 9 , 10 , 11 , 12 CEST MRS has also been used for evaluation of NOEs. 13 In 2013, Jones et al made a first approach to relate the structure of the mobile MM spectrum to the shape of the upfield NOE part of the CEST spectrum, using Lorentzian difference analysis 14 and with outcomes reminiscent of the water exchange–filter results of van Zijl et al 15 in cells and animal brain. However, the acquisition of the complete metabolite spectrum in combination with CEST saturation over the whole spectral range has not previously been reported. One limiting factor is the long acquisition time to reach a sufficient SNR for metabolite spectra. One possibility to address this is to use a large, optimized voxel size, 16 as high quality spectra with good SNR can then be acquired from a small number of averages.
Furthermore, the use of metabolite‐cycling 17 , 18 offers the possibility to record the metabolite spectrum without water presaturation with its potential for ST effects and it allows for simultaneous acquisition of water and metabolite signals. Hence, not only can metabolite signals be observed under frequency‐selective saturation, but the Z‐spectrum for water can be recorded for the same voxel at the same time. In addition, recording the full water spectrum for each data point in the Z‐spectrum and each acquisition also allows for evaluation and correction of potential frequency shifts during the experiment, which otherwise impact resolution and accuracy of the Z‐spectrum. Interestingly, recently, there has been an interest in combined acquisition of MRS and CEST to evaluate whether it is possible to obtain the information from both modalities by acquisition of only one of them using transfer learning 19 , 20 and in the context of phosphocreatine imaging to evaluate whether 1H CEST can substitute for 31P MRS. 21
In this study, a semiLASER‐based CEST‐MRS sequence with metabolite‐cycling is proposed that offers the possibility of combining the two methods to record complementary information in a time‐saving manner. Furthermore, exchange and ST effects on metabolite and MM signals are evaluated in vivo for human brain under various saturation conditions.
2. METHODS
2.1. Sequence design
The basic design of the sequence is shown in Figure 1. A CEST saturation block is placed before a metabolite‐cycled semi‐LASER spectroscopy localization sequence. Details about the implementation, the sequence parameters, and the calculation of the average saturation strength B1 are given in Supporting Information Text S1.
FIGURE 1.
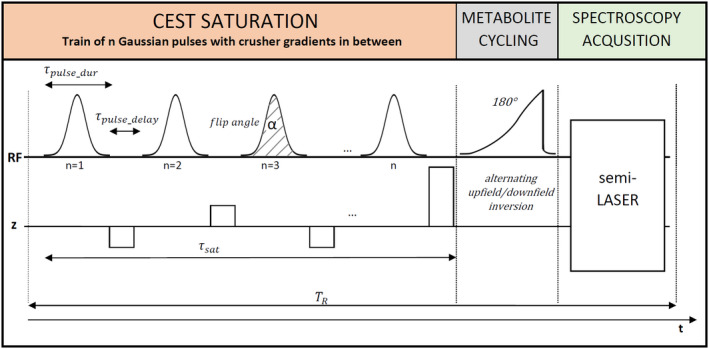
Design of the sequence combining CEST saturation with a spectroscopy acquisition based on metabolite cycling that allows for simultaneous acquisition of metabolite and water CEST effects. The CEST saturation block is designed as a train of Gaussian pulses with multiple adjustable parameters. It is followed by the metabolite cycling inversion pulse and a semi‐LASER localization sequence
2.2. Data acquisition
All data were acquired on a 3T MR scanner (Prisma, Siemens, Erlangen, Germany) using a 64‐channel head coil, with the manufacturer’s second order shimming routine (option “brain”); supraventricular voxel with a large size of 45 × 70 × 20 mm3 with an expected small preponderance of white matter; TR 3300 ms; TE 45 ms; spectral width 4000 Hz; 4096 sampling points; 41 measurements with saturation from −6 to +6 ppm (0.3 ppm spacing plus 1 scan with offset at −100 ppm for M0); 1 additional reference scan with 64 averages without CEST pulses.
In the first setting, 10 healthy subjects (37 ± 16 years of age) were scanned with the following conditions: 24 averages per frequency offset, 2000 ms saturation, duty cycle 80%, 50 pulses (Gaussian shape, time‐bandwidth product 0.9, pulse duration 32 ms, pulse delay 8 ms), flip angle 180° (B1 = 0.4 µT), alternating spoilers with 5 mT/m, last spoiler 15 mT/m, 8 ms duration. In a second setting, 10 additional subjects (30 ± 10 years of age) were scanned with 2 other B1 values (0.9 µT and 2.0 µT; only 12 averages per offset). Total acquisition time in both setups was 60 minutes. All examinations were conducted with the approval of the local Institutional Review Board.
2.3. Data processing and evaluation
Metabolite‐cycled data were processed in MATLAB (The MathWorks, Natick, MA, R2015b), including frequency‐and phase‐alignment (shot‐by‐shot) and eddy‐current correction. Residual water was removed using Hankel–Lanczos singular‐value‐decomposition filtering. The standard labeling of the frequency axis differs for CEST (water at 0 ppm) and spectroscopy (water at 4.7 ppm). Both notations are used. For displays of the downfield data, its FID was zeroed after 64 ms.
2.3.1. Fitting of MR spectra
The interrelated metabolite spectra were fitted in the fitting tool for arrays of interrelated datasets (FiTAID) 22 in analogy to earlier use (for details see Supporting Information Text S2).
2.3.2. Visualization of direct saturation effects on metabolite spectra
Visual comparison of the M0 spectrum with spectra obtained with CEST‐saturation directly illustrates ST effects on metabolite resonances when peak amplitudes are compared, or difference spectra are computed. However, straightforward interpretation is hampered by effects of direct saturation. To ease visual comparison of spectra, we chose to construct a virtual reference spectrum from the M0 spectrum that includes the approximated expected effect of direct saturation for the specific saturation offset under consideration. Details about the correction method are given in Supporting Information Text S3 and the Supporting Information Figure S1.
2.3.3. Fitting of Z‐spectra in CEST evaluations of water
Water signal intensities from the localized metabolite‐cycled spectra are evaluated versus frequency offset instead of ROI‐averaged signal intensities from images as in standard CEST MRI. An additive multi‐pool model was used to evaluate the effects of multiple components on the Z‐spectrum of water. Details on the calculation and fitting of the Z‐spectra are provided in Supporting Information Text S4.
3. RESULTS
3.1. Water and metabolite signal
Figure 2A shows the 2D spectra for water and metabolites from the metabolite‐cycled measurement for a representative subject. It illustrates the major effects of the saturation pulses. The water signal shows how the Z‐spectrum is acquired. For the metabolite spectra only the direct saturation is apparent. The non‐saturated reference scan (Figure 2B) did not show any obvious differences compared to the M0 scan recorded with saturation at −100 ppm. This indicates that the spectral quality of the M0 spectrum is sufficient as unsaturated reference spectrum even for high B1 and only 12 averages (Figure 2B). This is different for the water signal intensity, which was lower in M0 than in the reference scan by 2.6%, 5.4%, and 15.4% at the 3 B1 values, respectively. On closer inspection, the creatine methyl peak also shows slightly lower intensity in M0, although only at the higher B1 values. Inspecting the water resonance frequency in single shots, it was found to drift from start to end by 0.06 ± 0.04 ppm on average.
FIGURE 2.
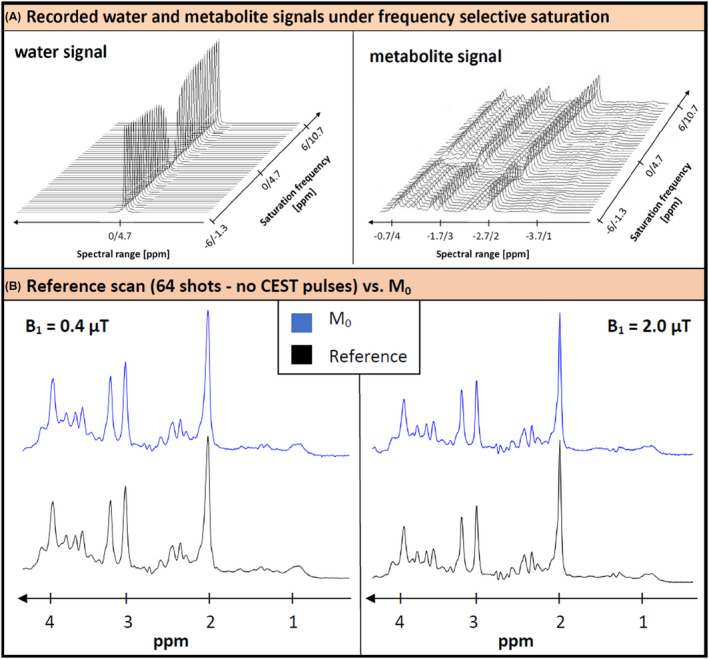
Illustration of experimental data. (A) Impact of the frequency‐selective CEST saturation on the water and metabolite signal, recorded from the metabolite‐cycled semi‐LASER sequence, shown for a representative subject. The water signal intensity drops significantly for saturation close to its resonance frequency. For the metabolite spectra, the loss in signal intensity is also visible for the corresponding saturation frequencies. The ppm values are given in CEST reference (water at 0 ppm) and spectroscopy reference (water at 4.7 ppm). (B) Comparison of the reference scan without CEST pulses (64 averages) with the M0 scan at the smallest and highest B1 for a representative subject. They document sufficient spectral quality for all spectra and validity of M0 as the unsaturated spectrum even for high B1
3.2. Z‐Spectra for water
Figure 3 shows the standard Z‐spectrum of water for all 3 B1 values from a representative subject and includes the model fit for the Lorentzian pools. The contribution for each pool n is plotted as (Zbase − Ln). The direct water saturation, broad MT effect, and signal reduction Zbase factor define the gross features of the Z‐spectrum. On the right, a blow‐up is shown to zoom into the contributions of the smaller contributors. The fitting results for all pools, averaged over subjects, are given numerically in Table 1 for each B1 saturation amplitude. For the highest B1, the signal is reduced to below 70% for the whole sampled frequency range. As expected, direct saturation broadens with B1 strength. The NOE effect as well as the exchange effects for hydroxyls and amines increase with B1, whereas the exchange effect for amides remains fairly constant in amplitude but moves in frequency with increasing irradiation amplitude.
FIGURE 3.
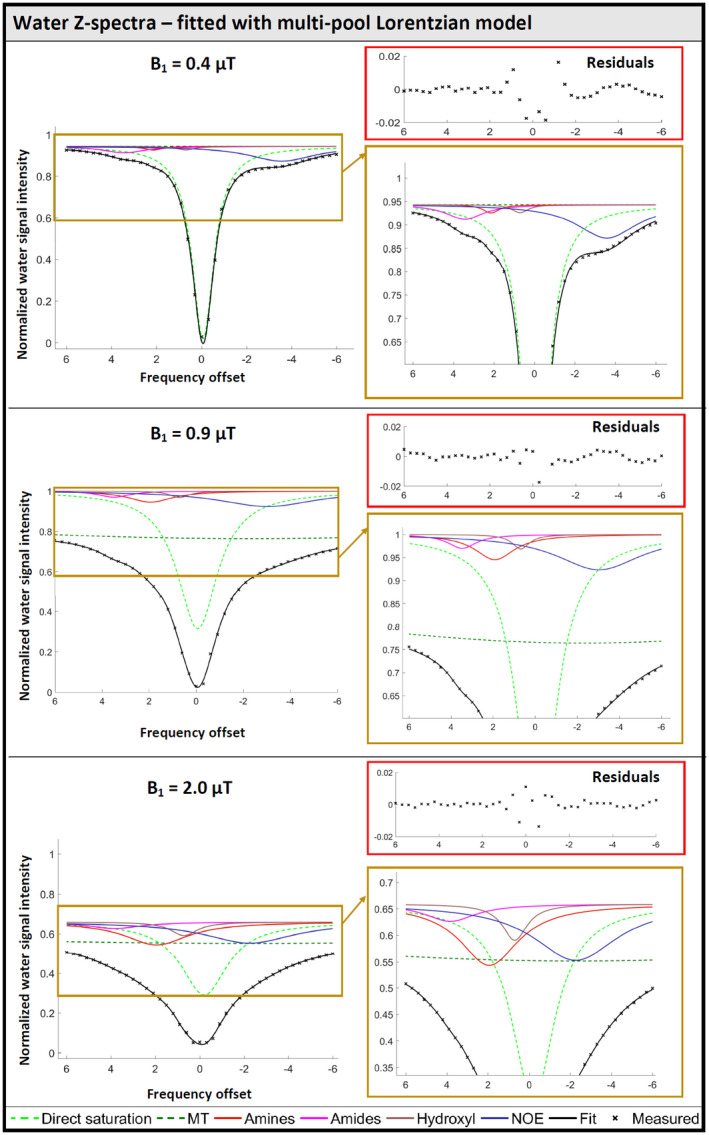
Representative fit of a water Z‐spectrum with the multiple pool Lorentzian model for each B1. Saturation offset is given in CEST convention with water at 0 ppm. The direct water saturation, the broad MT and the overall signal reduction define the main shape of the Z‐spectrum. All components are displayed as Zbase − Ln. On the right, the scale is enlarged to show more details for the smaller contributors from the exchange effects downfield and the NOE effect upfield. The exchange effects of hydroxyls and amines increase with B1, whereas the exchange effect of amides remains fairly constant
TABLE 1.
Fitting results for the water Z‐spectra averaged for all subjects and presented for all 3 B1 values
| Water Z‐spectra multi‐pool fitting results | B1 = 0.4 µT | B1 = 0.9 µT | B1 = 2.0 µT |
|---|---|---|---|
| Amplitude | |||
| Direct saturation | 0.93 ± 0.006 | 0.69 ± 0.018 | 0.38 ± 0.022 |
| MT effect | 0.00 ± 0.000 | 0.24 ± 0.015 | 0.14 ± 0.052 |
| Amines | 0.02 ± 0.003 | 0.05 ± 0.011 | 0.11 ± 0.014 |
| Amides | 0.03 ± 0.003 | 0.04 ± 0.012 | 0.04 ± 0.010 |
| Hydroxyl | 0.01 ± 0.010 | 0.03 ± 0.017 | 0.08 ± 0.015 |
| NOE | 0.06 ± 0.006 | 0.08 ± 0.004 | 0.10 ± 0.004 |
| Zbase | 0.94 ± 0.010 | 1.00 ± 0.007 | 0.69 ± 0.045 |
| MT + (1 − Zbase) | 0.06 | 0.24 | 0.45 |
| FWHM [ppm] | |||
| Direct saturation | 1.15 ± 0.056 | 2.07 ± 0.138 | 2.54 ± 0.118 |
| MT effect | 55.00 ± 0.000 | 55.00 ± 0.000 | 55.00 ± 0.000 |
| Amines | 1.07 ± 0.196 | 1.98 ± 0.374 | 3.08 ± 0.472 |
| Amides | 2.36 ± 0.366 | 2.06 ± 0.413 | 3.00 ± 0.000 |
| Hydroxyl | 1.39 ± 0.638 | 1.66 ± 0.973 | 1.27 ± 0.226 |
| NOE | 3.22 ± 0.242 | 5.00 ± 0.000 | 4.97 ± 0.065 |
| Offset from water [ppm] | |||
| Direct saturation | −0.07 ± 0.032 | −0.04 ± 0.037 | −0.20 ± 0.000 |
| MT effect | −2.30 ± 0.000 | −2.30 ± 0.000 | −2.30 ± 0.000 |
| Amines | 2.23 ± 0.095 | 1.90 ± 0.195 | 1.98 ± 0.054 |
| Amides | 3.53 ± 0.178 | 3.40 ± 0.218 | 3.81 ± 0.155 |
| Hydroxyl | 0.75 ± 0.088 | 0.74 ± 0.070 | 0.70 ± 0.015 |
| NOE | −3.52 ± 0.070 | −2.96 ± 0.158 | −2.31 ± 0.069 |
Fitting results approaching the predefined fit range boundaries are displayed in grey, fixed values in red. Lorentzian amplitudes: 0 means no effect, 1 full saturation. The amplitude of the NOE effect increases with B1, as well as the amplitude of the exchange effects from hydroxyl and amines. The exchange effect of amides remains fairly constant. For the highest B1, strong overall reduction of the signal was detected. The FWHM of the direct water saturation increases from 1.2 to 2.5 ppm. The MT effect should be judged in combination with Zbase (as shown in the lowest row of amplitude values).
3.3. ST effects on the metabolite spectrum
The ST effect from water to metabolites is illustrated in Figure 4 for both the cohort average and a single subject for the 3 B1 values. The M0‐spectrum is plotted together with the spectrum recorded with saturation at the water resonance and a difference spectrum (in red), which very clearly visualizes that the extent of the ST varies for different metabolites. While the Crtot (creatine [Cr] + phosphocreatine [PCr]) peaks show clear signal decreases for all 3 saturation cases at the water resonance (positive signals in the difference spectrum), the Chotot methyl singlet has unchanged intensity for the lower 2 irradiation amplitudes and only shows an effect at the strongest saturation power. However, the signal drops are partially caused by direct saturation, in particular for peaks close to water and higher B1 amplitudes. For B1 = 2 µT, a difference can be seen over the full range, indicating that direct saturation at such strong B1 affects the whole spectrum.
FIGURE 4.
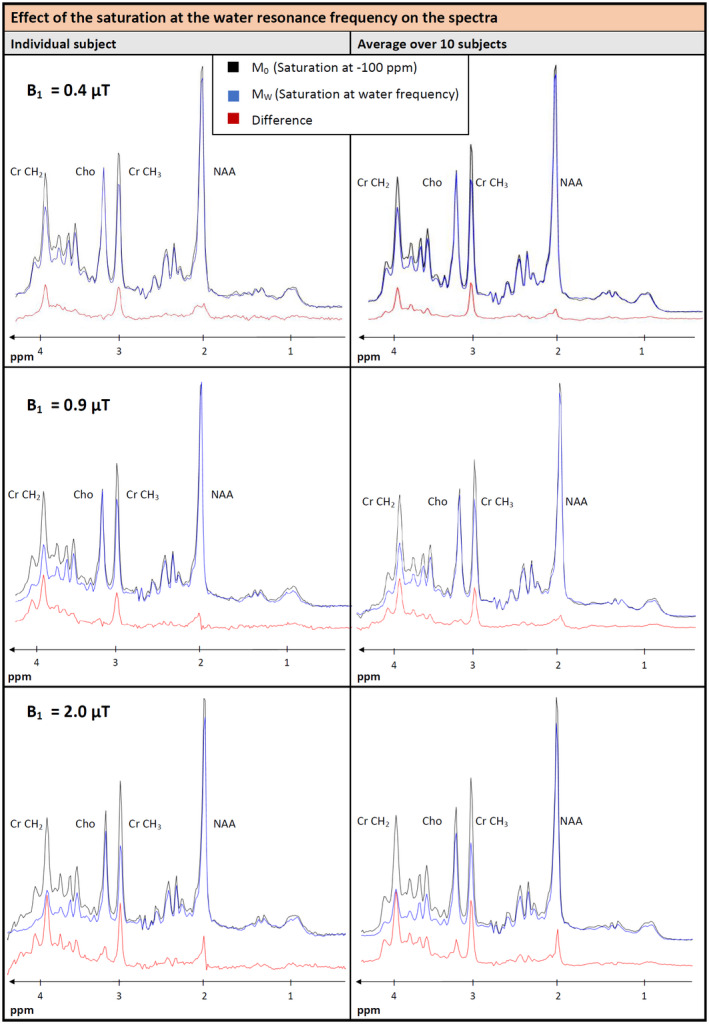
Comparison of the metabolite spectra for the M0 case and for saturation at the water frequency for a representative individual subject (left) and the average of all 10 subjects (right) for all 3 B1 strengths (difference displayed in red). Signal reduction is clearly visible for several metabolites such as Cr and NAA. A small decrease can also be suspected for Lactate, whereas for total Cho almost no changes appear. The MM background shows small variations in the least overlapped area between 0.7 and 1.8 ppm. Signal drops in the frequency range close to the water resonance at lower B1 may be caused by direct saturation. For the highest B1, direct saturation effects are visible in whole frequency range. To judge CEST effects without direct saturation contributions, see Figures 5 and 6
For a closer visual inspection of the ST effect without interference of direct saturation, Figures 5 and 6 were constructed where the measured data are juxtaposed with calculated spectra that reflect the effects of pure direct metabolite signal saturation when irradiating at the water resonance or another specific saturation frequency (for details, see the Supporting Information Text S3 and Supporting Information Figure S1.) Because direct saturation effects depend on the relaxation properties of the target resonance, 2 adapted cases were constructed; 1 in Figure 5 to visualize effects for metabolites with average relaxation properties like those of the NAA and Chotot singlets (Figure 5), the other in Figure 6 for the Crtot resonances. The 2 cases were picked based on the evaluation of direct saturation and subsequent interpretation in terms of the T1/T2 ratio that were found to be considerably larger for Crtot CH3 (ratio of 8.3) than NAA (5.1) or Chotot (3.8). From Figure 5 it becomes clear that there is very little ST from water to the NAA and Choline singlets. Only small effects are seen for low B1, (possibly a small ST effect for a component underlying the NAA singlet) and possibly some ST for NAA and lactate at high B1. Similarly, for off‐water irradiation no substantial amplitude changes are detected. Quite in contrast, when using correction factors from the Cr‐CH3 singlet (Figure 6), very prominent ST is evident for the Cr‐CH3 singlet for saturation at the water frequency even at the smallest B1. Interestingly, this ST effect, which is not getting much stronger for higher B1, is also present when irradiating off‐resonance from water and, as discussed above, is even discernible for irradiation at −100 ppm. The Cr‐CH2 peak, on the other hand, does not show any ST from water and its apparent ST signal in Figure 4 is fully explained by direct saturation. For both figures, there are some negative difference peaks for several metabolites, mostly at high B1 and probably caused by ill‐adapted over‐correction for direct saturation.
FIGURE 5.
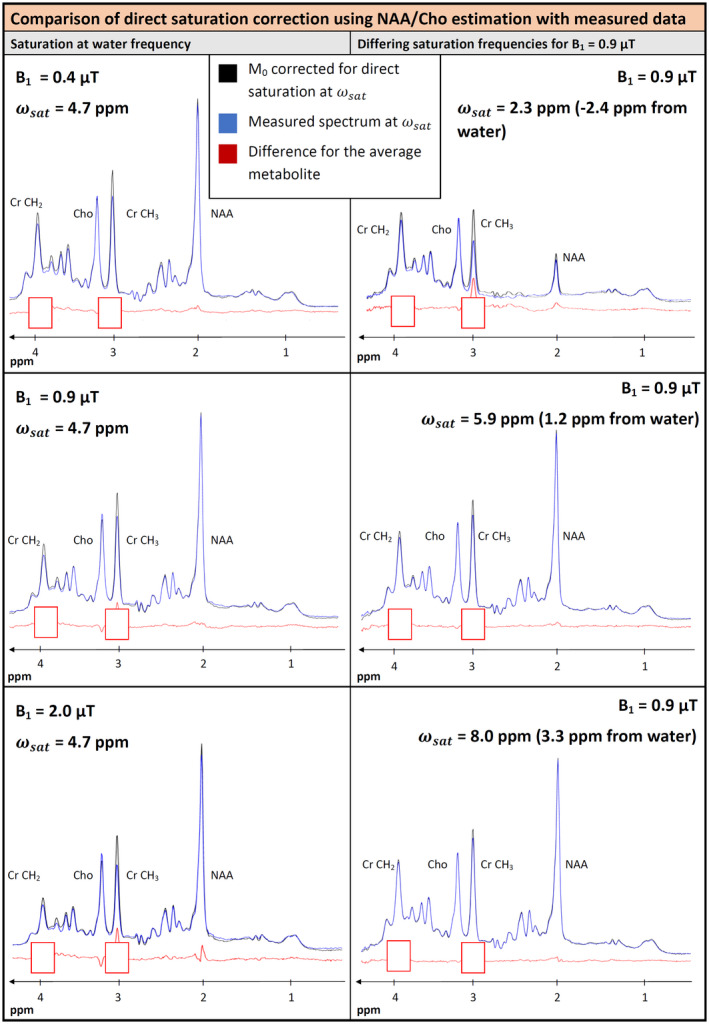
Comparison of the measured cohort‐average spectra with M0 spectra corrected for direct saturation at different B1 values and saturation at the water frequency (left) and for a B1 of 0.9 µT and different saturation frequencies (right). Direct saturation correction in this graph is based on values from NAA and Cho. For saturation at the water frequency, only very small effects are seen. With increasing B1, a difference signal below the NAA singlet and possibly a signal for Glu arises. For the Cho singlet a negative difference appears as consequence of over‐correction of the direct saturation. For saturation at 2.3 ppm, an additional difference appears in the region of the NAA pattern. The spectral features of Cr are blanked because they are ill‐corrected with the NAA and Cho parameters
FIGURE 6.
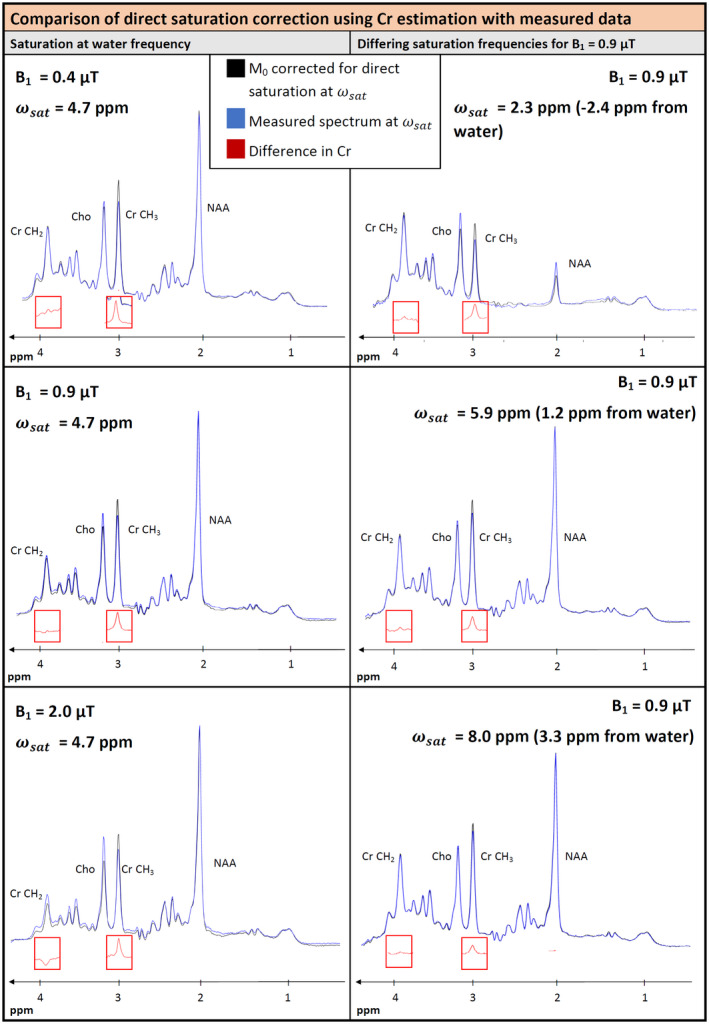
Comparison of the measured cohort‐average spectra with M0 spectra corrected for direct saturation at different B1 values and saturation at the water frequency (left) and for a B1 of 0.9 µT and different saturation frequencies (right). Direct saturation correction in this graph is based on values from Cr CH3. For saturation at the water frequency, the most prominent difference appears at the Cr CH3 component. The Cr CH2 peak does not show any difference. The prominent difference in Cr CH3 decreases only a little when irradiating away from the water resonance. Only spectral features of Cr are drawn for the difference spectra because this plot only targets the Crtot peaks
Figure 7 shows the ST effects for the downfield part of the spectrum in the cohort average. In the upper part, irradiation with B1 = 0.9 µT at the water resonance is contrasted with irradiation at specific other frequencies in the upfield range with the result that some ST is seen for almost the whole downfield range, and that some of the effects are not specific to saturation of water magnetization. Most prominent are the effects at ~8.2 ppm (irrespective of saturation frequency) and 8.5 ppm (most explicit for water saturation). The lower part of the figure summarizes the off‐water‐irradiation results and contrasts them to on‐water‐resonance saturation at all B1 amplitudes. The transfer effects for water saturation are similar for all B1 amplitudes, whereas the summed upfield irradiation effects decrease substantially with lower B1 amplitude.
FIGURE 7.
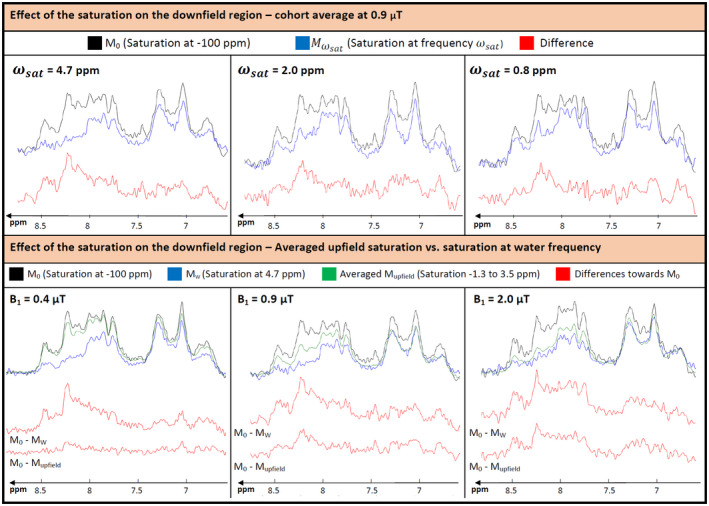
Comparison of the downfield region for the M0 case and for saturation at different frequencies for the cohort average, with differences displayed in red (truncated to 256 ms and zero‐filled for display; saturation offset and ppm axis referencing water at 4.7 ppm). Top: for a B1 of 0.9 µT, red, 2 prominent peaks arise in the difference, which can potentially be assigned to ATP at 8.2 and 8.5 ppm. Those peaks decrease for further upfield irradiation. Bottom: comparison of the difference of the averaged upfield saturation effect and the saturation at water frequency with M0. For the smallest B1, there is almost no difference between M0 and the averaged upfield saturation spectrum. With increasing B1, the signal with averaged upfield saturation decreases and hence the difference vs. M0 increases. For the highest B1, almost no difference between averaged upfield saturation and saturation at the water frequency can be seen
3.4. Z‐spectra for selected metabolites and MM
Figure 8 shows fitted signal intensities for a selection of metabolites as function of saturation frequency, i.e., Z‐spectra for metabolites rather than traditional Z‐spectra for water. An illustration of FiTAID fits for metabolite spectra with irradiation at specific frequencies that are the basis for the metabolite Z‐spectra can be found in the Supporting Information Figure S2 in the (representative single case and cohort‐average spectra). Besides the signal drop due to direct saturation, an additional effect is visible in Figure 8 for some metabolites around the water frequency; it is particularly evident for Crtot (as expected from Figure 6), glutamate (Glu), glutamine (Gln), and myo‐inositol (mI). As expected from Figure 5, this effect is strikingly missing for Chotot. To clarify, whether some of the effects might be because of cross‐talk between fitted metabolite and underlying MM signal amplitudes, the summed signals found for metabolites, plus underlying MMs, were included for some cases. Indeed, such artificial fitting‐related effects were found for lactate and total NAA (NAA + N‐acetylaspartylglutamate [NAAG]), although they do not explain the full water‐related ST effect for these metabolites.
FIGURE 8.
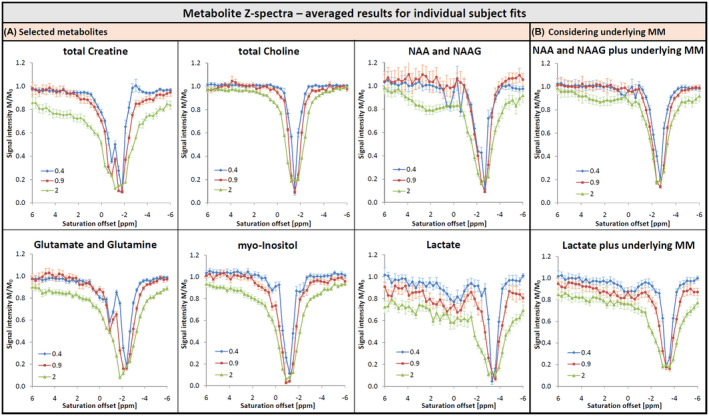
Z‐Spectra for selected metabolites, i.e., fitted intensity of metabolites as function of the saturation frequency (CEST convention, water at 0 ppm), averaged for all subjects with standard error of the mean indicated for each data point. (A) A signal drop at water frequency is visible for most metabolites; only for Chotot no decrease is detectable. (B) Total intensity of NAA plus NAAG as well as Lac plus the respective underlying MM signals. Adding the MM reduces the effects seen on A for the metabolites alone; showing that part of the detected effect is probably caused by compensation effects in the underlying MM signals because the outcomes of a fit are usually negatively correlated for strongly overlapping spectral patterns. Similarly, care should be used in interpreting values above 1 as proof for an inverse NOE, experimental outliers and inadequate fit results in single cases should be considered first
Figure 9 shows Z‐spectra for MM signals as obtained from signal intensities of the fitted Voigt lines. For ease of viewing and to summarize and stabilize the results, Z‐spectra are presented for the cohort average, and are plotted for results from 6 different frequency ranges of the MM spectrum rather than for individual Voigt lines. The Z‐spectra for the different parts of the MM spectrum mostly reflect direct saturation at the respective frequency ranges. For the best‐defined MM resonances between 0.7 and 1.1 ppm, saturation with the lowest B1 value indicates a 10% ST effect from water, however, this is not replicated for higher B1 values. For 1.5‐1.9 and 1.9‐2.7 ppm, there is an apparent ST from water for both of the lower B1 values, but not for the strongest B1, although for that case the effects are difficult to resolve. There is no clear indication for any large intramolecular ST/NOE (i.e., caused by irradiation at frequencies other than on‐resonance with water) for any of the frequency ranges.
FIGURE 9.
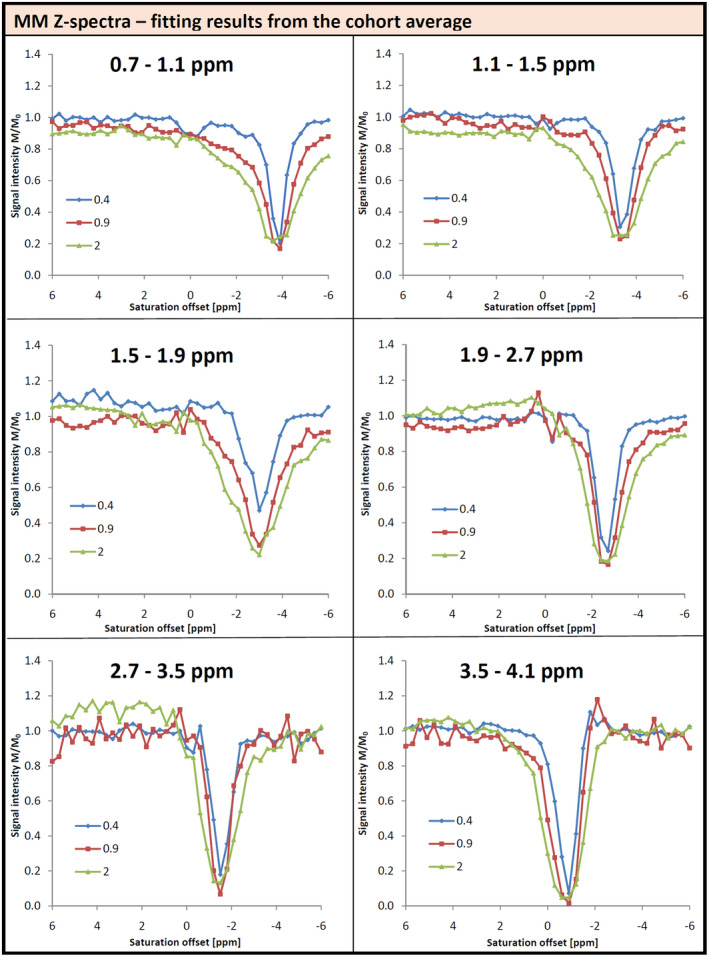
Z‐Spectra for the MM signals divided up into multiple frequency regions as function of saturation frequency (CEST convention, water at 0 ppm) for fits of the cohort average spectra. The signal drop at the water resonance in certain regions, such as 0.7‐1.1 ppm or 2.7‐3.5 ppm hints at saturation transfer between MM and water, which has not been reported so far, in terms of direct spectroscopy recordings, but the −1.6 ppm CEST peak first reported in Zhang et al 38 is right in the middle of the 2.7‐3.5 ppm region. Interferences with metabolite signals, such as for the region between 1.9 and 2.7 ppm with NAA as shown in Figure 8, have to be considered when interpreting CEST effects for MM signals
4. DISCUSSION
A new sequence has been proposed that allows for simultaneous recording of the water signal and the metabolite spectrum under frequency‐selective saturation. This approach offers the possibility to simultaneously acquire information on ST and MT effects for water, individual metabolites and also MM signals. Results were presented for 3 B1 strengths showing the potential of the newly designed sequence along with an overview of the evaluation possibilities of both, the water and metabolite Z‐spectra, as well as the full metabolite spectra.
4.1. Evaluation of the water Z‐spectrum
Z‐Spectra from the water intensity were fitted with a commonly used multi‐pool Lorentzian model. Exchange effects from amines, amides and hydroxyls were detected, varying in width and strength with B1. The interpretation of the physical basis of the fitted parameters is difficult because of the complexity of all processes contributing to the Z‐spectrum, especially at high B1. 2 Estimating the strength of the exchange effect from the amplitude of the fitted Lorentzian line yields an effect between 3‐4% for the amide pool, slightly increasing with B1. This is lower than what has been reported for 1 µT (~5‐10%), but in good agreement for 2 µT (~3‐6%). 23 Using magnetization transfer ratios (Equation 5 in Windschuh et al 24 ) to compare with literature, they were reported as ~0.2 for amides and ~0.3 for NOE at B1 = 0.7 µT, 25 which is somewhat above our findings (~0.09 for amides and ~0.2 for NOE at B1 = 0.9 µT). Turning to amines, the Lorentzian pool size for Glu has been reported (at 7 T) as 7% at high B1 for white matter and 11% for gray matter. This is in fair agreement with the 2‐11% observed in this study. 26 For the hydroxyl exchange of mI, asymmetry showed 3.5‐5.7% at high B1 at 7 T, 27 whereas total hydroxyl exchange here depended highly on B1, ranging from ~1‐8%. Comparing the dependence of the CEST effects on B1 with simulated data at 3 T shows good agreement in terms of the slight increase in amide exchange and the strong increase in amine and hydroxyl exchange for the saturation time of 2 s for lower B1s. For the highest B1 of 2 µT, a decrease in CEST effect would be expected for the hydroxyl and the amide pools. 28 The MT effect also increases with B1 as expected, although it is hard to separate from Zbase in our work. 29
The complex 6‐pool model introduces a large interdependence of fit parameters given the large overlap and limited resolution (in particular at high B1). This made it necessary to restrict the allowed parameter space, which we ported from Windschuh et al. 24 In turn, some of the fitted parameters were therefore influenced by the allowed range. For all B1 values, the estimated frequencies for the hydroxyl groups were close to the limit at 0.7 ppm. This is not surprising, given the fact that this pool has a very wide width and on top corresponds to multiple components (Glc, mI, and other sugars) that are all known to coalesce with the water peak, which leads to an asymmetric lineshape with an apparent maximum depending on the inherent resonance frequencies and pool sizes. 2 Higher fields would certainly help for the analysis for the hydroxyls. Allowing freedom to the FHWM and offset parameters for MT led to unacceptable fitting instabilities with a large impact on the results of other pools. Hence, those parameters were kept fixed for all cases. The semisolid MT effect is known to be best described by a super‐Lorentzian 30 but can be approximated as a Lorentzian component for a small frequency range as used here. However, inclusion of a Zbase parameter, which accommodates frequency‐independent effects, makes the determination of the parameters of the Lorentzian model for MT very difficult for the case of a small frequency range. Zbase and MT parameters are too much correlated; MT and Zbase should therefore be considered to represent 1 pool (this then leads to a monotonous increase of this pool amplitude for increasing B1 from 6 to 24 and 45%).
In CEST MRI, the water Z‐spectra are commonly corrected for spatial B0 inhomogeneity or possibly B0 shifts over time in long experiments by shifting the minimum of the curve to 0 ppm, in particular by water‐saturation‐shift‐referencing (WASSR). 31 With the proposed method, any frequency offset is evident from the frequency of the water peak in each acquisition. In our examinations, frequency drifts were very small (a few Hz, 1 exception with 25 Hz) such that no correction was implemented yet. However, varying frequency offsets could be incorporated in the fit of the Z‐spectrum if needed in a way that acquisitions with nominally identical offsets would not be averaged but evaluated separately using the proper offset for each acquisition.
4.2. MT and ST effects for metabolite and macromolecule signals
Comparing the metabolite spectra of the M0‐reference and those under saturation at the water resonance in Figures 4, 5, 6 clearly reveals that the extent of the water ST effect is very different for different metabolites. The strongest effect is found for the Crtot methyl resonance at 3 ppm (Cr and/or PCr). The NAA singlet at 2 ppm or possibly a smaller signal underlying this peak also shows a small ST effect, whereas the Chotot trimethyl peak at 3.2 ppm appears not to be subject to ST from water at all. Additionally, a small effect is possible for Lac. A more systematic and general evaluation is provided by the metabolite Z‐spectra (Figure 8). The observations from the comparison of spectra are confirmed in the Z‐spectra of individual metabolites. Whereas Crtot, mI, and Glu/Gln show a signal drop around the water resonance, which is more intense at higher B1, Chotot shows almost full signal for B1 = 0.4 and 0.9 µT. A signal drop is visible only for B1 = 2.0 µT, but this is at least partially caused by direct saturation. The observation of ST from water onto individual metabolites is well in line with previous studies in rat brain (de Graaf et al, 8 Dreher et al, 9 and Luo et al 32 for Lac) and also human brain. 8 , 10 , 33 In particular, the difference in effect size for different metabolites is similar to what had been reported by de Graaf et al 8 and our results are also in‐line with their interpretation of mostly water‐mediated ST because of small compartments with limited mobility, although the recent work of Yadav et al 34 provides an alternative explanation in terms of substrate binding, which is particularly attractive for creatine and phosphocreatine binding to enzymatic complexes.
The simple illustration of ST effects by juxtaposition of spectra recorded with and without the pertinent saturation block or the respective difference spectra is hindered by direct saturation that introduces trivial changes that can dominate, and their extent is not obvious a priori. To provide spectral comparisons without these disturbing effects, spectra including specific direct saturation conditions have been constructed and used in Figures 5 and 6. However, it should be kept in mind that each such spectrum is strictly valid only for specific relaxation properties of metabolites. For simplicity, this direct‐saturation correction was calculated for 2 cases, first, approximating the conditions of the NAA and Chotot singlets (Figure 5) and second, those of the Crtot methyl peak (Figure 6). Judging effects for other metabolites from these figures is of limited validity; it is better to rely on the metabolite Z‐spectra. In particular, estimation of the behavior of the MM signals is difficult, because T1 and T2 values are very different in this case.
Using Equation S4 in Supporting Information Text S3 for estimation of the T1/T2 ratio for the metabolite singlets at the lowest B1 provides values close to literature (7.6 for Crtot CH3, 5.0 for NAA and 5.2 for Chotot from Träber et al 35 compared to 8.3, 5.1, and 3.8, respectively here). For higher B1, however, where only NAA was fitted and the other 2 were estimated via the ratio to NAA, estimating the FWHM from this equation would lead to much broader FWHM than the ones observed. Hence, the relation between B1, FHWM and relaxation times that is strictly applicable only for continuous‐wave and not pulsed irradiation seems not to be accurate when it comes to higher saturation power (as verified in phantoms), but as indicated it was not used in our derivation of the spectra in Figures 5 and 6.
Figure 9 shows Z‐spectra for the MM spectrum, divided into 6 heuristically chosen parts. In McLean et al, 10 it had been reported that there is no ST effect for MM signals for human brain, whereas the water‐exchange‐filter results of van Zijl et al 15 had suggested a NOE effect for the MRS‐visible MM resonances in cells and rat brain. Although limited by SNR and therefore only evaluated for the cohort average, it still appears that in the current data there is evidence for some ST from water to the MM signals for some of the spectral ranges. The DUALCEST approach of Goerke et al 36 provides an experimental and theoretical basis for intramolecular ST within bulk mobile proteins (and through the amide group of the proteins onto water) that are expected to contribute to the MRS‐visible MM signals. 37 For the lowest B1, the 0.9 ppm region, which is free from metabolite resonances, clearly showed an ST effect (confirming the NOE nature of the ST). The region between 2.7 and 3.5 ppm shows some signal drop in the MM Z‐spectrum at the water resonance for all B1. This spectral range corresponds to the −1.6 ppm CEST effect first reported by Zhang et al 38 for ischemic rat brain and confirmed by the currently highest resolution CEST work in human brain. 39 Looking into individual subject data for the mentioned ST effects for MM signals showed that for a B1 = 0.4 µT, the prominent signal drop in the 0.7‐1.1 ppm region was observed consistently (9 of 10 subjects). The signal drop in region 2.7‐3.5 ppm was seen in all subjects, although varying in intensity with SD of 6% around 88% remaining signal intensity. The signal drop below NAA in the region 1.9‐2.7 ppm was only observed in 7 subjects, in 3 subjects the intensity even increased, indicating that in this region this could originate from a fitting problem, as already stipulated by Figure 8.
ST effects from water do certainly not come as a surprise for most resonances in the spectral downfield region because those protons are known to be subject to exchange with water. 15 , 17 , 40 Figure 7 illustrates the saturation effects in the downfield region for the cohort average as found in this work with a metabolite‐cycling sequence with rather long TE. Most striking are the 2 peaks at 8.2 and 8.5 ppm that appear for irradiation at the water frequency. Although these frequencies perfectly match the CEST‐amide pool, we do not expect that these well‐resolved peaks with a longish T2 represent the general protein pool, but rather that they arise from a specific and rather small molecule. For higher B1, they also seem to be affected by a more general ST effect (i.e., also for irradiation in the upfield range off the water resonance). They could arise from adenosine triphosphate (ATP) where we would not expect the protons to exchange with water directly but rather be affected by NOE transfer of saturation, possibly indicating that ATP has longer contact times with macromolecules. However, amide protons from glutathione have also been reported to resonate in this region and to be affected by exchange and changes in pH. 41
4.3. Limitations and perspectives
A limiting factor for the analysis of metabolite spectra is the SNR, especially for the second experimental setting with only 12 averages per saturation frequency. Although the upfield region still offers sufficient SNR with the chosen voxel size, the downfield region cannot be evaluated for individual subjects. For evaluation of the downfield region, a limited amount of frequency offsets around water might be chosen to record more averages in the same time frame.
For better evaluation of the broad general MT effect, it would have been advisable to include irradiation offsets further from water, possibly irregularly spaced out to at least 100 ppm.
It has to be considered that the voxel composition in terms of white and gray matter contributions differs between subjects leading to some variance in MT/ST effects, although in an earlier study no significant differences in magnetization transfer ratios have been found. 33
In the common fitting model, the metabolite patterns were linked in area, meaning that, for example, the NAA singlet at 2 ppm could not adjust to the saturation independently from the remaining NAA pattern around 2.5 ppm. For the 2 Crtot peaks this means that their adjustment to ST effects was linked, which is not optimal as the direct saturation differs for the 2 peaks. However, providing this additional amount of freedom to the fitting model may cause overfitting and possibly also bias the evaluation results. This restriction might also cause deviations in the MM, because they are represented by an equally spaced‐Voigtline model, which provides the freedom to adapt to smaller changes, such that an inappropriate metabolite fit (e.g., caused by a different amount of direct saturation or ST effect on 1 component of the pattern) might be compensated by the MM fit. For example, the increasing signal for the MM regions between 1.1 and 1.5 ppm is probably caused by overlaying effects of Lac. For NAA and Lac, the metabolite Z‐spectra were, therefore, compared with the combined Z‐spectra of the metabolite and its underlying MM. The ST effect from water decreases when considering the MM in both cases, confirming the interference from MM signals.
Sampling the Z‐spectra more densely than with 0.3 ppm would probably be beneficial to better distinguish some of the components (e.g., amides vs. amines or between Cr and Glu within the amine group), but is limited by total scan time. For high B1 values, a larger offset for the M0 scan would have been beneficial to ensure that there is no partial saturation because of a semi‐solid MT effect in the reference scan.
In traditional CEST applications, the saturation parameters are optimized for specific targets, because the maximal detectability of the exchange effects is very specific. Here, an overview of the contributing effects is shown, which limits the quantification possibilities for the individual effects. With adaptation of the CEST saturation block and sampled offset region, specific exchange processes can be targeted in future studies.
With a correction method for direct saturation, an advanced fitting model might be established that accounts for the different amount of direct saturation for each metabolite. For this purpose, the correction would need to be evaluated for additional metabolite patterns, because here it has only been done on 3 singlet signals. This might allow for a more precise fit and hence a better evaluation of metabolite Z‐spectra and the possibility of quantitatively evaluating the ST for each metabolite. In principle, however, one would have to go all the way and include the whole CEST RF irradiation block plus relaxation in the simulation of the basis spectra because one does not just expect plain saturation of individual resonance lines, but complex spin‐state‐evolution given the J‐coupling patterns of each metabolite.
CEST MRI usually aims at spatial mapping rather than evaluations in a single ROI. The presented method can easily be extended to a mapping technique using MR spectroscopic imaging. 42 With this extension, the intrinsic information on the frequency of the water resonance will provide the possibility to correct also for B0 inhomogeneities in space and not only in time.
5. CONCLUSION
Using non‐water‐suppressed spectroscopy offers the time‐saving simultaneous recording of the traditional CEST Z‐spectrum and the metabolite spectrum under frequency‐selective saturation. Recording the water signal spectrum at each saturation frequency and each acquisition offers the possibility to correct Z‐spectra for drifts in B0 over time—and if combined with MR spectroscopic imaging—for B0‐inhomogeneities in space. In addition, exchange, ST, and direct saturation effects on metabolites and MM can be evaluated, which offers additional possibilities for quantifying the metabolite content and might give further insight into the composition of the traditional CEST Z‐spectrum. Detailed knowledge of ST effects is also relevant for judging the influence of water‐suppression sequences on absolute metabolite signals.
Supporting information
FIGURE S1 Illustration of the calculation of the direct saturation correction for the metabolite spectra
FIGURE S2 Illustration of fitted spectra
TEXT S1 Sequence design
TEXT S2 Fitting procedure
TEXT S3 Influence of relaxation times on direct saturation model. Direct saturation correction method
TEXT S4 Fitting Z‐spectra
ACKNOWLEDGMENTS
This work was funded by the Swiss National Science Foundation (320030‐175984).
Hoefemann M, Döring A, Fichtner ND, Kreis R. Combining chemical exchange saturation transfer and 1H magnetic resonance spectroscopy for simultaneous determination of metabolite concentrations and effects of magnetization exchange. Magn Reson Med. 2021;85:1766–1782. 10.1002/mrm.28574
Funding informationSwiss National Science Foundation, Grant/Award Numbers: 320030‐175984
REFERENCES
- 1. van Zijl PCM, Sehgal A. Proton chemical exchange saturation transfer (CEST) MRS and MRI. eMagRes. 2016;5:1‐26. [Google Scholar]
- 2. van Zijl PCM, Lam WW, Xu J, Knutsson L, Staniszc GJ. Magnetization transfer contrast and chemical exchange saturation transfer MRI. Features and analysis of the field‐ dependent saturation spectrum. Neuroimage. 2018;168:222‐241. [DOI] [PMC free article] [PubMed] [Google Scholar]
- 3. Zaiss M, Bachert P. Chemical exchange saturation transfer (CEST) and MR Z‐spectroscopy in vivo: A review of theoretical approaches and methods. Phys Med Biol. 2013;58:221‐269. [DOI] [PubMed] [Google Scholar]
- 4. Kogan F, Hariharan H, Reddy R. Chemical exchange saturation transfer (CEST) imaging: Description of technique and potential clinical applications. Curr Radiol Rep. 2013;1:102‐114. [DOI] [PMC free article] [PubMed] [Google Scholar]
- 5. van Zijl P, Yadav N. Chemical exchange saturation transfer (CEST): What is in a name and what isn’t? Magn Reson Med. 2011;65:927‐948. [DOI] [PMC free article] [PubMed] [Google Scholar]
- 6. Vinogradov E, Sherry AD, Lenkinski RE. CEST: From basic principles to applications, challenges and opportunities. J Magn Reson. 2013;229:155‐172. [DOI] [PMC free article] [PubMed] [Google Scholar]
- 7. Walker‐Samuel S, Johnson SP, Pedley B, Lythgoe MF, Golay X. Extracranial measurements of amide proton transfer using exchange‐modulated point‐resolved spectroscopy (EXPRESS). NMR Biomed. 2012;25:829‐834. [DOI] [PubMed] [Google Scholar]
- 8. de Graaf RA, van Kranenburg A, Nicolay K. Off‐Resonance metabolite magnetization transfer measurements on rat brain in situ. Magn Reson Med. 1999;41:1136‐1144. [DOI] [PubMed] [Google Scholar]
- 9. Dreher W, Norris DG, Leibfritz D. Magnetization transfer affects the proton creatine/phosphocreatine signal intensity. Magn Reson Med. 1994;31:81‐84. [DOI] [PubMed] [Google Scholar]
- 10. McLean MA, Simister RJ, Barker GJ, Duncan JS. Magnetization transfer effect on human brain metabolites and macromolecules. Magn Reson Med. 2005;54:1281‐1285. [DOI] [PubMed] [Google Scholar]
- 11. Kruiskamp MJ, de Graaf RA, van der Grond J, Lamerichs R, Nicolay K. Magnetic coupling between water and creatine protons in human brain and skeletal muscle, as measured using inversion transfer 1H‐MRS. NMR Biomed. 2001;14:1‐4. [DOI] [PubMed] [Google Scholar]
- 12. Renema WKJ, Kan HE, Wieringa B, Heerschap A. In vivo magnetic resonance spectroscopy of transgenic mouse models with altered high‐energy phosphoryl transfer metabolism. NMR Biomed. 2007;20:448‐467. [DOI] [PubMed] [Google Scholar]
- 13. Lu J, Zhou J, Cai C, Cai S, Chen Z. Observation of true and pseudo NOE signals using CEST‐MRI and CEST‐MRS sequences with and without lipid suppression. Magn Reson Med. 2015;73:1615‐1622. [DOI] [PMC free article] [PubMed] [Google Scholar]
- 14. Jones CK, Huang A, Xu J, et al. Nuclear Overhauser Enhancement (NOE) imaging in the human brain at 7T. Neuroimage. 2013;77:114‐124. [DOI] [PMC free article] [PubMed] [Google Scholar]
- 15. van Zijl PCM, Zhou J, Mori N, Payen J, Wilson D, Mori S. Mechanism of magnetization transfer during on‐ resonance water saturation. A new approach to detect mobile proteins, peptides, and lipids. Magn Reson Med. 2003;49:440‐449. [DOI] [PubMed] [Google Scholar]
- 16. Hoefemann M, Adalid V, Kreis R. Optimizing acquisition and fitting conditions for 1H MR spectroscopy investigations in global brain pathology. NMR Biomed. 2019;1‐11:e4161. [DOI] [PubMed] [Google Scholar]
- 17. Dreher W, Leibfritz D. New method for the simultaneous detection of metabolites and water in localized in vivo 1H nuclear magnetic resonance spectroscopy. Magn Reson Med. 2005;54:190‐195. [DOI] [PubMed] [Google Scholar]
- 18. MacMillan EL, Chong DGQ, Dreher W, Henning A, Boesch C, Kreis R. Magnetization exchange with water and T1 relaxation of the downfield resonances in human brain spectra at 3.0 T. Magn Reson Med. 2011;65:1239‐1246. [DOI] [PubMed] [Google Scholar]
- 19. Khlebnikov V, Bhogal A, Schuppert M, et al. Multicolor metabolic quantitative CEST (mmqCEST): High resolution imaging of brain metabolites. In: Proceedings of the 27th annual meeting of ISMRM, Montreal, Canada, 2019, p 0151. [Google Scholar]
- 20. Yadav NN, Sehgal A, van Zijl P. Characterization of brain metabolites using CEST and machine learning. In: Proceedings of the 27th annual meeting of ISMRM, Montreal, Canada, 2019, p 4998. [Google Scholar]
- 21. Chen L, Schär M, Chan KWY, et al. In vivo imaging of phosphocreatine with artificial neural networks. Nat Commun. 2020;11:1072. [DOI] [PMC free article] [PubMed] [Google Scholar]
- 22. Chong DGQ, Kreis R, Bolliger CS, Boesch C, Slotboom J. Two‐dimensional linear‐combination model fitting of magnetic resonance spectra to define the macromolecule baseline using FiTAID, a fitting tool for arrays of interrelated datasets. MAGMA. 2011;24:147‐164. [DOI] [PubMed] [Google Scholar]
- 23. Heo H, Han Z, Jiang S, Sch M, Van ZPCM, Zhou J. Quantifying amide proton exchange rate and concentration in chemical exchange saturation transfer imaging of the human brain. Neuroimage. 2019;189:202‐213. [DOI] [PMC free article] [PubMed] [Google Scholar]
- 24. Windschuh J, Zaiss M, Meissner J, et al. Correction of B1‐inhomogeneities for relaxation‐compensated CEST imaging at 7T. NMR Biomed. 2015;28:529‐537. [DOI] [PubMed] [Google Scholar]
- 25. Goerke S, Soehngen Y, Deshmane A, et al. Relaxation—Compensated APT and rNOE CEST—MRI of human brain tumors at 3 T. Magn Reson Med. 2019;82:622‐632. [DOI] [PubMed] [Google Scholar]
- 26. Cai K, Haris M, Singh A, et al. Magnetic resonance imaging of glutamate. Nat Med. 2012;18:302‐306. [DOI] [PMC free article] [PubMed] [Google Scholar]
- 27. Haris M, Cai K, Singh A, Hariharan H, Reddy R. In vivo mapping of brain myo‐inositol. Neuroimage. 2012;54:2079‐2085. [DOI] [PMC free article] [PubMed] [Google Scholar]
- 28. Khlebnikov V, van der Kemp WJM, Hoogduin H, Klomp DWJ, Prompers JJ. Analysis of chemical exchange saturation transfer contributions from brain metabolites to the Z‐spectra at various field strengths and pH. Sci Rep. 2019;9:1098. [DOI] [PMC free article] [PubMed] [Google Scholar]
- 29. Zaiß M, Schmitt B, Bachert P. Quantitative separation of CEST effect from magnetization transfer and spillover effects by Lorentzian‐line‐fit analysis of z‐spectra. J Magn Reson. 2011;211:149‐155. [DOI] [PubMed] [Google Scholar]
- 30. Henkelman RM, Stanisz GJ, Graham SJ. Magnetization transfer in MRI: A review. NMR Biomed. 2001;14:57‐64. [DOI] [PubMed] [Google Scholar]
- 31. Kim M, Gillen J, Landman BA, Zhou J, van Zijl PCM. Water saturation shift referencing (WASSR) for chemical exchange saturation transfer (CEST) experiments. Magn Reson Med. 2009;61:1441‐1450. [DOI] [PMC free article] [PubMed] [Google Scholar]
- 32. Luo Y, Rydzewski J, de Graaf RA, Gruetter R, Garwood M, Schleich T. In vivo observation of lactate methyl proton magnetization transfer in rat C6 glioma. Magn Reson Med. 1999;41:676‐685. [DOI] [PubMed] [Google Scholar]
- 33. McLean MA, Barker GJ. Concentrations and magnetization transfer ratios of metabolites in gray and white matter. Magn Reson Med. 2006;56:1365‐1370. [DOI] [PubMed] [Google Scholar]
- 34. Yadav NN, Yang X, Li Y, Li W, Liu G, van Zijl PCM. Detection of dynamic substrate binding using MRI. Sci Rep. 2017;7:1‐7. [DOI] [PMC free article] [PubMed] [Google Scholar]
- 35. Träber F, Block W, Lamerichs R, Gieseke J, Schild HH. 1H metabolite relaxation times at 3.0 Tesla: Measurements of T1 and T2 values in normal brain and determination of regional differences in transverse relaxation. J Magn Reson Imaging. 2004;19:537‐545. [DOI] [PubMed] [Google Scholar]
- 36. Goerke S, Breitling J, Zaiss M, et al. Dual‐frequency irradiation CEST‐MRI of endogenous bulk mobile proteins. NMR Biomed. 2018;31:e3920. [DOI] [PubMed] [Google Scholar]
- 37. Cudalbu C, Behar K, Bhattacharyya P, et al. Contribution of macromolecules to brain 1H MR spectra: Experts’ consensus recommendations. NMR Biomed. 2020;e4393. [DOI] [PMC free article] [PubMed] [Google Scholar]
- 38. Zhang X‐Y, Wang F, Afzal A, et al. A new NOE‐mediated MT signal at around −1.6 ppm for detecting ischemic stroke in rat brain. Magn Reson Imaging. 2016;34:1100‐1106. [DOI] [PMC free article] [PubMed] [Google Scholar]
- 39. Zaiss M, Schuppert M, Deshmane A, et al. Chemical exchange saturation transfer MRI contrast in the human brain at 9.4 T. Neuroimage. 2018;179:144‐155. [DOI] [PubMed] [Google Scholar]
- 40. Fichtner ND, Giapitzakis IA, Avdievich N, et al. In vivo characterization of the downfield part of 1H MR spectra of human brain at 9.4 T: Magnetization exchange with water and relation to conventionally determined metabolite content. Magn Reson Med. 2018;79:2863‐2873. [DOI] [PubMed] [Google Scholar]
- 41. Grande S, Luciani AM, Rosi A, Guidoni L, Viti V. Identification of amide protons of glutathione in MR spectra of tumour cells. NMR Biomed. 2008;21:1057‐1065. [DOI] [PubMed] [Google Scholar]
- 42. Emir UE, Burns B, Chiew M, Jezzard P, Thomas MA. Non‐water‐suppressed short‐echo‐time magnetic resonance spectroscopic imaging using a concentric ring k‐space trajectory. NMR Biomed. 2017;30:e3714. [DOI] [PMC free article] [PubMed] [Google Scholar]
Associated Data
This section collects any data citations, data availability statements, or supplementary materials included in this article.
Supplementary Materials
FIGURE S1 Illustration of the calculation of the direct saturation correction for the metabolite spectra
FIGURE S2 Illustration of fitted spectra
TEXT S1 Sequence design
TEXT S2 Fitting procedure
TEXT S3 Influence of relaxation times on direct saturation model. Direct saturation correction method
TEXT S4 Fitting Z‐spectra


