

Abstract
Aim
To assess the effects of Roux‐en‐Y gastric bypass surgery (RYGB)‐related changes in glucagon‐like peptide‐1 (GLP‐1) on cerebral resting‐state functioning in obese women.
Materials and Methods
In nine obese females aged 40‐54 years in the fasted state, we studied the effects of RYGB and GLP‐1 on five a priori selected networks implicated in food‐ and reward‐related processes as well as environment monitoring (default mode, right frontoparietal, basal ganglia, insula/anterior cingulate and anterior cingulate/orbitofrontal networks).
Results
Before surgery, GLP‐1 receptor blockade (using exendin9‐39) was associated with increased right caudate nucleus (basal ganglia network) and decreased right middle frontal (right frontoparietal network) connectivity compared with placebo. RYGB resulted in decreased right orbitofrontal (insula/anterior cingulate network) connectivity. In the default mode network, after surgery, GLP‐1 receptor blockade had a larger effect on connectivity in this region than GLP‐1 receptor blockade before RYGB (all P FWE < .05). Results remained similar after correction for changes in body weight. Default mode and right frontoparietal network connectivity changes were related to changes in body mass index and food scores after RYGB.
Conclusions
These findings suggest GLP‐1 involvement in resting‐state networks related to food and reward processes and monitoring of the internal and external environment, pointing to a potential role for GLP‐1–induced changes in resting‐state connectivity in RYGB‐mediated weight loss and appetite control.
Keywords: appetite control, bariatric surgery, GLP‐1, weight control
1. INTRODUCTION
Roux‐en‐Y gastric bypass surgery (RYGB) is one of the most commonly used bariatric interventions to reduce body weight. 1 RYGB was originally believed to be an intake restrictive and absorption‐limiting procedure, but subsequent research has suggested that caloric intake restriction after RYGB is mediated via changes in the central nervous and endocrine systems, resulting in diminished appetite. 2 One such RYGB‐mediated alteration is a significant rise in the gut hormone glucagon‐like peptide‐1 (GLP‐1) secretion after meal ingestion, 3 and increased GLP‐1 sensitivity. 4 GLP‐1 increases satiety and reduces appetite and energy intake, suggesting a cerebral GLP‐1 place of action. 5
Assessment of the brain's response to GLP‐1 and RYGB can be measured by using functional MRI (fMRI). Task‐based fMRI presenting food‐related pictures provides information about regions involved in the process of food evaluation. When fMRI is acquired during rest, activation of different brain regions occurs synchronously, which form so‐called resting‐state networks. 6 This activation is independent of any stimuli and provides information about the integrity of communication within these networks. 7 Important networks include the default mode, frontoparietal, and salience and reward networks. This communication is commonly labelled functional connectivity. Importantly, alterations in functional connectivity have previously been related to body mass index (BMI) and food intake, 8 showing it can be a suitable tool with which to study intrinsic brain alterations related to GLP‐1 and RYGB.
In the brain, various structures (e.g. hypothalamus, caudate nucleus, putamen, insula, [orbito]frontal cortex) have been found to be involved in food and appetite processing. The literature on resting‐state functional connectivity alterations in response to GLP‐1 receptor blockade is scarce. One study in males showed that blocking GLP‐1 receptors after ingestion of a glucose load resulted in increased connectivity with the amygdala and orbitofrontal cortex, but lower connectivity with the caudate nucleus compared with ingestion of a glucose load without GLP‐1 receptor blockade. 9 Bariatric surgery has also been shown to affect intrinsic functional connectivity, albeit literature reporting this is scarce. One study showed that connectivity was lowered in a group of people after bariatric surgery in response to meal ingestion in the insula and precuneus. 10
No studies have investigated the role of GLP‐1 in resting‐state connectivity changes before and after bariatric surgery. Therefore, in this study, we intended, in the fasted state, to (a) analyse the effects of GLP‐1 on resting‐state networks before RYGB, (b) study the effects of RYGB on resting‐state brain connectivity, and (c) investigate the role of GLP‐1 in this process by blocking GLP‐1 receptors during resting‐state fMR image acquisition. In this study, we focused on five a priori chosen resting‐state networks (default mode, right frontoparietal, basal ganglia, anterior cingulate/orbitofrontal cortex and insula/anterior cingulate network) that have been shown to be involved in monitoring behaviour, related to food intake and BMI, or to include food and reward brain regions. 11 , 12 , 13 , 14 , 15 , 16 We hypothesized that connectivity in key regions of these networks, such as the basal ganglia, insula and precuneus, would be altered after RYGB, and that GLP‐1 receptor blockade could reverse these effects.
2. MATERIALS AND METHODS
2.1. Participants
The study is part of a larger study (NCT01363609, ClinicalTrials.gov) assessing cerebral GLP‐1 effects in type 2 diabetes and obesity, which was approved by VU University Medical Center's Medical Ethics Review Committee and conducted in accordance with the Declaration of Helsinki. 17 All participants provided signed written informed consent. Ten female candidates for RYGB were selected from the Center for Bariatric Surgery at Slotervaart Hospital (Amsterdam, the Netherlands). As described previously, the inclusion criteria were a BMI greater than 35 kg/m2, stable weight during the previous month before surgery (less than 5% reported change), being aged 40‐65 years and right‐handed. Although participants were given general advice about healthy food choices, they could not be on a formal calorie‐restricted diet before the study. The exclusion criteria included having a history of neurological disease or previously diagnosed psychiatric disorders, using centrally acting agents (i.e. corticosteroids), having diabetes and MRI contraindications. 17
2.2. Study protocol
The experimental design of the study has been described in detail previously. 17 Participants visited VU University Medical Center on four different occasions. The two initial visits were scheduled 2‐8 weeks prior to the RYGB procedure and the last two took place 4 weeks after surgery. All participants received laparoscopic RYGB. All resting‐state fMRI scans were performed during the preprandial state, with either placebo (0.9% sodium chloride [NaCl] solution) or GLP‐1 receptor antagonist exendin9‐39 (Clinalfa; Bachem, Bubendorf, Switzerland; used to block effects of endogenous GLP‐1) infusion in randomized single‐blinded (participant) order. Infusion, using MRI‐compatible pumps (MRidium 3850 IV Pump; Ira‐dimed, Winter Park, FL, USA), began 1 hour before the start of the resting‐state fMRI and continued until the end of the MRI session. Exendin9‐39 was diluted in 0.9% NaCl solution containing 0.5% human serum albumin and was infused at a rate of 600 pmol/kg/minute, a protocol that has been safely used previously by ourselves and others, 18 , 19 , 20 , 21 , 22 and has been shown to block the central effects of endogenous GLP‐1. 18 , 19 , 20 Blood was drawn upon arrival at the medical centre and at the beginning of MRI acquisition to measure GLP‐1 and glucose levels. Sensations of hunger, fullness and prospective food consumption, as well as appetite for sweet, savoury or fattening foods were assessed using a visual analogue scale at every visit, before MRI scanning.
2.3. Power calculation
The sample size calculation was based on the task‐based fMRI study that was also part of this protocol, and which has been published previously. 17 Given the sample size of nine (after the exclusion of one participant), an α of 0.05 and an estimated power (1 ‐ β) of 0.80, we would be able to detect differences with an effect size of δ = 1.07.
2.4. MRI acquisition
For MRI acquisition, a 3.0 Tesla GE Signa HDxt scanner (GE Healthcare, Milwaukee, WI, USA) was used. Structural images were acquired using a T1‐weighted 3D fast spoiled gradient‐echo sequence (FSGE; repetition time [TR]: 8.2 ms, echo time [TE]: 3.2 ms, 1 mm isotropic voxels). An echo‐planar imaging sequence (TR: 1800 ms, TE: 35 ms, flip angle: 80°, voxel size: 3 mm, isotropic 34 slices) was used to obtain the resting‐state fMRI data, while participants were instructed to keep their eyes closed, not to fall asleep and not to think of anything in particular.
2.5. MRI preprocessing
The preprocessing of the resting‐state fMRI data was performed with the FMRIB Software Library (FSL 6.0; http://www.fmrib.ox.ac.uk/fsl). The preprocessing discarded the first two volumes, allowing the occurrence of a steady state signal. For the 200 remaining volumes, correction for motion and slice‐timing was performed; the brain was extracted and smoothed using a 6‐mm full width at half maximum Gaussian kernel. To further correct for larger‐scale movement artifacts, independent component analysis‐[based] automatic removal of motion artifacts (ICA‐AROMA) was used. This ICA‐based pipeline regresses out movement artifacts without the need to apply scrubbing or censoring, circumventing the problems associated with these methods. 23 Finally, images were temporally filtered using a 150‐second high‐pass filter, as well as registered to each subject's high‐resolution T1‐FSGE scan with boundary‐based registration then non‐linearly warped to 4 mm standard space. Preprocessing, registration and scan quality underwent manual verification.
2.6. Resting‐state fMRI analysis
The group ICA of fMRI toolbox (GIFT 3.0) of the Medical Image Analysis Lab (MIALAB; http://mialab.mrn.org/software/gift/) was used to analyse the preprocessed fMRI data. Initially, the images from all the time points were submitted to an ICA with 20 repetitions, to identify large‐scale patterns of connectivity across the study sample. After being concatenated in aggregate series, the data were reduced with principal component analysis. The infomax algorithm was used to estimate independent group components. 24 The consistency of the derived networks was determined using ICASSO software, which is implemented in GIFT. Spatial–temporal regression was used to create subject‐specific spatial and temporal networks of these whole‐group ICA maps. Lastly, subject‐specific component images and time courses were converted into z‐values to acquire comparable values across subjects. Networks of interest were chosen a priori. These included the right frontoparietal networks for its role in monitoring the external environment, the default mode network including the hippocampus for its role in monitoring the internal environment, the basal ganglia, anterior cingulate/orbitofrontal cortex, and insula/anterior cingulate gyrus networks for their role in food and reward. These networks were identified by visual inspection and the spatial correlations with previously defined resting‐state networks found in a large meta‐analysis were calculated. 25
2.7. Statistical analyses
Differences in participant characteristics before and after RYGB were calculated using related‐sample Wilcoxon signed‐rank tests, as normality of data cannot be assumed in comparatively small sample sizes.
The resting‐state fMRI data were analysed using the sandwich estimator, a novel feature of FSL 6.0, which is designed to more accurately calculate differences between and within groups in longitudinal studies with repeated measures. 26 Furthermore, it allowed for non‐parametric inference with threshold‐free cluster enhancement (TFCE) and family‐wise error (FWE) correction for multiple comparisons using Wild Bootstrap. 27 For this study, all four time points were included in the tested model, using TFCE inference with 10 000 wild bootstraps. FWE correction was used to correct for multiple comparisons at P FWE less than .05. Because of the explorative nature of this study, we did not consider a minimum cluster size.
Exploratively, correlations between the results of local changes in functional connectivity, and BMI and appetite‐related scores, were analysed using Spearman's correlations.
Baseline characteristics and correlations were calculated in SPSS23 (IBM‐SPSS, Chicago, IL, USA). PALM was used for voxel‐wise comparisons. A P less than .05 was considered statistically significant.
3. RESULTS
3.1. Participant characteristics
Because of an artifact in one of the resting‐state fMRI scans, one participant was excluded from the study. The median age of the nine included females was 47 (range: 40‐54) years (Table 1). One participant used cholesterol‐lowering agents, three used antihypertensives and another three used thyroid medication. Four weeks after surgery, there was a significant reduction in BMI, waist circumference, weight, body fat and lean mass, and appetite scores for sweet and fattening food (all P < .05; Table 1). Diastolic blood pressure tended to be lower (P = .051).
TABLE 1.
Participant characteristics
| n = 9 | Before RYGB | 4 weeks after RYGB | P‐value |
|---|---|---|---|
| Age (y) | 47.0 (40‐54) | ‐ | ‐ |
| Body mass index (kg/m2) | 40.0 (36‐43) | 37.0 [33.55‐40] | .007 |
| Waist (cm) | 121.0 (110‐131) | 113.0 [96‐119] | .008 |
| Weight (kg) | 107.0 (95‐123) | 98.0 [88‐113] | .008 |
| Systolic blood pressure (mmHg) | 118.7 (102‐142) | 115.0 [105‐137] | .310 |
| Diastolic blood pressure (mmHg) | 81.0 (62‐94) | 74.0 [67‐86.67] | .051 |
| Heart rate (beats/min) | 72.0 (60‐84) | 63.0 [57‐81] | .084 |
| Total cholesterol (mmol/L) | 5.0 (4‐7) | 3.9 [3‐5] | .007 |
| Triglycerides (mmol/L) | 1.0 (0.8‐3) | 1.0 [0.8‐2] | .102 |
| HbA1c (%) | 5.7 (5‐6) | 5.4 (5‐6) | .180 |
| HbA1c (mmol/mol) | 38.8 (31.15‐42.08) | 35.5 (31.15‐42.08) | .180 |
| Fasting glucose (mmol/L) | 5.0 (4‐6) | 5.0 (4‐5.1) | .786 |
| Fasting GLP‐1 (pmol/L) | 33.0 (21‐48) | 33.0 (26‐40) | .593 |
| Body fat mass (kg) | 51.0 (46‐62) | 48.0 (37.8‐54) | .007 |
| Lean mass (kg) | 54.3 (48‐61) | 53.0 (46‐58) | .017 |
| Hunger score | 6.0 (0‐7) | 2.0 (0‐7) | .062 |
| Fullness score | 4.0 (0‐5) | 4.0 (2‐8) | .233 |
| Prospective food consumption score | 5.0 (3‐10) | 4.0 (1‐6) | .058 |
| Appetite for sweet food score | 5.0 (0‐7) | 2.0 (0‐4) | .034 |
| Appetite for savoury food score | 5.0 (0‐8) | 3.0 (0‐6) | .172 |
| Appetite for fat food score | 2.0 (0‐7) | 0 (0‐3) | .043 |
Data are shown as median with minimum and maximum between brackets.
3.2. Effects of the GLP‐1 blockade on resting‐state networks before RYGB
Pre‐RYGB, compared with placebo (NaCl) infusion, GLP‐1 receptor blockade led to decreased connectivity in the right middle frontal gyrus of the right frontoparietal network (Figures 1 and 2, Table 2; P FWE < .05). By contrast, GLP‐1 receptor blockade resulted in an increase in connectivity in the right caudate nucleus of the basal ganglia network (Figures 1 and 2, Table 2; P FWE < .05). There was a positive correlation between lowered right frontoparietal and increased basal ganglia network connectivity (ρ = .817; P = .007; Figure 3).
FIGURE 1.
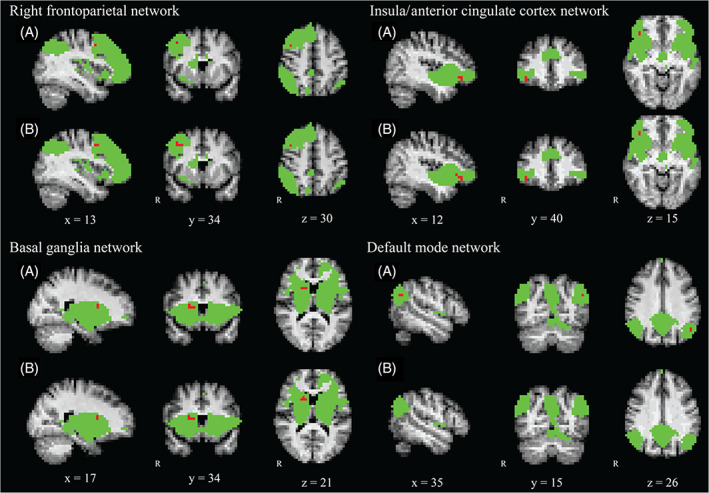
Overview of the resting‐state networks with statistically significant results. Voxels in green represent the masks of the study population‐specific networks. Voxels in red indicate the regions where statistically significant differences were found. Figures labelled A represent the results of the original analysis without BMI added as a confounding factor. Figures labelled B show the results of the analysis corrected for BMI across all four time points. The images are presented in radiological orientation with 4 mm isotropic voxels and the MNI standard space coordinates are given
TABLE 2.
Resting‐state functional MRI analysis results
| Analysis network | Region | Side | Cluster size without BMI (voxels/mm3) | Cluster size with BMI (voxels/mm3) |
|---|---|---|---|---|
| Infusion effect (presurgery placebo vs. presurgery Exendin9‐39) | ||||
| Basal ganglia | Caudate nucleus | R | 4/256 | 5/320 |
| Right frontoparietal | Middle frontal gyrus | R | 2/128 | 6/384 |
| Surgery effect (presurgery placebo vs. postsurgery placebo) | ||||
| Insula/anterior cingulate cortex | Orbitofrontal cortex | R | 3/192 | 5/320 |
| Interaction effect (surgery vs. infusion) | ||||
| Default mode network | Lateral occipital cortex | L | 2/128 | NS |
Abbreviations: MBI, body mass index; L, left; R, right.
All of the results above have a P FWE < .05, except for NS: not significant at P FWE = .08.
FIGURE 3.
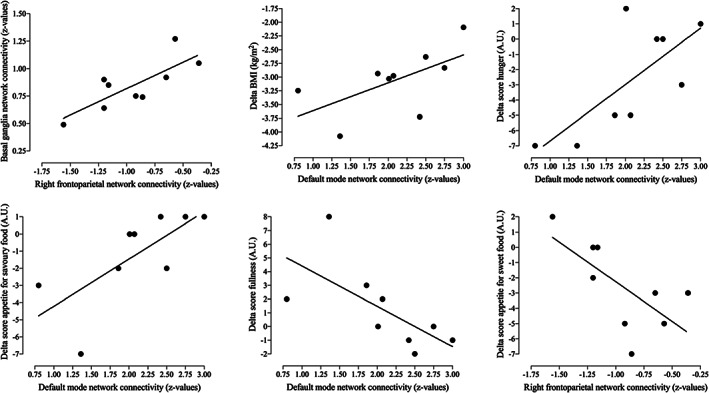
Scatterplots of the correlations between connectivity changes and changes in BMI, hunger and fullness, as well as appetite for savoury and sweet food scores
3.3. Effects of RYGB on resting‐state brain connectivity
RYGB was associated with decreased connectivity in the right orbitofrontal cortex of the insula/anterior cingulate cortex network (comparison before and after surgery during placebo [NaCl] infusion; Figure 1; Table 2; Figure 2, top‐right graph; P FWE < .05).
FIGURE 2.
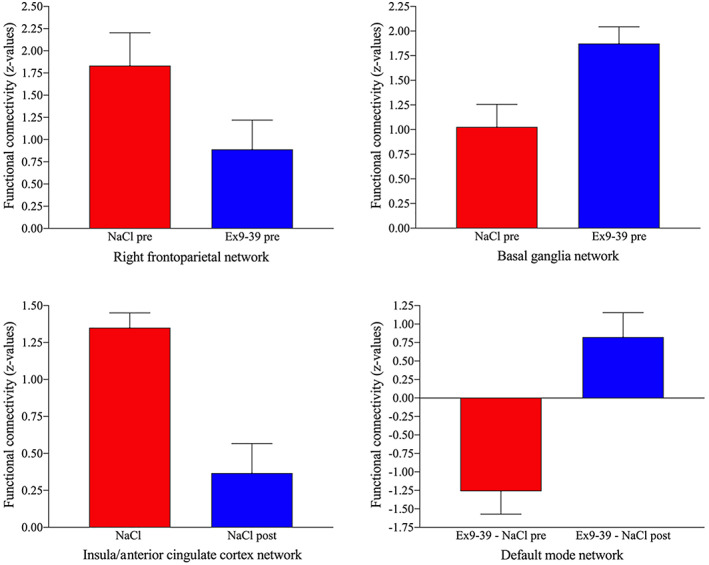
Bar graphs illustrating resting‐state connectivity in z‐values for all of the components in which results were found. Ex9‐39, exendin9‐39; pre, pre‐RYGB; post, post‐RYGB
3.4. Comparison of the effects of GLP‐1 receptor blockade before and after RYGB
The interaction between surgery and GLP‐1 receptor blockade was significant for the default mode network in the left lateral occipital cortex (Figures 1 and 2, Table 2; P FWE < .05). As illustrated in Figure 2, after surgery, GLP‐1 receptor blockade had a larger effect on connectivity in this region than GLP‐1 receptor blockade before RYGB.
3.5. Effects of body weight changes on resting‐state fMRI connectivity
As the above‐mentioned results might be influenced by changes in BMI, we added BMI at each visit as a confounding factor. As can be seen from Figure 1 and Table 2, adding BMI to the analysis increased the number of significantly altered voxels for the basal ganglia, right frontoparietal and insula/anterior cingulate cortex networks (all P FWE ≤ .05). For the default mode network, the voxels showing a significant interaction reached trend‐level (P FWE = .08).
3.6. Correlations between functional connectivity changes and biomedical variables
In the exploratory analysis, correlations were analysed between delta scores (postplacebo and preplacebo), BMI and hunger scores (Figure 3).
A stronger increase in post‐RYGB connectivity related to GLP‐1 receptor blockade in the left lateral occipital cortex of the default mode network was related to a larger decrease in BMI (ρ = .733; P = .025), hunger scores (ρ = .675; P = .046), appetite for savoury food (ρ = .812; P = .008, respectively), and to a stronger increase in fullness after surgery (ρ = −.768; P = .016).
Lastly, a correlation was found between a larger decrease in right middle frontal gyrus (right frontoparietal network) connectivity following GLP‐1 receptor blockade during pre‐RYGB conditions and a smaller decrease in appetite for sweet food (ρ = −.692; P = .039).
4. DISCUSSION
In this study, we assessed the effects of RYGB in combination with the blockade of receptors of the hormone GLP‐1 on large‐scale, resting‐state functional connectivity networks in the human brain. Before surgery, GLP‐1 receptor blockade was related to a decrease in right middle frontal connectivity of the right frontoparietal network, whereas an increase in connectivity in the right caudate nucleus of the basal ganglia network was observed. RYGB led to decreased connectivity in the right orbitofrontal cortex of the insula/anterior cingulate cortex network. In the left lateral occipital cortex of the default mode network, the effect of GLP‐1 receptor blockade after RYGB was stronger than before this intervention. Moreover, connectivity changes were also correlated with changes in BMI, hunger, fullness and appetite scores.
The right frontoparietal network, showing lowered middle frontal gyrus presurgical connectivity because of GLP‐1 receptor blockade, has been associated with obesity and regulation of reward processing, 14 and has also been shown to have an important role in inhibition of impulsive responses and in monitoring the external environment. 28 The middle frontal gyrus itself is a region where previously altered fractional amplitude of low frequency fluctuations has been shown in the preprandial state after bariatric surgery, 29 which shows the importance of this gyrus in obesity and GLP‐1 functioning. Our decrease in connectivity when GLP‐1 receptors are blocked may thus indicate a weakening focus on the external environment and lower control of behaviour. Indeed, we found a correlation between a larger decrease in connectivity during presurgical GLP‐1 receptor blockade and a smaller reduction in appetite scores for sweet food after RYGB intervention. This shows the clinical relevance of decreasing right frontoparietal network connectivity in obesity, but continued research should replicate these results.
Presurgery GLP‐1 receptor blockade increased right caudate nucleus connectivity of the basal ganglia network, which has been associated with reward processes, hunger and thirst. 25 In the caudate nucleus, resting‐state connectivity, but also activation during milkshake consumption, were found to be decreased in obese compared with lean participants, 30 and, when viewing pictures of food, post‐RYGB caudate nucleus activation during GLP‐1 receptor blockade was increased in the women included in this study. 17 These studies and the current results clearly show a role of GLP‐1 in the caudate nucleus. However, in this study, we did not find a correlation between increased caudate connectivity and BMI or appetite reductions. We did observe, however, that a stronger decrease in right frontoparietal network connectivity followed by GLP‐1 receptor blockade was related to a smaller increase (i.e. less reactive) of connectivity in the basal ganglia network during GLP‐1 receptor blockade. This may suggest cross‐talk between both networks and a cortico‐subcortical loop related to GLP‐1 functioning. These findings warrant further investigations in larger groups.
After RYGB, during placebo infusion, we observed decreased insula and anterior cingulate cortex network right orbitofrontal connectivity. This network is also known as the ‘salience network’, which is involved in guidance of behaviour through integration of internal, self‐oriented cognitive activity and information gathered from monitoring the external environment. 13 The orbitofrontal cortex is known to be involved in reward processes, 31 which could further explain the alterations in connectivity and eating behaviour after RYGB. However, no correlations were found with altered BMI or food scores.
The analysis of the interaction between surgery and exendin9‐39 infusion was performed to investigate whether GLP‐1 receptor blockade after surgery would have a differential effect on connectivity than before surgery. In the left lateral occipital cortex of the default mode network, which is responsible for interoceptive cognition, 15 a significant interaction effect was observed. This region has been implicated in tracking the energetic and reward value of food when visual stimuli are presented. 32 As shown in Figure 2, RYGB led to a greater increase in connectivity following GLP‐1 receptor blockade compared with before surgery. Given the hypothesis that people with obesity have lower GLP‐1 sensitivity, this may suggest that a stronger increase in connectivity postsurgery during GLP‐1 receptor blockade indicates higher GLP‐1 sensitivity. Another region of the default mode network, the precuneus, has previously been shown to be affected by bariatric surgery. 10 This region has also been related to suppressing cravings for high caloric foods, 16 and rumination about eating and weight in people with eating disorders. 33 This shows the importance of the default mode network as a whole for eating and body weight, and our results add to this literature about how default mode network connectivity is affected by RYGB and GLP‐1 receptor blockade.
Interestingly, the clinical relevance of connectivity changes in the lateral occipital cortex was shown by its relationship with changes in BMI, hunger and fullness scores, and in appetite for savoury foods after surgery. The direction of the correlation indicates that a stronger increasing effect of GLP‐1 receptor blockade post‐RYGB (i.e. increased GLP‐1 sensitivity postintervention) is related to a larger improvement in BMI, hunger and fullness scores, as well as appetite for savoury foods.
Even although GLP‐1 levels were not altered significantly in the fasting state (see Table 1), our results indicate that its effect on preprandial resting‐state functional connectivity is altered after, compared with before, RYGB. This differential effect after RYGB at similar levels of GLP‐1 may suggest a difference in sensitivity to or effectiveness of GLP‐1, even when its levels are naturally low. Interestingly, a previous study with the same participants using task‐related fMRI also suggested increased GLP‐1 sensitivity post‐RYGB in the preprandial state, as GLP‐1 levels did not increase after surgery, but its effects on response to visual food cues did. 17 The mechanisms behind this potentially increased GLP‐1 sensitivity are not understood, and this study was not designed to directly test GLP‐1 sensitivity. It is, however, known that lower BMI is related to increased gut hormone (GLP‐1 and others) effects, 34 and RYGB itself, independent of weight loss, is related to increased sensitivity to other hormones, such as insulin. 35 , 36 Future studies need to explore these mechanisms.
Post‐RYGB scans were performed after 4 weeks to minimize the possible influence of weight loss on the effect RYGB has on the brain. However, there was a small amount of weight loss. To examine if this weight loss had a significant effect on the results, we added BMI at each visit as a confounding factor and the results were broadly similar. Future studies in larger samples should include measurements during the initial weight‐loss phase and also during the period of stable weight to further disentangle the effect of weight loss and RYGB.
The limitations of this study include the small sample size, which might have led to underdetection of potential changes. However, the within‐subject cross‐over design with four scans in the same patients increased statistical power, and allowed detection of robust changes in four resting‐state networks. Because of the small sample size, we were only able to determine correlations between biomedical variables and food‐related questionnaires, as correlation coefficients are inflated in smaller samples. Because the current study only included females, the results are not generalizable to males. We did not measure resting‐state connectivity after a meal, and thus have no indication of GLP‐1 and surgical effects on connectivity in the postprandial stage.
In conclusion, in response to GLP‐1 receptor blockade before surgery, we found that resting‐state functional connectivity decreases in a network implicated in monitoring the external environment and controlling behaviour, whereas connectivity increased in a network related to food consumption. RYGB resulted in decreased connectivity in a region (right orbitofrontal gyrus) related to emotional eating. Lastly, the default mode network (internal processes and tracking energetic value of food) displayed a differential effect of GLP‐1 receptor blockade before and after surgery, possibly suggesting changes in GLP‐1 sensitivity postsurgery and a central role for GLP‐1 in brain changes after bariatric surgery. These findings provide further insights into the mechanisms underlying the weight‐lowering effects of RYGB and may help in the development of new treatment strategies for obesity.
CONFLICT OF INTEREST
C.F.D. has received consultancy/speaker fees from Bristol‐Myers Squibb, Boehringer Ingelheim, Eli Lilly and Company, Merck Sharp & Dohme, Novartis and Novo Nordisk. J.J.H. has received fees for consulting, lecturing and/or being part of an advisory board from AstraZeneca, Boehringer Ingelheim, Bristol‐Myers Squibb, Eli Lilly and Company, GI Dynamics, Merck Sharp & Dohme, Novo Nordisk, Novartis, Sanofi, Takeda and Zealand Pharma. M.D. was a consultant for Abbott, AstraZeneca, Bristol‐Myers Squibb, Boehringer Ingelheim, Eli Lilly and Company, GI Dynamics, Merck Sharp & Dohme, Novo Nordisk, Poxel SA and Sanofi and was a speaker for BristolMyers Squibb/AstraZeneca, Eli Lilly and Company, Novo Nordisk and Sanofi. Through M.D., the VU University Medical Center received research grants from Abbott, Bristol‐Myers Squibb/AstraZeneca, Boehringer Ingelheim, Eli Lilly and Company, Medtronic, Merck Sharp & Dohme, Novo Nordisk and Sanofi. R.G.I. is the principal investigator of studies sponsored by research grants from Novo Nordisk and Eli Lilly and Company. M.D. and R.G.I. report receiving no personal payments in connection to the above‐mentioned activities, but all payments were directly transferred to the Diabetes Center (VU University Medical Center) non‐profit research foundation. No other potential conflicts of interest relevant to this article were reported.
AUTHORS CONTRIBUTIONS
G.B. provided the framework of resting‐state networks and performed the statistical analyses. E.v.D. supervised design of the resting‐state analysis and statistical analyses. L.v.B. contributed to the design of the study. D.C.M. provided the neuroimaging infrastructure. D.J.V. participated in the design of the study. F.B. participated in the design of the study and performed clinical analyses of all structural MRI scans. V.E.A.G. contributed to the design and the performance of the study. C.F.D. and J.J.H. performed the laboratory analyses included in this manuscript. M.L.D. contributed to the design of the study. M.D. designed the study. J.S.K. designed the study and conducted the experiments. R.G.I. designed the study. All the authors, except for M.D., who passed away in 2014, contributed significantly to writing the manuscript and have seen and approved the final version. E.v.D. and R.G.I. are the guarantors of this work and, as such, had full access to all the data in the study and take responsibility for the integrity of the data and the accuracy of the data analysis.
PEER REVIEW
The peer review history for this article is available at https://publons.com/publon/10.1111/dom.14233.
ACKNOWLEDGEMENTS
F.B. is supported by the NIHR Biomedical Research Center at UCLH.
van Duinkerken E, Bernardes G, van Bloemendaal L, et al. Cerebral effects of glucagon‐like peptide‐1 receptor blockade before and after Roux‐en‐Y gastric bypass surgery in obese women: A proof‐of‐concept resting‐state functional MRI study. Diabetes Obes Metab. 2021;23:415–424. 10.1111/dom.14233
Funding information F.B. is supported by the National Institute of Health Research Biomedical Research Center at University College London Hospitals.
DATA AVAILABILITY STATEMENT
The data that support the findings of this study are available from the corresponding author upon reasonable request.
REFERENCES
- 1. Angrisani L, Santonicola A, Iovino P, Formisano G, Buchwald H, Scopinaro N. Bariatric surgery worldwide 2013. Obes Surg. 2015;25(10):1822‐1832. [DOI] [PubMed] [Google Scholar]
- 2. Rao RS. Bariatric surgery and the central nervous system. Obes Surg. 2012;22(6):967‐978. [DOI] [PubMed] [Google Scholar]
- 3. Jørgensen NB, Dirksen C, Bojsen‐Møller KN, et al. Exaggerated glucagon‐like peptide 1 response is important for improved β‐cell function and glucose tolerance after Roux‐en‐Y gastric bypass in patients with type 2 diabetes. Diabetes. 2013;62(9):3044‐3052. [DOI] [PMC free article] [PubMed] [Google Scholar]
- 4. le Roux CW, Aylwin SJB, Batterham RL, et al. Gut hormone profiles following bariatric surgery favor an anorectic state, facilitate weight loss, and improve metabolic parameters. Ann Surg. 2006;243(1):108‐114. [DOI] [PMC free article] [PubMed] [Google Scholar]
- 5. Gutzwiller J‐P, Drewe J, Göke B, et al. Glucagon‐like peptide‐1 promotes satiety and reduces food intake in patients with diabetes mellitus type 2. Am J Physiol. 1999;276(5):R1541‐R1544. [DOI] [PubMed] [Google Scholar]
- 6. Raichle ME, Mintun MA. Brain work and brain imaging. Ann Rev Neurosci. 2006;29(1):449‐476. [DOI] [PubMed] [Google Scholar]
- 7. Damoiseaux JS, Rombouts SARB, Barkhof F, et al. Consistent resting‐state networks across healthy subjects. Proc Natl Acad Sci U S A. 2006;103(37):13848‐13853. [DOI] [PMC free article] [PubMed] [Google Scholar]
- 8. Baek K, Morris LS, Kundu P, Voon V. Disrupted resting‐state brain network properties in obesity: decreased global and putaminal cortico‐striatal network efficiency. Psychol Med. 2017;47(4):585‐596. [DOI] [PMC free article] [PubMed] [Google Scholar]
- 9. Meyer‐Gerspach AC, Ly HG, Borgwardt S, et al. Endogenous GLP‐1 alters postprandial functional connectivity between homeostatic and reward‐related brain regions involved in regulation of appetite in healthy lean males: a pilotstudy. Diabetes Obes Metab. 2018;20(10):2330‐2338. [DOI] [PubMed] [Google Scholar]
- 10. Lepping RJ, Bruce AS, Francisco A, et al. Resting‐state brain connectivity after surgical and behavioral weight loss. Obesity. 2015;23(7):1422‐1428. [DOI] [PMC free article] [PubMed] [Google Scholar]
- 11. Doornweerd S, van Duinkerken E, de Geus EJ, Arbab‐Zadeh P, Veltman DJ, IJzerman RG. Overweight is associated with lower resting state functional connectivity in females after eliminating genetic effects: a twin study. Hum Brain Mapp. 2017;38:5069‐5081. [DOI] [PMC free article] [PubMed] [Google Scholar]
- 12. Hege MA, Stingl KT, Veit R, Preissl H. Modulation of attentional networks by food‐related disinhibition. Physiol Behav. 2017;176:84‐92. [DOI] [PubMed] [Google Scholar]
- 13. Menon V, Uddin LQ. Saliency, switching, attention and control: a network model of insula function. Brain Struct Funct. 2010;214(5):655‐667. [DOI] [PMC free article] [PubMed] [Google Scholar]
- 14. B‐y P, Seo J, Park H. Functional brain networks associated with eating behaviors in obesity. Sci Rep. 2016;6(1):23891. [DOI] [PMC free article] [PubMed] [Google Scholar]
- 15. Raichle ME. The brain's default mode network. Annu Rev Neurosci. 2015;38(1):433‐447. [DOI] [PubMed] [Google Scholar]
- 16. Yokum S, Stice E. Cognitive regulation of food craving: effects of three cognitive reappraisal strategies on neural response to palatable foods. Int J Obes. 2013;37(12):1565‐1570. [DOI] [PMC free article] [PubMed] [Google Scholar]
- 17. ten Kulve JS, Veltman DJ, Gerdes VEA, et al. Elevated postoperative endogenous GLP‐1 levels mediate effects of Roux‐en‐Y gastric bypass on neural Responsivity to food cues. Diabetes Care. 2017;40(11):1522‐1529. [DOI] [PubMed] [Google Scholar]
- 18. van Bloemendaal L, IJzerman RG, ten Kulve JS, et al. GLP‐1 receptor activation modulates appetite‐ and reward‐related brain areas in humans. Diabetes. 2014;63(12):4186‐4196. [DOI] [PubMed] [Google Scholar]
- 19. van Bloemendaal L, Veltman DJ, ten Kulve JS, et al. Brain reward‐system activation in response to anticipation and consumption of palatable food is altered by glucagon‐like peptide‐1 receptor activation in humans. Diabetes Obes Metab. 2015;17(9):878‐886. [DOI] [PubMed] [Google Scholar]
- 20. ten Kulve JS, Veltman DJ, van Bloemendaal L, et al. Endogenous GLP‐1 mediates postprandial reductions in activation in central reward and satiety areas in patients with type 2 diabetes. Diabetologia. 2015;58(12):2688‐2698. [DOI] [PMC free article] [PubMed] [Google Scholar]
- 21. Deane AM, Nguyen NQ, Stevens JE, et al. Endogenous glucagon‐like peptide‐1 slows gastric emptying in healthy subjects, attenuating postprandial glycemia. J Clin Endocrinol Metab. 2010;95(1):215‐221. [DOI] [PubMed] [Google Scholar]
- 22. Salehi M, Aulinger B, Prigeon RL, D'Alessio DA. Effect of endogenous GLP‐1 on insulin secretion in type 2 diabetes. Diabetes. 2010;59(6):1330‐1337. [DOI] [PMC free article] [PubMed] [Google Scholar]
- 23. Pruim RHR, Mennes M, van Rooij D, Llera A, Buitelaar JK, Beckmann CF. ICA‐AROMA: a robust ICA‐based strategy for removing motion artifacts from fMRI data. NeuroImage. 2015;112:267‐277. [DOI] [PubMed] [Google Scholar]
- 24. Bell AJ, Sejnowski TJ. An information‐maximization approach to blind separation and blind deconvolution. Neural Comput. 1995;7(6):1129‐1159. [DOI] [PubMed] [Google Scholar]
- 25. Laird AR, Fox PM, Eickhoff SB, et al. Behavioral interpretations of intrinsic connectivity networks. J Cogn Neurosci. 2011;23(12):4022‐4037. [DOI] [PMC free article] [PubMed] [Google Scholar]
- 26. Guillaume B, Hua X, Thompson PM, Waldorp L, Nichols TE. Fast and accurate modelling of longitudinal and repeated measures neuroimaging data. NeuroImage. 2014;94:287‐302. [DOI] [PMC free article] [PubMed] [Google Scholar]
- 27. Guillaume B, Nichols T. Non‐parametric Inference for Longitudinal and Repeated‐Measures Neuroimaging Data with the Wild Bootstrap. Poster presented at the Organization for Human Brain Mapping (OHBM) in Hawaii. 2015. https://warwick.ac.uk/fac/sci/statistics/staff/academic-research/nichols/presentations/ohbm2015/Guillaume-LongRepeatMeasWB-OHBM2015.pdf. Accessed May 23, 2020. [Google Scholar]
- 28. Hu S, Ide JS, Zhang S, Li C‐sR. The right superior frontal gyrus and individual variation in proactive control of impulsive response. J Neurosci. 2016;36(50):12688‐12696. [DOI] [PMC free article] [PubMed] [Google Scholar]
- 29. Wiemerslage L, Zhou W, Olivo G, et al. A resting‐state fMRI study of obese females between pre‐ and postprandial states before and after bariatric surgery. Eur J Neurosci. 2017;45(3):333‐341. [DOI] [PubMed] [Google Scholar]
- 30. Geha P, Cecchi G, Todd Constable R, Abdallah C, Small DM. Reorganization of brain connectivity in obesity. Hum Brain Mapp. 2017;38(3):1403‐1420. [DOI] [PMC free article] [PubMed] [Google Scholar]
- 31. Li Y, Vanni‐Mercier G, Isnard J, Mauguière F, Dreher J‐C. The neural dynamics of reward value and risk coding in the human orbitofrontal cortex. Brain. 2016;139(4):1295‐1309. [DOI] [PubMed] [Google Scholar]
- 32. Toepel U, Knebel J‐F, Hudry J, le Coutre J, Murray MM. The brain tracks the energetic value in food images. NeuroImage. 2009;44(3):967‐974. [DOI] [PubMed] [Google Scholar]
- 33. Lee S, Ran Kim K, Ku J, Lee J‐H, Namkoong K, Jung Y‐C. Resting‐state synchrony between anterior cingulate cortex and precuneus relates to body shape concern in anorexia nervosa and bulimia nervosa. Psychiatry Res. 2014;221(1):43‐48. [DOI] [PubMed] [Google Scholar]
- 34. Muscelli E, Mari A, Casolaro A, et al. Separate impact of obesity and glucose tolerance on the incretin effect in normal subjects and type 2 diabetic patients. Diabetes. 2008;57(5):1340‐1348. [DOI] [PubMed] [Google Scholar]
- 35. Moulin de Moraes CM, Mancini MC, de Melo ME, et al. Prevalence of subclinical hypothyroidism in a morbidly obese population and improvement after weight loss induced by Roux‐en‐Y gastric bypass. Obes Surg. 2005;15(9):1287‐1291. [DOI] [PubMed] [Google Scholar]
- 36. Wickremesekera K, Miller G, Naotunne TD, Knowles G, Stubbs RS. Loss of insulin resistance after Roux‐en‐Y gastric bypass surgery: a time course study. Obes Surg. 2005;15(4):474‐481. [DOI] [PubMed] [Google Scholar]
Associated Data
This section collects any data citations, data availability statements, or supplementary materials included in this article.
Data Availability Statement
The data that support the findings of this study are available from the corresponding author upon reasonable request.