

Abstract
Ceftolozane/tazobactam (C/T) is a combination of a novel cephalosporin with tazobactam, recently approved for the treatment of hospital‐acquired and ventilator‐associated pneumonia. The plasma pharmacokinetics (PK) of a 3‐g dose of C/T (2 g ceftolozane and 1 g tazobactam) administered via a 1‐hour infusion every 8 hours in adult patients with nosocomial pneumonia (NP) were evaluated in a phase 3 study (ASPECT‐NP; NCT02070757). The present work describes the development of population PK models for ceftolozane and tazobactam in plasma and pulmonary epithelial lining fluid (ELF). The concentration‐time profiles of both agents were well characterized by 2‐compartment models with zero‐order input and first‐order elimination. Consistent with the elimination pathway, renal function estimated by creatinine clearance significantly affected the clearance of ceftolozane and tazobactam. The central volumes of distribution for both agents and the peripheral volume of distribution for tazobactam were approximately 2‐fold higher in patients with pneumonia compared with healthy participants. A hypothetical link model was developed to describe ceftolozane and tazobactam disposition in ELF in healthy participants and patients with pneumonia. Influx (from plasma to the ELF compartment) and elimination (from the ELF compartment) rate constants were approximately 97% lower for ceftolozane and 52% lower for tazobactam in patients with pneumonia versus healthy participants. These population PK models adequately described the plasma and ELF concentrations of ceftolozane and tazobactam, thus providing a foundation for further modeling and simulation, including the probability of target attainment assessments to support dose recommendations of C/T in adult patients with NP.
Keywords: ceftolozane, end‐stage renal disease, nosocomial pneumonia, pharmacokinetics/pharmacodynamics, population pharmacokinetics, tazobactam
Pneumonia, one of the most common nosocomial infections, accounts for approximately 20% of health care‐associated infections in the United States, of which >9% are associated with mechanical ventilation (ventilator‐associated pneumonia [VAP]). 1 , 2 , 3 , 4 The overall attributable mortality rate for VAP is 13%. 5 Gram‐negative bacteria, including Pseudomonas aeruginosa and Enterobacterales, are among the predominant causes of nosocomial pneumonia (NP). 2 , 6 , 7 These pathogens are often resistant to commonly used antibacterial therapies, which may complicate treatment and increase the burden on both patients and health care resources. 2 , 8 , 9 , 10 Therefore, novel antibacterial agents that are effective against resistant isolates are needed.
Ceftolozane/tazobactam (C/T) is a fixed‐dose combination antibacterial agent comprising the antipseudomonal cephalosporin ceftolozane and the established β‐lactamase inhibitor tazobactam. C/T has shown potent in vitro and in vivo activity against gram‐negative pathogens, including many strains of carbapenem‐resistant or multidrug‐resistant P. aeruginosa and extended‐spectrum β‐lactamase‐producing Enterobacterales. 11 , 12 , 13 , 14 , 15 C/T administered every 8 hours as a 1.5‐g intravenous dose (1 g ceftolozane and 0.5 g tazobactam) was approved in 2014 for the treatment of complicated urinary tract infections (cUTIs) and complicated intra‐abdominal infections (cIAIs), with renal dose adjustments based on creatinine clearance (CrCL). 16 A 3‐g dose (2 g ceftolozane and 1 g tazobactam) given intravenously every 8 hours was selected for evaluation in patients with ventilated hospital‐acquired pneumonia/VAP in a recently completed phase 3 pivotal trial (ASPECT‐NP; NCT02070757). 17 , 18 , 19 In this study, the 3‐g dose was given to patients with baseline CrCL > 50 mL/min, and lower 1.5‐g (1 g ceftolozane and 0.5 g tazobactam) and 750‐mg (500 mg ceftolozane and 250 mg tazobactam) doses were administered to patients with a CrCL of 30 to 50 and 15 to 29 mL/min, respectively. These dosages demonstrated favorable efficacy and safety profiles in adult patients with hospital‐acquired pneumonia (HAP) and VAP.
Both ceftolozane and tazobactam are predominantly cleared by the kidneys. 20 Intrinsic factors associated with potential target populations, such as renal function, body weight, and age, could influence the plasma pharmacokinetics (PK) of these drugs. 20 , 21 The presence of infection may also contribute to PK variability. In a previously conducted population PK analysis of healthy participants, patients with varying degrees of renal impairment and patients with cUTIs or cIAIs, plasma PK of both ceftolozane and tazobactam was well described by a linear 2‐compartment model with first‐order elimination. 21 Renal function estimated by CrCL was a covariate of the clearance (CL) of both drugs, whereas body weight was a covariate of the volume of distribution (Vc) of ceftolozane. The presence of infection was also a covariate and explained the variability in CL and Vc for ceftolozane and in Vc for tazobactam. 21
Alveolar compartments such as epithelial lining fluid (ELF) are considered the site of infection in patients with pneumonia; therefore, effective treatment requires that adequate antibacterial concentrations are achieved in these areas. 22 The systemic disposition of drugs and drug penetration into lung tissue could differ in patients with pneumonia compared with healthy volunteers because of inflammation and/or the presence of bacteria in the lungs. 23 Therefore, the objectives of this work were to use a PK data set that includes data from the recently completed ASPECT‐NP phase 3 study 18 , 19 and 2 phase 1 lung penetration studies (in healthy adult participants and in critically ill adult patients with confirmed or suspected pneumonia) 22 , 24 to: (1) update ceftolozane and tazobactam population PK models to describe ceftolozane and tazobactam plasma disposition in patients with HAP/VAP 21 ; (2) describe the ELF disposition of both agents in patients with HAP/VAP; and (3) evaluate the impact of pneumonia and other factors that contribute to the observed ceftolozane and tazobactam PK variability in adult patients with HAP/VAP.
Methods
Data Sources
Population PK analyses were performed using data from a total of 16 completed clinical trials (11 phase 1, 2 phase 2, and 3 phase 3 studies; Supplemental Table S1). All study protocols were reviewed and approved by the respective institutional review boards for each study (Supplemental Table S2), and each was conducted in accordance with Good Clinical Practice guidelines, the Declaration of Helsinki, and other local regulations.
Study participants received different dosing regimens of ceftolozane and/or tazobactam depending on the objectives of each clinical trial; dosing was 0.25 to 3.0 g for ceftolozane and 0.25 to 1.5 g for tazobactam. Ceftolozane was administered alone, or in combination with tazobactam as a single 1‐hour intravenous infusion or multiple intravenous infusions every 6, 8, 12, or 24 hours. Similarly, tazobactam was administered alone or in combination with ceftolozane as a single 1‐hour intravenous infusion. Ceftolozane and tazobactam concentrations in plasma and ELF samples were determined using validated liquid chromatography‐mass spectrometry assays. 21 , 25 Samples with missing concentration data (<0.15%) were excluded from the analysis. Concentrations deemed aberrant on visual checks or those associated with conditional weighted residuals (CWRES) with interaction ≥ 6 were identified as potential outliers and excluded. The final plasma data set contained 8330 observations from 968 participants for ceftolozane and 5679 observations from 835 participants for tazobactam. Of these, 1481 and 1455 ceftolozane and tazobactam plasma observations, respectively, were obtained from 305 adult patients participating in the ASPECT‐NP study (MK7625A‐008, Supplemental Table S1). ELF data were obtained from 2 phase 1 studies: 1 study was conducted in healthy volunteers (CXA‐ELF‐10‐03) 22 and the other in critically ill patients with confirmed or suspected pneumonia (CXA‐ICU‐14‐01). 24 In addition to plasma samples, these 2 studies collected bronchoalveolar lavage samples to measure ceftolozane and tazobactam concentrations in ELF from each patient at 1 of 5 predefined times (1, 2, 4, 6, or 8 hours after the start of infusion). In total, the ELF data set contained 47 observations from 47 participants for ceftolozane and 42 observations from 42 participants for tazobactam. A brief description of each completed study and the respective drug administration and PK sampling schemes is provided in Supplemental Table S1.
Methodology
All exploratory data analyses were performed using SAS software (version 9.4; SAS Institute, Inc., Cary, North Carolina), KIWI software (version 2; Cognigen Corporation, Buffalo, New York), and Perl‐speaks‐NONMEM software (version 4.4.0; Uppsala University, Uppsala, Sweden). Models were developed using NONMEM software (version 7.3.0; ICON Development Solution, North Wales, Pennsylvania). Model evaluation criteria included successful model convergence, reasonable parameter estimates with adequate precision, typical goodness‐of‐fit (GOF) diagnostic plots, and other diagnostics such as η‐shrinkage and simulation‐based visual predictive checks (VPCs) where appropriate. 26
Population PK Modeling of Ceftolozane and Tazobactam in Plasma
A 2‐compartment model with first‐order elimination that was developed in a previous analysis for another indication 21 was selected as the base structural model for both ceftolozane and tazobactam. Interindividual variability (IIV) was modeled as log‐normal in model parameters, and residual variability was modeled with a proportional variance model. The correlation between covariates was examined in an exploratory analysis before covariate analysis to avoid potential multicollinearity. Body weight, race, infection type, and renal function were selected for covariate analysis. Because each individual race category other than white or Japanese represented <10% of the overall population, race was categorized as white, Japanese, or other. Infection type comprised cUTI, cIAI, pneumonia, and other infection. The patients categorized as “other infection” were from the augmented renal clearance cohort of study MK‐7625A‐007 (Supplemental Table S1), in which CrCL was calculated using the Cockcroft‐Gault equation. Although other infections comprised 1.0% of the overall population, this covariate was retained for assessment, as it represented a separate pathological state. Only 1 covariate was selected for evaluation when multiple covariates were found to be highly correlated (r > 0.6), based on its likelihood of physiological plausibility or the degree of correlation from univariate analyses.
Covariate analysis was performed using a forward selection, backward elimination approach. During the forward selection step, covariates resulting in a statistically significant decrease (α = 0.01 for the χ2 distribution) in the objective function value (OFV) and a ≥5% reduction in IIV in the parameter of interest were added sequentially. In the backward elimination process, nonsignificant covariates were removed one at a time, which was repeated until all remaining covariates were significant (defined as a change in the OFV; α = 0.001 for the χ2 distribution when removed from the model). The resultant multivariable model with all significant covariates was then refined and evaluated for any remaining biases in the IIV and residual variability error models. Plots relating the remaining unexplained variability in each parameter versus each covariate were constructed to ensure no remaining trends. We also explored alternative additive and proportional residual error models.
Previously, ceftolozane and tazobactam pharmacokinetics were evaluated in 6 patients with end‐stage renal disease (ESRD) who received C/T during and after hemodialysis (HD), and the population PK modeling results were presented. 27 The PK data included in this analysis were collected when the patients received C/T after HD. During the model refinement step, it was determined that the continuous function describing the relationship of CL and CrCL was not sufficient to adequately characterize the PK of ceftolozane and tazobactam in these 6 ESRD patients. Therefore, an additional effect of ESRD on ceftolozane and tazobactam CL and Vc as a categorical covariate was included. The effects of HD during an HD session were not reevaluated in the current study, assuming that if plasma PK was described equally well in both models, the effect of HD would remain unchanged.
We evaluated the adequacy of the final model using VPC or prediction‐corrected VPC methodology. 28 Using NONMEM, the final model was used to simulate enough replicates of the analysis data set to achieve ≥ 1000 participants overall, or 1000 participants per stratum when the VPC was stratified by renal function status. Statistics of interest were calculated from the simulated and observed concentration data sets (5th, 50th [median], and 95th percentile distributions) and plotted versus time to assess visually the concordance between both sets. Percentages of observed data falling above or below the simulation‐based prediction interval were calculated.
Population PK Modeling of Ceftolozane and Tazobactam in ELF
The components of the population PK models describing ceftolozane and tazobactam disposition in ELF were informed by ELF concentration‐time profiles from 2 phase 1 intrapulmonary PK studies (discussed above and in Supplemental Table S1). The ELF components of the models were combined with the plasma components of the models to fit simultaneously available plasma and ELF data. When the ELF‐plasma model was developed, the data from ASPECT‐NP were not available. Therefore, the plasma component was informed by the pooled PK data without the phase 3 studies (MK‐7625A‐013, MK‐7625A‐014, and MK‐7625A‐008). The model structure for the plasma component was consistent with the final plasma model described above (data not shown). Three ELF structural models (Supplemental Figure S1) were evaluated to describe drug disposition in ELF. Model 1 assumed instantaneous equilibrium between the plasma and ELF compartments and included a partition coefficient parameter. Model 2 assumed an ELF compartment with mass transfer between the plasma and ELF compartments, and model 3 was a hypothetical link model without mass transfer and assumed an influx rate constant from plasma‐to‐ELF compartments (K1E), an elimination rate constant from the ELF compartment (KE0), and that V3 was equal to V1. An exploratory data analysis suggested that plasma and ELF data were more variable in critically ill patients with confirmed or suspected pneumonia compared with healthy participants. 22 , 24 As a result, the base structural models for ceftolozane and tazobactam were refined further by estimating IIV with K1E separately for healthy participants and patients with pneumonia. We evaluated predictive performance of the final ELF models using a simulation‐based VPC method. In addition, the percentages of observed data falling below or above the simulation‐based prediction interval were calculated.
Results
Characteristics of Analysis Population
In this analysis, previously developed adult plasma PK models 21 were refined using an expanded data set of 16 clinical studies, including studies with data from adult patients with pneumonia. The final adult ceftolozane plasma data set included 277 healthy participants (28.6%), 176 patients with cUTI (18.2%), 174 patients with cIAI (18.0%), 331 patients with pneumonia (34.2%), and 10 patients with other infections (1.0%; MK‐7625A‐007, group 2; Table 1 and see Supplemental Table S1 for study description). The final tazobactam plasma data set that includes demographic data, infection type, and renal function estimated as CrCL (calculated using the Cockcroft‐Gault formula 29 ) is summarized in Table 1.
Table 1.
Summary of Baseline Demographic Characteristics of Participants Included in the Population Pharmacokinetic Analysis Data Set of 16 Studies
| Ceftolozane (n = 968) | Tazobactam (n = 835) | |||
|---|---|---|---|---|
| Baseline Characteristic | Overall Population (n = 968) | ASPECT‐NP (n = 305) | Overall Population (n = 835) | ASPECT‐NP (n = 305) |
| Age, years | ||||
| Mean (SD) | 53.2 (19.7) | 59.8 (16.6) | 53.9 (19.6) | 59.8 (16.6) |
| Range | 18.0–98.0 | 18.0–98.0 | 18.0–98.0 | 18.0–98.0 |
| Body weight, kg | ||||
| Mean (SD) | 74.7 (17.8) | 81.5 (17.4) | 74.5 (18.0) | 81.4 (17.4) |
| Range | 33.5–173.0 | 42.0–150.1 | 33.5–150.1 | 42.0–150.1 |
| CrCL, mL/min | ||||
| Mean (SD) | 109.9 (56.7) | 124.1 (70.3) | 111.9 (59.5) | 124.1 (70.3) |
| Range | 6.3–531.3 | 14.9–531.3 | 6.3–531.3 | 14.9–531.3 |
| CrCL clinical cutoffs (central lab), n (%) | ||||
| >50 mL/min | 884 (91.3) | 269 (88.2) | 751 (89.9) | 269 (88.2) |
| 30 to 50 mL/min | 60 (6.2) | 25 (8.2) | 60 (7.2) | 25 (8.2) |
| 15 to 29 mL/min | 17 (1.8) | 10 (3.3) | 17 (2.0) | 10 (3.3) |
| <15 mL/min | 7 (0.7) | 1 (0.3) | 7 (0.8) | 1 (0.3) |
| Infection, n (%) | ||||
| Healthy a | 277 (28.6) | 0 (0.0) | 217 (26.0) | 0 (0.0) |
| cUTI | 176 (18.2) | 0 (0.0) | 103 (12.3) | 0 (0.0) |
| cIAI | 174 (18.0) | 0 (0.0) | 174 (20.8) | 0 (0.0) |
| Pneumonia | 331 (34.2) | 305 (100.0) | 331 (39.6) | 305 (100.0) |
| Other infection | 10 (1.0) | 0 (0) | 10 (1.2) | 0 (0.0) |
| Race, n (%) | ||||
| White | 640 (66.1) | 258 (84.6) | 520 (62.3) | 258 (84.6) |
| Japanese | 210 (21.7) | 0 (0.0) | 210 (25.1) | 0 (0.0) |
| Other | 118 (12.2) | 47 (15.4) | 105 (12.6) | 47 (15.4) |
| Sex, n (%) | ||||
| Male | 583 (60.2) | 226 (74.1) | 510 (61.1) | 226 (74.1) |
| Female | 385 (39.8) | 79 (25.9) | 325 (38.9) | 79 (25.9) |
cIAI, complicated intra‐abdominal infection; CrCL, creatinine clearance; cUTI, complicated urinary tract infection.
Included patients with renal impairment without infection.
As in the previous analysis, 21 postdose concentrations below the lower limit of quantitation (LLOQ) were omitted. In the current plasma data set, 5.2% of the postdose ceftolozane plasma samples and 23.3% of the postdose tazobactam plasma samples were below the LLOQ, with 0.2% of the ceftolozane plasma samples and 2.6% of the tazobactam plasma samples in the ASPECT‐NP study below the LLOQ. The ELF data comprised 1 sample from each of 51 participants who received C/T, with 47 and 42 quantifiable observations for ceftolozane and tazobactam, respectively. Among participants with ELF data, 53.2% were healthy participants, and 46.8% were critically ill patients with confirmed or suspected pneumonia.
Population PK Analysis for Ceftolozane and Tazobactam in Plasma
The previously developed population PK models for ceftolozane and tazobactam are 2‐compartment models with first‐order elimination. 21 These models were used as base structural models for analysis of the current data set and adequately described the plasma concentration‐time data for both ceftolozane and tazobactam. During the stepwise covariate analysis, the effect of baseline CrCL on CL was assessed using a power function with an estimated exponent on CL, and the effect of body weight (relative to a 70‐kg adult) was evaluated as an allometric function on Vc and volume of distribution in the peripheral compartment (Vp) parameters with an estimated exponent. Categorical covariates (ie, race and infection type) were evaluated using a proportional model on CL, Vc, and Vp.
During model refinement, the ceftolozane and tazobactam plasma models underpredicted concentrations in patients with ESRD, despite the inclusion of baseline CrCL as a covariate on CL. Therefore, we performed a sequential assessment of the inclusion of ESRD as an additional categorical covariate on CL and Vc. The inclusion of the effect of ESRD on CL improved model fitting for patients with ESRD for both agents, with good precision (relative standard error [RSE], <11.7% for ceftolozane, and <14.6% for tazobactam) and significantly reduced OFV (P < .001) for ceftolozane. Therefore, the additional effect of ESRD on CL and Vc was included in the final models for both drugs.
Identified outliers were evaluated through a sensitivity analysis. Inclusion of all outliers substantially affected many of the final parameter estimates for ceftolozane and significantly increased (by 121.2%) the correlation between IIV in CL and IIV in Vc for tazobactam. Therefore, the identified outliers were not included in the final models.
As anticipated, baseline CrCL was a significant covariate on CL for ceftolozane. In patients with ESRD, ceftolozane CL was reduced by an additional 68%, in addition to the decrease associated with reduced CrCL, compared with patients without ESRD. ESRD was also associated with 30.0% higher Vc compared with patients without ESRD. The effect of body weight was significant on Vc and Vp, with estimated exponents of 0.684 and 0.484, respectively. Types of infection were found to be significant covariates on Vc. Notably, pneumonia was associated with a 100% increase in Vc compared with healthy participants. No significant differences in the PK of ceftolozane were observed based on race.
In the final plasma PK model for ceftolozane (Table 2), all fixed‐ and random‐effect parameters were estimated with good precision (fixed effects, ≤16.3% RSE; random effects, ≤17.8% RSE) except for IIV in Vp. VPCs for ceftolozane demonstrated good agreement between the observed and predicted values in patients with pneumonia. The median, 5th, and 95th observed percentiles were generally contained within the 95% confidence interval of the predicted profiles (Figure 1, Supplemental Figure S2), and the percent of data below and above the 90% prediction interval was 5.1% and 7.5%, respectively. The agreement was consistent in groups with various renal functions, including impaired or augmented renal clearance (CrCL >150 mL/min; Figure 2, Supplemental Figure S3). GOF plots showed random distribution of residuals around zero without apparent trends with time or concentration. As with the VPC, the observed and model‐predicted concentrations were generally in good agreement (Figure 3).
Table 2.
Final Parameter Estimates and Standard Errors for the Population Pharmacokinetic Adult Plasma Models With Nosocomial Pneumonia Data for Ceftolozane and Tazobactam
| Ceftolozane | Tazobactam | |||||||
|---|---|---|---|---|---|---|---|---|
| Final Parameter Estimate | IIV a /RV | Final Parameter Estimate | IIV a /RV | |||||
| Parameter | Typical Value | %RSE | Magnitude | %RSE | Typical Value | %RSE | Magnitude | %RSE |
| CL | ||||||||
| Systemic CL, L/h | 4.84 | 1.66 | 36.1% CV | 8.19 | 16.6 | 1.80 | 53.1% CV | 11.0 |
| Exponent of (CrCL/100) for CL | 0.701 | 4.32 | 0.623 | 6.42 | ||||
| Fold‐change in CL for ESRD | 0.320 | 10.9 | 0.626 | 14.6 | ||||
| Fold‐change in CL for cUTI | 1.18 | 2.99 | — | — | ||||
| Fold‐change in CL for cIAI | 1.43 | 2.99 | — | — | ||||
| Vc | ||||||||
| Vc, L | 9.23 | 1.83 | 42.9% CV | 16.5 | 13.1 | 1.96 | 38.7% CV | 19.1 |
| Fold‐change in Vc for cUTI | 1.25 | 3.52 | — | — | ||||
| Fold‐change in Vc for cIAI | 1.59 | 4.97 | 1.49 | 3.70 | ||||
| Fold‐change in Vc for pneumonia | 2.00 | 3.29 | 2.17 | 4.46 | ||||
| Fold‐change in Vc for other infections | 2.14 | 14.8 | 2.49 | 16.5 | ||||
| Exponent of (WTKG/70) for Vc | 0.684 | 9.69 | 0.629 | 10.7 | ||||
| Fold‐change in Vc for ESRD | 1.30 | 11.7 | 0.749 | 11.0 | ||||
| Q, L/h | 3.13 b | 6.93 | NE | NA | 4.05 | 3.81 | NE | NA |
| Vp | ||||||||
| Vp, L | 4.78 b | 3.24 | 15.1% CV | 57.8 | 4.89 | 2.59 | 19.4% CV | 54.7 |
| Fold‐change in Vp for cUTI | — | — | 1.25 | 4.27 | ||||
| Fold‐change in Vp for cIAI | — | — | 1.34 | 4.57 | ||||
| Fold‐change in Vp for pneumonia | — | — | 2.06 | 8.89 | ||||
| Exponent of (WTKG/70) for Vp | 0.484 | 16.3 | 0.530 | 14.4 | ||||
| cov (IIV in Vc, IIV in CL) c | 0.073 | 17.1 | NA | NA | 0.071 | 33.3 | NA | NA |
| RV proportional | 0.025 | 7.20 |
100%‐15.7% CV d F (1‐200 μg/mL) |
NA | 0.081 | 7.09 | 28.5% CV | NA |
| RV additive | 0.010 | 17.8 | 0.099 SD d | NA | — | — | ||
| Minimum value of the objective function | 32902.3 | 11256.8 | ||||||
%RSE, relative standard error expressed as a percentage; cIAI, complicated intra‐abdominal infection; CL, clearance; cov, covariate; CrCL, creatinine clearance; cUTI, complicated urinary tract infection; CV, coefficient of variation; ESRD, end‐stage renal disease; F, individual predicted ceftolozane concentration; IIV, interindividual variability; NA, not applicable; NE, not estimated; OINF, other infection types; Q, intercompartmental clearance; RV, residual variability; Vc, volume of distribution of the central compartment; Vp, volume of distribution of the peripheral compartment; WTKG, body weight (kg).
Parameter‐covariate relationships for ceftolozane were described as:
Parameter‐covariate relationships for tazobactam were described as:
Note: Other infections included critically ill adult patients from study MK‐7625A‐007.
Eta shrinkage: eta_CL, 1.76%; eta_Vc, 9.27%; eta_Vp, 55.8%.
The following parameter estimates were found to be highly correlated (r ≥ 0.924): Vp and Q.
The calculated correlation coefficient (r) of the off‐diagonal omegas was 0.474 for cov (IIV in Vc, IIV in CL).
The RV (%CV) was calculated using the following equation: .
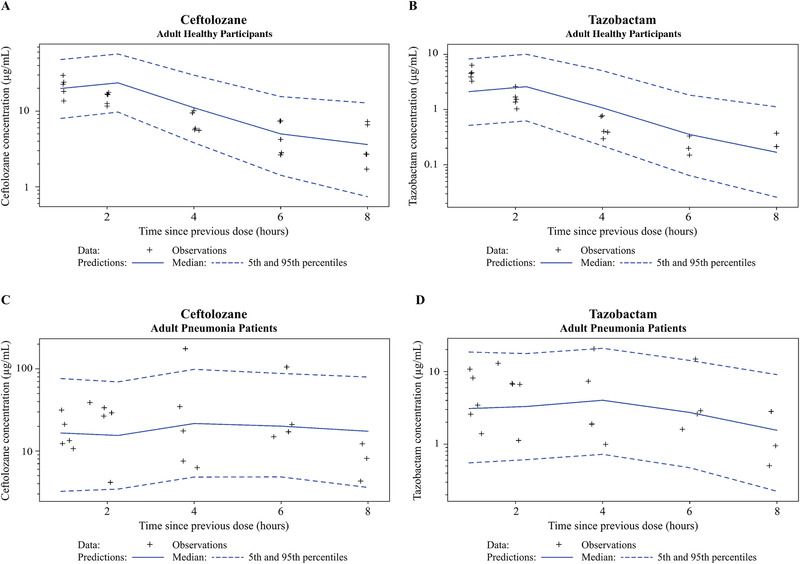
Figure 1.
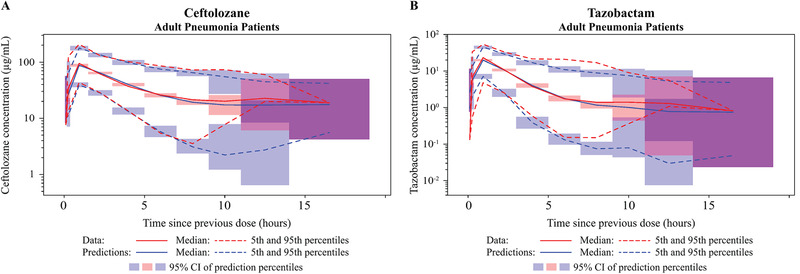
Visual predictive check (VPC) plots on logarithmic scale for the updated population plasma pharmacokinetic models for ceftolozane (A) and tazobactam (B) in adult patients with nosocomial pneumonia. CI, confidence interval.
Figure 2.
Visual predictive check (VPC) plots for the updated population plasma pharmacokinetic models on a logarithmic scale by non‐ESRD renal function groups—(A) ceftolozane; (B) tazobactam—and by ESRD renal function group—(C) ceftolozane; (D) tazobactam. Renal function groups are as indicated. CI, confidence interval; CrCL, creatinine clearance; ESRD, end‐stage renal disease.
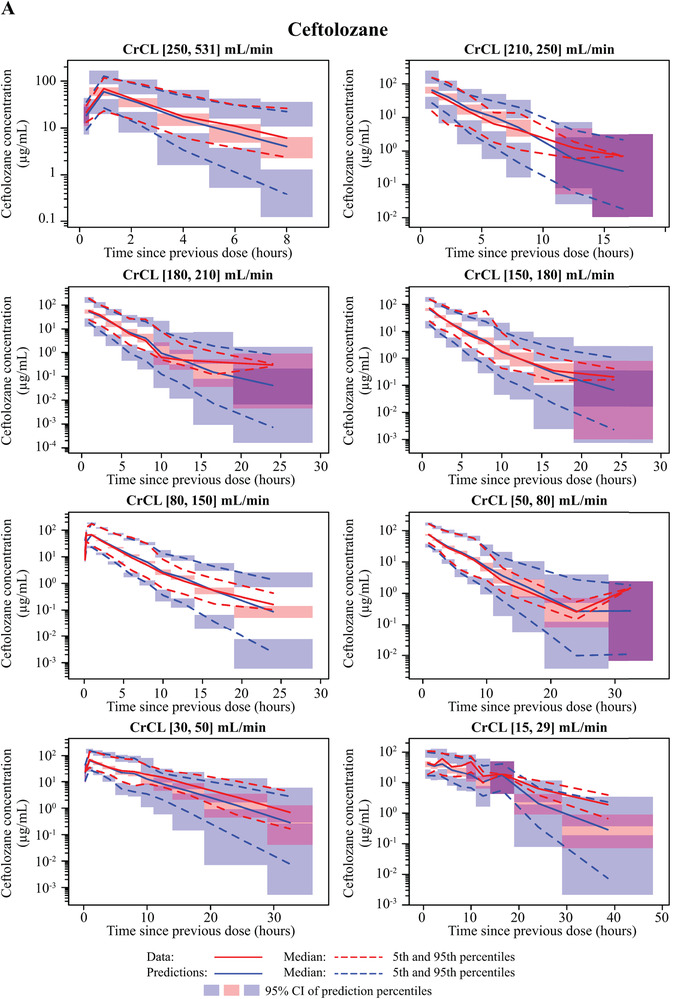
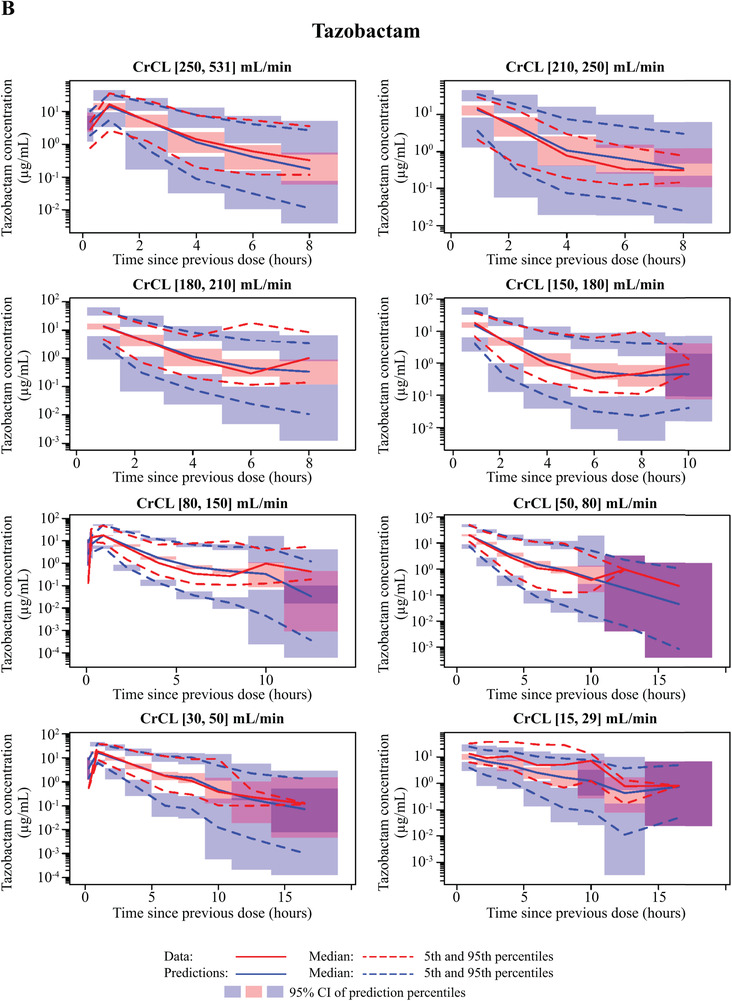
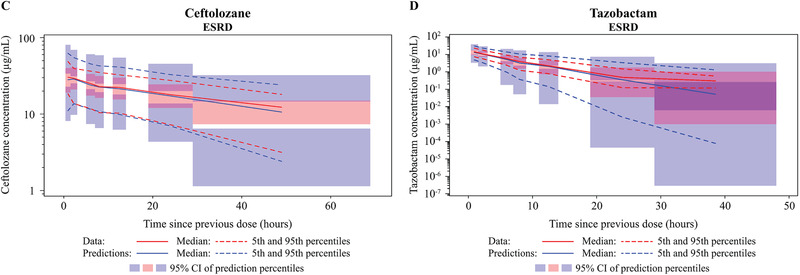
Figure 3.
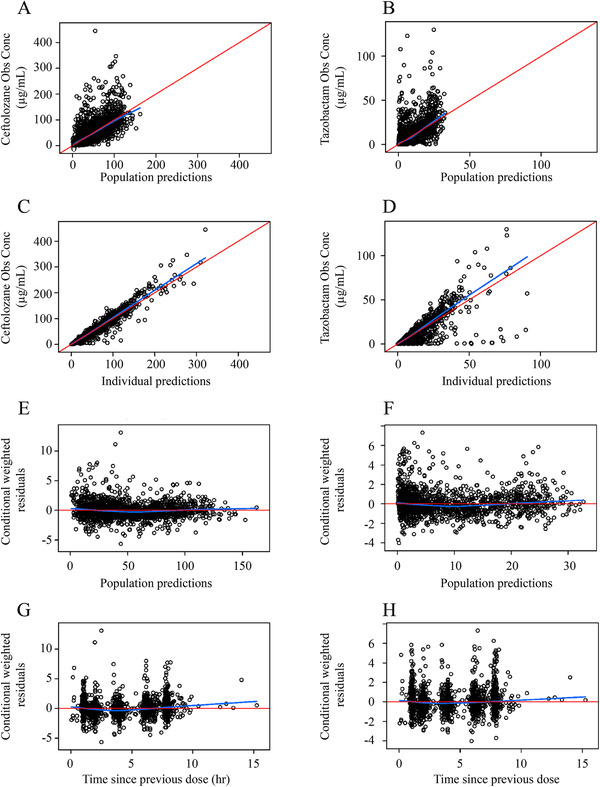
Goodness‐of‐fit plots for the updated population plasma pharmacokinetic models in adult patients with nosocomial pneumonia. Plots shown for ceftolozane and tazobactam include observations (A) versus population‐predicted concentrations (B), observations (C) versus individual predicted concentrations (D, respectively), conditional weighted residuals (E) versus population predictions (F), and conditional weighted residuals (G) versus time since previous dose (H).
As with ceftolozane, baseline CrCL was a significant covariate on CL for tazobactam (CL decreased as CrCL decreased), with an exponent of 0.623. In patients with ESRD, tazobactam CL was reduced by an additional 37.4%, in addition to the decrease associated with reduced CrCL, compared with patients without ESRD; Vc was decreased by 25.1% compared with patients without ESRD. However, ESRD did not significantly impact Vp in our analysis. Body weight also significantly affected Vc and Vp, with estimated exponents of 0.629 and 0.530, respectively. Pneumonia was a significant covariate on tazobactam Vc (117% higher vs healthy participants), whereas cUTI and cIAI were significant covariates on Vp (25% and 34% higher, respectively). No significant differences in the PK of tazobactam were observed based on race.
Similarly, all fixed‐ and random‐effect parameters were estimated with good precision in the final plasma PK model for tazobactam (≤20% RSE for fixed and random effects), except for IIV in Vp and covariance between IIV in Vc and IIV in CL (54.7% RSE and 33.3% RSE, respectively; Table 2). The VPC plot for the tazobactam model showed that the percent of observed data above and below the 90% prediction interval was 3.52% and 8.65%, respectively, in adult patients with pneumonia (Figure 1). GOF plots created for adult patients with pneumonia (Figure 3) suggested that the model fit the observed data well, with no obvious trends with time or tazobactam concentration.
Population PK Analysis for Ceftolozane and Tazobactam in ELF
We tested 3 models for ceftolozane and tazobactam in ELF (Supplemental Figure S1). Model 1, which incorporated a time‐independent partition coefficient or various forms of time‐dependent partition coefficients, resulted in poor fitting to ELF data, ill‐conditioning (condition number > 1000), or an implausible estimate for the ELF partition coefficient. Similarly, model 2, which incorporated an estimated volume of the ELF compartment with or without separate residual variance for ELF and plasma data or fixed volume of the ELF compartment, resulted in poor fitting to ELF data, a minimum of 20% change in at least 1 fixed‐effect plasma model parameter compared with that in the PK models for plasma alone, a large condition number (>1000), or a negligible estimate of residual variance for ELF. Model 3, the hypothetical link model with K1E and KE0 describing the influx and elimination from the ELF compartment, best described ELF drug concentration‐time data and was selected as the structure for ceftolozane and tazobactam ELF base models.
The estimation of separate pneumonia effects on K1E and KE0 resulted in high correlation between the pneumonia‐effect parameters on K1E and KE0 (r 2 of 0.976 for ceftolozane and of 0.842 for tazobactam), which suggests overparameterization in the model. In addition, the pneumonia effects on K1E and KE0 were in the same direction and of approximately similar magnitude. For these reasons, the effect of pneumonia on K1E and KE0 was estimated with 1 parameter explaining the pneumonia effect on both K1E and KE0 during the subsequent model development step.
For both agents, higher IIV in K1E was estimated with good precision in patients with pneumonia (Table 3) and was therefore modeled separately from the healthy participants. During the covariate analysis backward elimination step, pneumonia was found to be a significant predictor (P < .05) for K1E and KE0 for ceftolozane but not tazobactam; however, the effect of pneumonia on K1E and KE0 for tazobactam was retained based on the observed delayed ELF maximum plasma concentration (2 hours) compared with healthy participants (1 hour). 22 , 24
Table 3.
Parameter Estimates and Standard Errors of the Ceftolozane and Tazobactam Population Pharmacokinetic Model for ELF Data
| Ceftolozane | Tazobactam | |||||||
|---|---|---|---|---|---|---|---|---|
| Final Parameter Estimate | IIV/RV | Final Parameter Estimate | IIV/RV | |||||
| Parameter | Typical Value | %RSE | Magnitude | %RSE | Typical Value | %RSE | Magnitude | %RSE |
| K1E, rate constant for disposition from plasma to ELF (/h) | 0.808 | 11.6 |
39.6% CV a 81.2% CV b |
28.1 a 46.0 b |
0.262 c | 30.6 | 65.5% CV a 84.4% CV b |
23.9 a 34.5 b |
| KEO, rate constant for elimination from ELF (/h) | 1.56 | 8.97 | NE | NA | 0.691 c | 25.1 | NE | NA |
| Pneumonia on K1E and KEO (proportional) | 0.034 | 44.0 | NA | NA | 0.479 | 44.0 | NA | NA |
| RV proportional | 0.025 | 12.7 | 92.7%‐15.8% CV d | NA | 0.055 | 12.3 | 23.4% CV | NA |
| RV additive | 0.008 | 21.4 | F (0.1‐100 μg/mL) | — | — | |||
| Minimum value of the objective function | 20934.2 | 5258.2 | ||||||
%RSE, relative standard error expressed as a percentage; cov, covariate; CV, coefficient of variation; ELF, epithelial lining fluid; F, individual predicted ceftolozane concentration; IIV, interindividual variability; K1E, rate constant for disposition from plasma to ELF; KE0, rate constant for elimination from ELF; NA, not applicable; NE, not estimated; RV, residual variability.
Parameter‐covariate relationships for ceftolozane were described as:
TVK1E = 0.808 × 0.0339Pneu
TVKE0 = 1.56 × 0.0339Pneu
Parameter‐covariate relationships for tazobactam were described as:
TVK1E = 0.262 × 0.479Pneu
TVKE0 = 0.691 × 0.479Pneu
Healthy participants.
Patients with pneumonia.
The following parameter estimates were found to be highly correlated (r 2 ≥ 0.810): K1E and KE0.
The RV (%CV) for ceftolozane was calculated using the following equation: .
The final ceftolozane and tazobactam ELF disposition models were the plasma models described above with a hypothetical ELF compartment linked to the plasma compartment. Final estimates of the typical values of K1E and KE0 were 0.808/h and 1.56/h, respectively, for ceftolozane and 0.262/h and 0.691/h, respectively, for tazobactam (Table 3). All fixed‐ and random‐effect parameters were estimated with good precision, except for the pneumonia effect on K1E and KE0 (44% RSE for both ceftolozane and tazobactam). For the ELF data, GOF plots showed symmetric distribution of residuals around 0, with CWRES distributed within a range of –2 to 3 for ceftolozane and –1 to 2 for tazobactam. Model‐predicted concentrations were in good agreement with the observed concentrations (Figures 4 and 5).
Figure 4.
Visual predictive check (VPC) plots for the epithelial lining fluid (ELF) population pharmacokinetic models for ceftolozane and tazobactam on a logarithmic scale. Plots shown include healthy participants—ceftolozane (A), tazobactam (B)—and adult patients with pneumonia—ceftolozane (C), tazobactam (D). CI, confidence interval.
Figure 5.
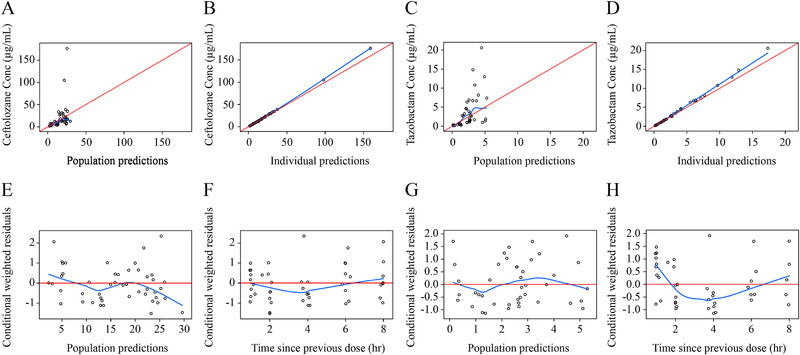
Goodness‐of‐fit plots for the epithelial lining fluid (ELF) population pharmacokinetic models for ceftolozane (left side) and tazobactam (right side). Plots shown include observations versus population‐predicted concentrations for ceftolozane (A) and tazobactam (C), observations versus individual predicted concentrations for ceftolozane (B) and tazobactam (D), conditional weighted residuals versus population predictions for ceftolozane (E) and tazobactam (G), and conditional weighted residuals versus time since previous dose for ceftolozane (F) and tazobactam (H).
Discussion
This report describes the population PK of ceftolozane and tazobactam in plasma and ELF of patients with pneumonia, including those with varying degrees of renal function. This analysis expanded on initial population PK models focused on patients with cUTI/cIAI. 21 The recent completion of the phase 3 pivotal ASPECT‐NP trial allowed for expansion of the data set and further model refinement of plasma profiles for ceftolozane and tazobactam in adults, as well as for a robust assessment of the impact of pneumonia on the PK of ceftolozane and tazobactam in adult plasma. In addition, the inclusion of 2 phase 1 studies that collected ELF and plasma samples from both healthy participants and critically ill patients with confirmed or suspected pneumonia allowed for an analysis of factors that could contribute to the plasma‐to‐ELF ratios reported in previous population PK analyses. 17 , 22 , 30 , 31
An analysis describing the population PK of ceftolozane and tazobactam was previously conducted in healthy participants and patients with cUTI and cIAI. 21 However, the presence of bacterial infection or inflammation in the lungs may alter the systemic disposition of drugs, as well as drug penetration into lung tissue. 23 Consistent with the previous analyses, 21 a 2‐compartment model with first‐order elimination best described the plasma concentration‐time data for both ceftolozane and tazobactam, with modest IIV on CL and Vc for both drugs. We confirmed the robustness of the developed models by VPC diagnostics and GOF plots. All fixed‐ and random‐effect parameters were estimated precisely, with the exception of the IIV on Vp (57.8% RSE for ceftolozane and 54.7% RSE for tazobactam), which may be because of the presence of sparse data from phase 2 and phase 3 studies.
In the expanded adult plasma PK models with pneumonia data included, the estimates of typical values and between‐patient variability for PK parameters (CL, Vc, Vp, and intercompartmental CL) were generally comparable to those in the previously developed plasma PK models. 21 As anticipated, CrCL was a significant covariate on CL, with estimated exponents of 0.701 for ceftolozane and 0.623 for tazobactam. These relationships are consistent with both agents being primarily eliminated via renal excretion and CL expected to decrease with increasing impairment of renal function. 20 It is noted that in the ASPECT‐NP study, extracorporeal membrane oxygenation (ECMO) was not prohibited. However, data on ECMO use was not required to be collected and therefore was not incorporated into the analysis. As ECMO could contribute to loss of creatinine, this could potentially add to the uncertainty of CL estimates for ceftolozane and tazobactam. In contrast to the previously developed models, body weight was not independently identified as a significant covariate on CL for ceftolozane or tazobactam, which is likely because body weight was partially accounted for in the Cockcroft‐Gault equation for CrCL. Race was not a significant covariate on ceftolozane or tazobactam PK parameters, consistent with the previously developed models. 21
In addition to the effect of CrCL on the CL of ceftolozane and tazobactam, the effect of ESRD was required as an additional covariate on CL and Vc for both agents to adequately describe the plasma PK following administration of C/T in patients with ESRD. When factoring in both the covariate effects of CrCL and ESRD, the models estimated the CL of ceftolozane and tazobactam to be 68.0% and 37.4% lower, respectively, in patients with ESRD compared with healthy participants. In addition, the estimated Vc of ceftolozane was 30.0% higher and the Vc of tazobactam was 25.1% lower in patients with ESRD compared with healthy participants. The effect of ESRD on CL and Vc was not unexpected, as the Cockcroft‐Gault equation may overestimate CrCL in ESRD, 32 and other underlying pathophysiological changes associated with severe renal impairment have been reported to alter drug distribution volume. 33 However, we do not have a physiological or pathophysiological explanation for the difference in the direction of volume change (with increased ceftolozane and decreased tazobactam) for the 2 drugs.
In the United States, NP continues to be the most common hospital‐acquired infection. 3 , 4 Although significant efforts have been made to develop novel β‐lactam/β‐lactamase inhibitor combinations to treat patients with NP, to our knowledge, the impact of pneumonia on the population PK of β‐lactam/β‐lactamase inhibitor combinations has only been reported in 1 other publication. 34 In our final ceftolozane and tazobactam plasma population PK models, pneumonia did not significantly influence ceftolozane or tazobactam CL. In contrast, compared with healthy participants, ceftolozane and tazobactam Vc (100% and 117%, respectively) and tazobactam Vp (106%) were higher in patients with pneumonia. The effects of pneumonia on ceftolozane and tazobactam PK parameters were consistent with the effects of severe infection/sepsis on the PK of other β‐lactams. 35 Consistent with our covariate analysis, a recent publication on the β‐lactam/β‐lactamase inhibitor combination ceftazidime and avibactam demonstrated that pneumonia was a clinically relevant covariate on Vc, but not on CL, for both agents. This was not unexpected because the pathogenesis of infection and mechanical ventilation, among other factors, likely leads to expanded distribution of hydrophilic β‐lactams and β‐lactamase inhibitors. 36 The increased volumes of distribution are expected to result in a lower maximum plasma concentration. It is well established that the percent of time that unbound drug concentrations are above the minimum inhibitory concentration (%fT>MIC) best predicts antibacterial activity for β‐lactams, whereas the percent unbound drug area under the concentration‐time curve relative to MIC or %fT above a threshold concentration has been reported as the PK/PD index for β‐lactamase inhibitors. 37 , 38 Therefore, the exact effect of pneumonia on the expected activity of β‐lactam/β‐lactamase inhibitor combinations will need to be determined on a case‐by‐case basis.
The hypothetical link compartment models adequately described ceftolozane and tazobactam plasma and ELF data simultaneously. The link models assumed that the amount of drug transferred to the ELF compartment did not affect plasma disposition. 39 This assumption seemed to work reasonably with previously observed ceftolozane and tazobactam lung penetration ratios of 50% and 62%, respectively. 24 In addition, the current models described the plasma and ELF data adequately with no obvious biases observed.
β‐Lactams demonstrate varying degrees of lung penetration, which may differ between healthy participants and patients with pneumonia. 40 Our analysis indicated that the typical values from plasma to ELF (K1E) and ELF elimination (KE0) were 0.808/h and 1.56/h, respectively, for ceftolozane, and 0.262/h and 0.691/h, respectively, for tazobactam. These values are approximately 97% and 52% lower for ceftolozane and tazobactam, respectively, in patients with pneumonia compared with healthy participants. A large IIV for both agents was also observed in K1E among patients with pneumonia. The IIV in K1E for ceftolozane and tazobactam in patients with pneumonia was 81.2% and 84.4% CV, respectively, compared with 39.6% and 65.5% CV in healthy participants. This may largely be a result of the limited ELF data from a small number of patients (1 ELF sample per patient for 22 patients) in the analysis. Therefore, IIV in K1E and its representation to the true between‐patient variability in lung penetration of ceftolozane and tazobactam should be interpreted with caution.
This analysis has some limitations. First, several assumptions were made on the normality of random effects and the structure of variance. 41 In addition, covariates were assumed to remain at their baseline values. This assumption would be reasonable for most covariates assessed in this analysis, such as race and infection type, but may not always be appropriate for CrCL in patients whose renal function may undergo significant changes over the course of treatment. Finally, ESRD patients were excluded in ASPECT‐NP, and the effect of ESRD on CL and Vc was established based on limited information from 6 participants.
Conclusions
This analysis expanded the previously available population plasma PK models of ceftolozane and tazobactam 21 , 27 and characterized the disposition of both agents in plasma and ELF to understand the impact of pneumonia on plasma and ELF PK parameters. We found that 2‐compartment linear models with zero‐order input and first‐order elimination appropriately described the concentration‐time profiles for ceftolozane and tazobactam across infection types and renal function groups. Renal function, measured by baseline CrCL, was a significant predictor of the CL for ceftolozane and tazobactam, and body weight was a significant covariate on volume of distribution. Although infection type remained a significant predictor of ceftolozane and tazobactam PK, pneumonia was not identified as a significant predictor of ceftolozane or tazobactam CL; Vc for ceftolozane, Vc for tazobactam, and Vp for tazobactam were 100%, 117%, and 106% higher, respectively, in patients with pneumonia compared with healthy participants. A hypothetical link compartment model in which drug disposition between the plasma and ELF compartments was described using an influx rate constant for the hypothetical mass transfer from the plasma compartment to the ELF compartment (K1E) and an elimination rate constant from the ELF compartment (KE0) well‐characterized ELF disposition of ceftolozane and tazobactam. Lower K1E and KE0 and higher IIV in patients with pneumonia versus healthy participants were also observed. These models appropriately described the observed plasma and ELF profiles in patients and are considered to be appropriate for stochastic simulations. These models facilitated subsequent PK/PD analyses to support the appropriateness of the C/T 3‐g dose given every 8 hours for adult patients with NP.
Conflicts of Interest
H.‐P.F., C.J.B., and W.G. are current employees of MSD and may own stock and/or hold stock options in the company. Z.Z. was an employee of MSD at the time the study was conducted. Y.T.P. and J.F.K. are employees of Cognigen Corporation, which was compensated by MSD for the analyses performed.
Funding
Funding for this research was provided by MSD.
Data‐Sharing Statement
The data‐sharing policy, including restrictions, of Merck Sharp & Dohme Corp., a subsidiary of Merck & Co., Inc., Kenilworth, New Jersey, is available at http://engagezone.msd.com/ds_documentation.php. Requests for access to the clinical study data can be submitted through the EngageZone site or via email to dataaccess@merck.com.
Supporting information
Supplemental Information
Supplemental Information
Supplemental Information
Supplemental Information
Supplemental Information
Acknowledgments
The authors thank Elizabeth Rhee, MD, for her valuable clinical and scientific insight. Medical writing and/or editorial assistance was provided by Rebecca Brady, PhD, and Alanna Kennedy, PhD, CMPP, of The Lockwood Group, Stamford, Connecticut. This assistance was funded by Merck Sharp & Dohme Corp., a subsidiary of Merck & Co., Inc., Kenilworth, New Jersey (MSD).
All authors are responsible for the work described in this article. All authors were involved in at least one of the following: (conception, design of work or acquisition, analysis, interpretation of data) and (drafting the article and/or revising/reviewing the article for important intellectual content). All authors provided final approval of the version to be published. All authors agree to be accountable for all aspects of the work in ensuring that questions related to the accuracy or integrity of any part of the work are appropriately investigated and resolved.
References
- 1. Wang Y, Eldridge N, Metersky ML, et al. National trends in patient safety for four common conditions, 2005‐2011. N Engl J Med. 2014;370(4):341‐351. [DOI] [PMC free article] [PubMed] [Google Scholar]
- 2. Sievert DM, Ricks P, Edwards JR, et al. Antimicrobial‐resistant pathogens associated with healthcare‐associated infections: summary of data reported to the National Healthcare Safety Network at the Centers for Disease Control and Prevention, 2009‐2010. Infect Control Hosp Epidemiol. 2013;34(1):1‐14. [DOI] [PubMed] [Google Scholar]
- 3. Magill SS, Edwards JR, Bamberg W, et al. Multistate point‐prevalence survey of health care‐associated infections. N Engl J Med. 2014;370(13):1198‐1208. [DOI] [PMC free article] [PubMed] [Google Scholar]
- 4. Magill SS, O'Leary E, Janelle SJ, et al. Changes in prevalence of health care‐associated infections in U.S. hospitals. N Engl J Med. 2018;379(18):1732‐1744. [DOI] [PMC free article] [PubMed] [Google Scholar]
- 5. Melsen WG, Rovers MM, Groenwold RHH, et al. Attributable mortality of ventilator‐associated pneumonia: a meta‐analysis of individual patient data from randomised prevention studies. Lancet Infect Dis. 2013;13(8):665‐671. [DOI] [PubMed] [Google Scholar]
- 6. Jones RN. Microbial etiologies of hospital‐acquired bacterial pneumonia and ventilator‐associated bacterial pneumonia. Clin Infect Dis. 2010;51(suppl 1):S81‐S87. [DOI] [PubMed] [Google Scholar]
- 7. Weiner LM, Webb AK, Limbago B, et al. Antimicrobial‐resistant pathogens associated with healthcare‐associated infections: summary of data reported to the National Healthcare Safety Network at the Centers for Disease Control and Prevention, 2011‐2014. Infect Control Hosp Epidemiol. 2016;37(11):1288‐1301. [DOI] [PMC free article] [PubMed] [Google Scholar]
- 8. Maslikowska JA, Walker SA, Elligsen M, et al. Impact of infection with extended‐spectrum β‐lactamase‐producing Escherichia coli or Klebsiella species on outcome and hospitalization costs. J Hosp Infect. 2016;92(1):33‐41. [DOI] [PubMed] [Google Scholar]
- 9. Nathwani D, Raman G, Sulham K, Gavaghan M, Menon V. Clinical and economic consequences of hospital‐acquired resistant and multidrug‐resistant Pseudomonas aeruginosa infections: a systematic review and meta‐analysis. Antimicrob Resist Infect Control. 2014;3(1):32. [DOI] [PMC free article] [PubMed] [Google Scholar]
- 10. Parker CM, Kutsogiannis J, Muscedere J, et al. Ventilator‐associated pneumonia caused by multidrug‐resistant organisms or Pseudomonas aeruginosa: prevalence, incidence, risk factors, and outcomes. J Crit Care. 2008;23(1):18‐26. [DOI] [PubMed] [Google Scholar]
- 11. Castanheira M, Duncan LR, Mendes RE, Sader HS, Shortridge D. Activity of ceftolozane‐tazobactam against Pseudomonas aeruginosa and Enterobacteriaceae isolates collected from respiratory tract specimens of hospitalized patients in the United States during 2013 to 2015. Antimicrob Agents Chemother. 2018;62(3):e0212517. [DOI] [PMC free article] [PubMed] [Google Scholar]
- 12. Craig WA, Andes DR. In vivo activities of ceftolozane, a new cephalosporin, with and without tazobactam against Pseudomonas aeruginosa and Enterobacteriaceae, including strains with extended‐spectrum β‐lactamases, in the thighs of neutropenic mice. Antimicrob Agents Chemother. 2013;57(4):1577‐1582. [DOI] [PMC free article] [PubMed] [Google Scholar]
- 13. Jacqueline C, Roquilly A, Desessard C, et al. Efficacy of ceftolozane in a murine model of Pseudomonas aeruginosa acute pneumonia: in vivo antimicrobial activity and impact on host inflammatory response. J Antimicrob Chemother. 2013;68(1):177‐183. [DOI] [PubMed] [Google Scholar]
- 14. Pfaller MA, Bassetti M, Duncan LR, Castanheira M. Ceftolozane/tazobactam activity against drug‐resistant Enterobacteriaceae and Pseudomonas aeruginosa causing urinary tract and intraabdominal infections in Europe: report from an antimicrobial surveillance programme (2012‐15). J Antimicrob Chemother. 2017;72(5):1386‐1395. [DOI] [PubMed] [Google Scholar]
- 15. Shortridge D, Castanheira M, Pfaller MA, Flamm RK. Ceftolozane‐tazobactam activity against Pseudomonas aeruginosa clinical isolates from U.S. hospitals: report from the PACTS Antimicrobial Surveillance Program, 2012 to 2015. Antimicrob Agents Chemother. 2017;61(7):e0046517. [DOI] [PMC free article] [PubMed] [Google Scholar]
- 16. ZERBAXA (ceftolozane and tazobactam): Prescribing information. Merck Sharp & Dohme Corp.,Whitehouse Station, NJ, USA; 2019. [Google Scholar]
- 17. Xiao AJ, Miller BW, Huntington JA, Nicolau DP. Ceftolozane/tazobactam pharmacokinetic/pharmacodynamic‐derived dose justification for phase 3 studies in patients with nosocomial pneumonia. J Clin Pharmacol. 2016;56(1):56‐66. [DOI] [PMC free article] [PubMed] [Google Scholar]
- 18. Kollef M, Nováček M, Ü Kivistik, et al. ASPECT‐NP: A randomized, double‐blind, Phase 3 trial comparing efficacy and safety of Ceftolozane/Tazobactam vs Meropenem in patients with ventilated nosocomial pneumonia. Presented at: 29th European Congress for Clinical Microbiology and Infectious Diseases (ECCMID); April 13‐16, 2019; Amsterdam, Netherlands. [Google Scholar]
- 19. Kollef MH, Nováček M, Ü Kivistik, et al. Ceftolozane‐tazobactam versus meropenem for treatment of nosocomial pneumonia (ASPECT‐NP): a randomised, controlled, double‐blind, phase 3, non‐inferiority trial. Lancet Infect Dis. 2019;19(12):1299‐1311. [DOI] [PubMed] [Google Scholar]
- 20. Miller B, Hershberger E, Benziger D, Trinh M, Friedland I. Pharmacokinetics and safety of intravenous ceftolozane‐tazobactam in healthy adult subjects following single and multiple ascending doses. Antimicrob Agents Chemother. 2012;56(6):3086‐3091. [DOI] [PMC free article] [PubMed] [Google Scholar]
- 21. Chandorkar G, Xiao A, Mouksassi MS, Hershberger E, Krishna G. Population pharmacokinetics of ceftolozane/tazobactam in healthy volunteers, subjects with varying degrees of renal function and patients with bacterial infections. J Clin Pharmacol. 2015;55(2):230‐239. [DOI] [PMC free article] [PubMed] [Google Scholar]
- 22. Chandorkar G, Huntington JA, Gotfried MH, Rodvold KA, Umeh O. Intrapulmonary penetration of ceftolozane/tazobactam and piperacillin/tazobactam in healthy adult subjects. J Antimicrob Chemother. 2012;67(10):2463‐2469. [DOI] [PubMed] [Google Scholar]
- 23. Roberts JA, Abdul‐Aziz MH, Lipman J, et al. Individualised antibiotic dosing for patients who are critically ill: challenges and potential solutions. Lancet Infect Dis. 2014;14(6):498‐509. [DOI] [PMC free article] [PubMed] [Google Scholar]
- 24. Caro L, Nicolau DP, De Waele J, et al. Lung penetration, bronchopulmonary pharmacokinetic/pharmacodynamic profile, and safety of 3 g ceftolozane/tazobactam administered to ventilated, critically ill patients with pneumonia. J Antimicrob Chemother. 2020;75(6):1546‐1553. [DOI] [PMC free article] [PubMed] [Google Scholar]
- 25. Larson KB, Patel YT, Willavize S, et al. Ceftolozane‐tazobactam population pharmacokinetics and dose selection for further clinical evaluation in pediatric patients with complicated urinary tract or complicated intra‐abdominal infections. Antimicrob Agents Chemother. 2019;63(6):e0257818. [DOI] [PMC free article] [PubMed] [Google Scholar]
- 26. Holford N. The visual predictive check: superiority to standard diagnostic (Rorschach) plots. Presented at: Populations Approach Group in Europe (PAGE); June 16‐17, 2005; Pamplona, Spain. [Google Scholar]
- 27. Xiao A, Chandorkar G, Hershberger E, Krishna G. Ceftolozane/Tazobactam dose optimization in patients with end‐stage renal disease requiring hemodialysis using population pharmacokinetics and Monte Carlo simulations. Presented at: IDWeek; October 8‐12, 2014; Philadelphia, PA. [Google Scholar]
- 28. Bergstrand M, Hooker AC, Wallin JE, Karlsson MO. Prediction‐corrected visual predictive checks for diagnosing nonlinear mixed‐effects models. AAPS J. 2011;13(2):143‐151. [DOI] [PMC free article] [PubMed] [Google Scholar]
- 29. Cockcroft DW, Gault MH. Prediction of creatinine clearance from serum creatinine. Nephron. 1976;16(1):31‐41. [DOI] [PubMed] [Google Scholar]
- 30. Boselli E, Breilh D, Cannesson M, et al. Steady‐state plasma and intrapulmonary concentrations of piperacillin/tazobactam 4 g/0.5 g administered to critically ill patients with severe nosocomial pneumonia. Intensive Care Med. 2004;30(5):976‐979. [DOI] [PubMed] [Google Scholar]
- 31. Boselli E, Breilh D, Rimmelé T, et al. Alveolar concentrations of piperacillin/tazobactam administered in continuous infusion to patients with ventilator‐associated pneumonia. Crit Care Med. 2008;36(5):1500‐1506. [DOI] [PubMed] [Google Scholar]
- 32. Kuan Y, Hossain M, Surman J, El Nahas AM, Haylor J. GFR prediction using the MDRD and Cockcroft and Gault equations in patients with end‐stage renal disease. Nephrol Dial Transplant. 2005;20(11):2394‐2401. [DOI] [PubMed] [Google Scholar]
- 33. Lea‐Henry TN, Carland JE, Stocker SL, Sevastos J, Roberts DM. Clinical pharmacokinetics in kidney disease: fundamental principles. Clin J Am Soc Nephrol. 2018;13(7):1085‐1095. [DOI] [PMC free article] [PubMed] [Google Scholar]
- 34. Li J, Lovern M, Green ML, et al. Ceftazidime‐avibactam population pharmacokinetic modeling and pharmacodynamic target attainment across adult indications and patient subgroups. Clin Transl Sci. 2019;12(2):151‐163. [DOI] [PMC free article] [PubMed] [Google Scholar]
- 35. Gonçalves‐Pereira J, Póvoa P. Antibiotics in critically ill patients: a systematic review of the pharmacokinetics of β‐lactams. Crit Care. 2011;15(5):R206. [DOI] [PMC free article] [PubMed] [Google Scholar]
- 36. Roberts JA, Lipman J. Pharmacokinetic issues for antibiotics in the critically ill patient. Crit Care Med. 2009;37(3):840‐851; quiz 859. [DOI] [PubMed] [Google Scholar]
- 37. Kuti JL. Optimizing antimicrobial pharmacodynamics: a guide for your stewardship program. Revista Médica Clínica Las Condes. 2016;27(5):615‐624. [Google Scholar]
- 38. Mavridou E, Melchers RJ, van Mil AC, Mangin E, Motyl MR, Mouton JW. Pharmacodynamics of imipenem in combination with β‐lactamase inhibitor MK7655 in a murine thigh model. Antimicrob Agents Chemother. 2015;59(2):790‐795. [DOI] [PMC free article] [PubMed] [Google Scholar]
- 39. Upton RN, Mould DR. Basic concepts in population modeling, simulation, and model‐based drug development: part 3‐introduction to pharmacodynamic modeling methods. CPT Pharmacometrics Syst Pharmacol. 2014;3(1):e88. [DOI] [PMC free article] [PubMed] [Google Scholar]
- 40. Udy AA, Roberts JA, Lipman J. How should we dose antibiotics for pneumonia in the ICU? Curr Opin Infect Dis. 2013;26(2):189‐195. [DOI] [PubMed] [Google Scholar]
- 41. Concordet D, Leger F, Ane C. Population PK/PD analysis Encyclopedia of Biopharmaceutical Statistics: Marcel Dekker, Inc.; 2004. [Google Scholar]
Associated Data
This section collects any data citations, data availability statements, or supplementary materials included in this article.
Supplementary Materials
Supplemental Information
Supplemental Information
Supplemental Information
Supplemental Information
Supplemental Information