Abstract
This study reports on the first set of ambient observations of sub-1.0 hygroscopicity values (i.e., growth factor, ratio of humidified-to-dry diameter, GF=Dp,wet/Dp,dry and f(RH), ratio of humidified-to-dry scattering coefficients, less than 1) with consistency across different instruments, regions, and platforms. We utilized data from (i) a shipboard humidified tandem differential mobility analyzer (HTDMA) during Eastern Pacific Emitted Aerosol Cloud Experiment (E-PEACE) in 2011, (ii) multiple instruments on the DC-8 aircraft during Studies of Emissions, Atmospheric Composition, Clouds and Climate Coupling by Regional Surveys (SEAC4RS) in 2013, as well as (iii) the Differential Aerosol Sizing and Hygroscopicity Spectrometer Probe (DASH-SP) during measurement intensives during Summer 2014 and Winter 2015 in Tucson, Arizona. Sub-1.0 GFs were observed across the range of relative humidity (RH) investigated (75–95%), and did not show a RH-dependent trend in value below 1.0 or frequency of occurrence. A commonality between suppressed hygroscopicity in these experiments, including sub-1.0 GF, was the presence of smoke. Evidence of externally mixed aerosol, and thus multiple GFs, was observed during smoke periods resulting in at least one mode with GF < 1. Time periods during which the DASH-SP detected externally mixed aerosol coincide with sub-1.0 f(RH) observations. Mechanisms responsible for sub-1.0 hygroscopicity are discussed and include refractive index (RI) modifications due to aqueous processing, particle restructuring, and volatilization effects. To further investigate ambient observations of sub-1.0 GFs, f(RH), and particle restructuring, modifying hygroscopicity instruments with pre-humidification modules is recommended.
Introduction
Aerosol-water interactions influence how particles scatter solar radiation, their ability to serve as cloud condensation nuclei (CCN), and where they deposit in the human respiratory system [Dua and Hopke, 1996]. These interactions are also important to account for with regard to remote sensing retrievals of aerosol particles due to biases that result from aerosol swelling in moist areas such as next to clouds, in addition to attempts of using retrieved columnar aerosol data to estimate surface fine particular matter (PM2.5) [e.g., Kim et al., 2015]. Representing the ability to take up water vapor at fixed relative humidity (RH), hygroscopicity is a property of particles dependent on size and composition. Improving the understanding of aerosol hygroscopicity will improve predictability of future climate, as aerosol interactions with water vapor and clouds are linked to the largest sources of uncertainty in estimates of the total anthropogenic radiative forcing [IPCC, 2013].
In order to study aerosol hygroscopicity in the atmosphere, a number of instruments have been developed. Traditionally, the Humidified Tandem Differential Mobility Analyzer [HTDMA; Liu, 1978; Rader and Mcmurry, 1986] has been used for sub-saturated aerosol water uptake measurements; however, the long sampling time required to scan through a complete size distribution is impractical for aircraft applications. The Differential Aerosol Sizing and Hygroscopicity Spectrometer Probe [DASH-SP, Brechtel Mfg. Inc.; A. Sorooshian et al., 2008a] is a newer instrument designed specifically for aircraft-based, rapid, size-resolved measurements of aerosol sub-saturated hygroscopicity using two optical particle counters (OPCs) to measure scattering from a dried and a humidified channel. Both instruments quantify hygroscopic growth factor (GF), defined as the ratio of humidified particle diameter to a fixed, single diameter at dry conditions (GF = Dp,wet/Dp,dry). Nephelometer-based instruments quantify hygroscopicity for bulk aerosol using the parameter f(RH), which is the ratio of light scattering from all particle sizes in humid (typically RH of ~80%) versus dry conditions (typically RH less than 20%). While the nephelometer-based instruments are rapid and suited for aircraft measurements, two key differences with the previous two techniques are that f(RH) data are not size-resolved and have limitations in terms of probing RHs above 85% [Kreidenweis and Asa-Awuku, 2014].
While extensive research has reported on GF and f(RH) values extending from unity (i.e., no growth upon hydration) to higher values, only a few studies based on laboratory work, summarized below, have reported sub-1.0 hygroscopic growth, suggestive of particle size shrinkage upon hydration. Sub-1.0 hygroscopicity results when the humidified diameter is less than the original dry diameter (Dp,dry) for GF measurements, and when the total scattering of humidified ambient air is less than dried ambient air for f(RH) measurements. In terms of the single-parameter kappa (κ) developed by Petters and Kreidenweis, [2007], which is related to GF as shown by the approximation in Equation 1, sub-1.0 hygroscopic growth would correspond to κ < 0:
| (1) |
A range of explanations for sub-1.0 hygroscopicity have been discussed in past laboratory-based studies including surface-active organic species [Petters and Kreidenweis, 2013], slightly soluble organic compounds [Petters and Kreidenweis, 2008], and elemental carbon restructuring [Tritscher et al., 2011]. The majority of the literature has been devoted to particle restructuring. For example, flame-produced soot from diesel and propane combustion shows evidence of particle restructuring at an RH as low as 35% [Henning et al., 2012]. Using a similar source, Weingartner et al. [1997] concluded the restructuring process was still occurring and had not reached steady state with RH up to 80%. Soot from a propane diffusion flame can undergo morphological transformations, from chain-like to compact structure, as coagulation time increases, which is explained by Coulomb interactions between parts of the aggregated soot particle [Onischuk et al., 2003]. Another study showed that soot restructuring in acetylene and ethylene burner emissions occurs upon evaporation and is likely attributed to capillary effects [Ma et al., 2013]. Hydrophilic soot particles collapse into globules with increased RH [Mikhailov et al., 2006], yet when diluted with warm particle-free air, their fractal structure stays intact until humidification RH > 90% [Rissler et al., 2005].
Non-burner emitted particles also demonstrate restructuring behavior. Jimenez et al. [2003] observed that diiodomethane (CH2I2) particles formed under dry conditions were fractal agglomerates, until reaching higher RHs when they became more compact and dense particles. Upon hydration, there is evidence that biomass burning combustion particles of 100 nm or larger are more readily restructured [Martin et al., 2013], and the decrease in mobility diameter upon humidification is more pronounced for larger particles [Pagels et al., 2009]. Weingartner et al. [1995] found that organic particles above 100 nm shrank into a more compact structure at RH = 90% due to capillary forces induced on any asymmetrical part of the structure. Lewis et al. [2009] reported that wood smoke from combustion of chamise and palmetto collapse to a more spherical and compact shape upon exposure to high RH, while smoke from ponderosa pine, with lower inorganic content did not show this behavior.
While many studies have reported on particle size shrinking upon hydration from fuel burners, wood smoke, and soot, a number of laboratory studies focused on inorganic salts have found similar evidence, indicating the mechanism is not limited to organic-containing particles. Aggregated inorganic salt particles shrank after exposure to enhanced RHs (> 60%) and the degree of particle shrinkage was greater for aggregates of larger initial size and larger increases in RH [Montgomery et al., 2015]; a potential mechanism governing the structural change was suggested to be linked to surface tension owing to water adsorption within the aggregate structure. At low RH (< 50%), restructuring from hydration of (NH4)2SO4 has been shown to have stronger effects on particle mobility diameter than the adsorption or absorption of water [Mikhailov et al., 2009]. In a study of inorganic salts, observations of the structural rearrangement of NH4NO3, (NH4)2SO4, NaCl, and NaNO3 indicated that particle size decreased by up to 10% due to chemical reactions and evaporation upon hydration when exposed to RHs below each salts’ respective deliquescence RH [Gysel et al., 2002; Mikhailov et al., 2004].
Particle coating and photochemical aging affects the ability, degree, and onset of particle restructuring. Delayed and reduced hygroscopic growth has been observed with combustion particles coated with H2SO4 [Zhang et al., 2008], glutaric acid [Xue et al., 2009], surfactant organics [Dusek et al., 2011], dioctyl sebacate (DOS) and oleic acid [Ghazi and Olfert, 2013], anthropogenic secondary organic aerosol [Schnitzler et al., 2014], and soot with a hydrophilic coating [Pagels et al., 2009]. Aging soot in the presence of isoprene results in increased mass with decreased particle mobility diameter and increased effective density, as coating material fills in void spaces and causes partial restructuring of fractal soot aggregates [Khalizov et al., 2013]. Photochemical processing of fresh wood smoke was found to physically convert the fractal nature of smoke particles into a more spherical shape in addition to concurrent chemical transformations [Giordano et al., 2013; Giordano and Asa-Awuku, 2014].
Particle morphological changes upon hydration, including shrinkage due to restructuring, alters particle light absorption and scattering characteristics. Restructuring by neutralization surface reactions has been suggested to explain reduction in light absorption cross section upon hydration of laboratory generated mixtures of black carbon (BC) and brown carbon (BrC) particles at low humidity; however, upon RH increase, continued water uptake by inorganic coatings can lead to absorption enhancement [Chen et al., 2015]. In polluted, humid conditions, it has been observed that hygroscopic particles absorb water, growing in size and enhancing light scattering, but mass absorption cross section decreases, likely due to shielding effects of absorbing aerosols [S Lee et al., 2012]. Dennis-Smither et al. [2012] observed that refractive indices of organic aerosol increased during and after evaporation of volatile products, concluding that aging followed by slow restructuring in particle morphology was responsible for this behavior.
The goal of this study is to report ambient observations of sub-1.0 hygroscopic growth (GF and f(RH)), and consequently sub-0 κ, from three field projects: Eastern Pacific Emitted Aerosol Cloud Experiment (E-PEACE) in 2011; Studies of Emissions, Atmospheric Composition, Clouds and Climate Coupling by Regional Surveys (SEAC4RS) in 2013; and observations from measurement intensive periods at the Tucson Aerosol Characterization Observatory (TACO) between 2014 and 2015. All three field studies included measurements of aerosol hygroscopicity as well as other chemical and meteorological observations. Possible causes for sub-1.0 hygroscopicity will be discussed in addition to suggested strategies for probing this phenomenon in greater detail for future studies.
2. Experimental Methods
2.1. Field Observations and Instrumentation
2.1.1. E-PEACE Field Campaign
E-PEACE was a multiplatform field study focused on the coastal zone of California during July–August 2011, investigating aerosol-cloud-precipitation-radiation interactions [Russell et al., 2013]. The project involved the use of the Center for Interdisciplinary Remotely-Piloted Aircraft Studies (CIRPAS) Twin Otter, based in Marina, CA, and the R/V Point Sur, which conducted a 12-day research cruise (12–23 July). Specifics of the campaign and results are detailed elsewhere [Russell et al., 2013; Wonaschütz et al., 2013; Wang et al., 2014; Jung et al., 2015; Modini et al., 2015]. This work utilizes data only from the R/V Point Sur, on board which smoke generators used gasoline and heated paraffin-type oil with low vaporization temperature (150°C) to emit smoke in the marine boundary layer. An organic plume of thick condensed smoke and vapor was emitted into the marine atmosphere and measured from R/V Point Sur itself with an extensive payload of instruments [Russell et al., 2013].
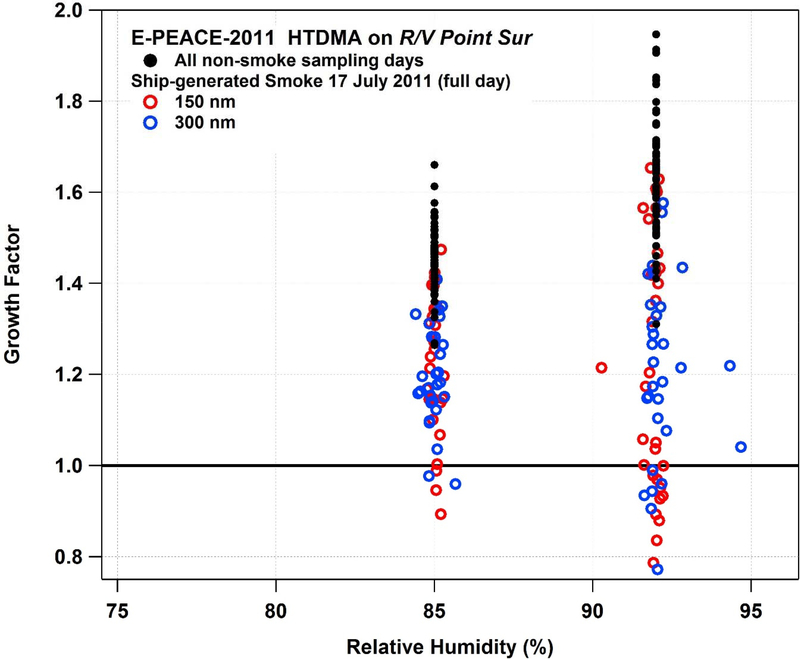
Of most relevance from the R/V Point Sur instrument payload was an HTDMA, which measured hygroscopic growth with two DMAs, one dry (RH < 8%) and one humidified at varying RH settings (40, 70, 85, and 92%), with uncertainty in GF of ± 0.03 [Lopez-Yglesias et al., 2014]. Dry particle diameters selected were 30, 75, 150, and 300 nm. To allow for more meaningful intercomparisons with measurements from other experiments pertaining to our investigation, we only use data for the two highest RH set points (85 and 92%) at dry sizes of 150 and 300 nm. Smoke emissions emitted by the ship and then sampled by the ship on 17 July 2011 constitute a key case study. Plume tracking, meteorological conditions, and results from other instruments on board R/V Point Sur related to the smoke sampling can be found in Wonaschütz et al. [2013].
2.1.2. TACO Measurement Intensives
The Tucson Aerosol Characterization Observatory (TACO) is a rooftop laboratory on the University of Arizona campus in inner city Tucson (30 m AGL, 720 m ASL; 32.2299°N, 110.9538°W), which has a metropolitan population of ~1 million [U.S. Census Bureau, 2011]. The observatory has been collecting long-term data relevant to aerosol particle properties and meteorology since 2011. Instrument results at TACO from various instruments in addition to DASH-SP, such as a Particle-Into-Liquid Sampler (PILS, Brechtel Manufacturing Inc.), Cloud condensation nuclei counter (CCNc, DMT Inc.), a semicontinuous OC/EC analyzer (Sunset Laboratory Inc., Oregon), Micro-Orifice Uniform Deposit Impactors (MOUDI, MSP Corporation), and single-stage filter samplers have been summarized elsewhere [Youn et al., 2013; Crosbie et al., 2015; Sorooshian et al., 2015; Youn et al., 2015].
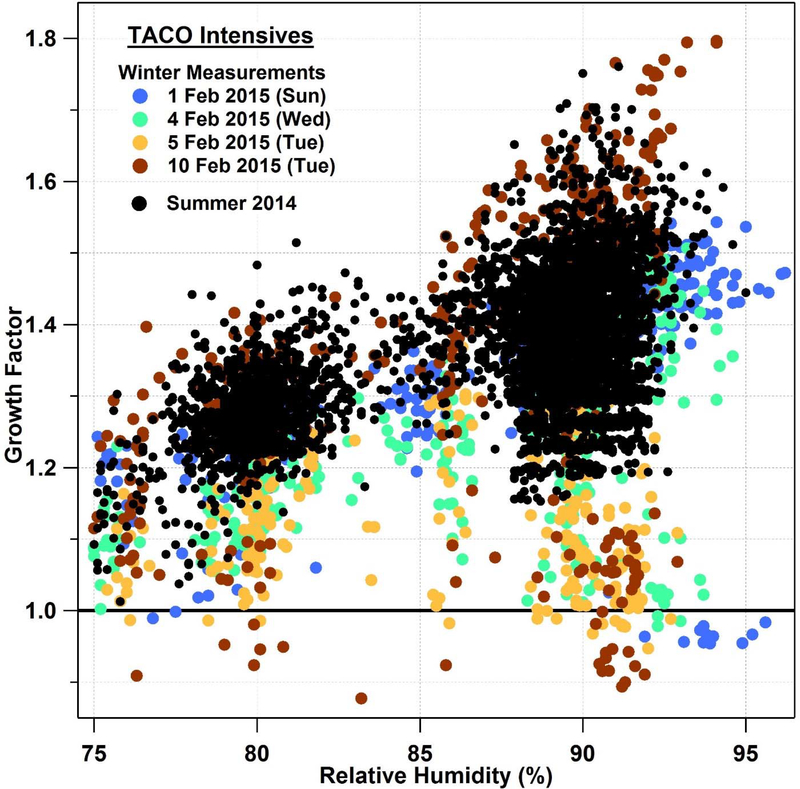
During TACO, the DASH-SP measured size-resolved GFs at humidified RH values typically between 50–95% with dry channel measurements below 20% RH, and with Dp,dry between 180 and 300 nm. The DASH-SP RH was controlled within 1.5% and the GF uncertainty was less than 3% [Shingler et al., 2016]. The instrument data from TACO relevant to the current study is from the DASH-SP during summer intensive periods (27 May – 01 June 2014, 12–20 August 2014) and a winter intensive period (30 January – 12 February 2015). Instrument operating details, data processing procedures, and examples of its field deployment are presented elsewhere [Sorooshian et al., 2008a, 2008b; Hersey et al., 2009, 2011, 2013; Shingler et al., 2016]. The instrument relies on a classification differential mobility analyzer (DMA) to select dried particles of a specific diameter prior to feeding the monodisperse aerosol stream to the following modules: a diffusion-based aerosol conditioning module in which particles are brought to equilibrium at a controlled RH, followed by detectors at the outlet end that either determine (i) the optical scattering distribution of dry, monodisperse particles selected by the DMA (used to determine the real component of refractive index, RIdry, at 532 nm), or (ii) the optical scattering distribution of the particles after the RH conditioning module.
2.1.3. SEAC4RS Field Campaign
Based out of Houston, TX during August–September 2013, SEAC4RS incorporated three research aircraft to investigate numerous topics including (i) emission redistribution throughout the troposphere from deep convection, (ii) evolution of gases and aerosols in convective outflow and their implications for atmospheric chemistry, and (iii) how anthropogenic pollution and biomass burning emissions are affected by meteorology and cloud processing. Another focus was to validate/calibrate instrumentation as a test bed for future applications. Details of the SEAC4RS project and specifics on measurements pertaining to this work can be found elsewhere [Toon et al., 2016] and all data are publicly available from the NASA Langley Research Center Atmospheric Science Data Center [ASDC, 2015].
This work focuses on in situ measurements from the NASA DC-8, utilizing all research flights from SEAC4RS with focus on three flights that targeted biomass-burning sampling: 6 August, 19 August, and 27 August. The DASH-SP on board the DC-8 measured size-resolved hygroscopic GFs of ambient aerosol particles at humidified RH values typically between 70–95% with dry channel measurements below 15% RH, and Dp,dry between 175 and 350 nm [Shingler et al., 2016]. Similar to TACO conditions, the DASH-SP RH was controlled within 1.5% and GF uncertainty was less than 3% for SEAC4RS measurements [Shingler et al., 2016]. f(RH) data are obtained from the Langley Aerosol Research Group Experiment (LARGE) instrument package, specifically the tandem humidified nephelometers [TSI Inc, St. Paul, MN, USA; Model 3563; Ziemba et al., 2013] at dry (RH 20%) and humidified (RH 80%) scattering channels. Number size distributions from the Laser Aerosol Spectrometer (LAS; Dp between 0.1—6.3 μm) as part of LARGE were used in particle density calculations. DC-8 data are also used for acetonitrile from the Proton-Transfer-Reaction Mass Spectrometer [PTRMS; de Gouw and Warneke, 2007], black carbon (BC) from the Humidified-Dual Single-Particle Soot Photometer [HD-SP2; Schwarz et al., 2008], and sub-micron aerosol chemical composition from the High Resolution Aerosol Mass Spectrometer [HR-AMS; DeCarlo et al., 2006; Canagaratna et al., 2007], and biomass burning number fraction of PM2.5 from the Particle Analysis by Laser Mass Spectrometry [PALMS; Lee et al., 2002].
3. Results
3.1. Sub-1 Hygroscopicity Observations
Multiple pieces of evidence for sub-1.0 hygroscopicity are presented in order from E-PEACE, TACO, and SEAC4RS. Ship-based HTDMA measurements of GF during E-PEACE are summarized in Figure 1, where it is shown that GF is clearly suppressed in smoke-influenced samples as compared to background aerosol sampled outside of the ship-generated smoke plume. GFs below 1.25 are only observed in smoke-influenced samples. Additionally, numerous observations of sub-1.0 GF are reported during smoke sampling, regardless of the dry particle diameter. While more pronounced at a RH of 92%, reaching GFs as low as 0.77, sub-1.0 GFs are observed at 85% as well, reaching a minimum value of 0.89.
Figure 1.
Growth factor as a function of HTDMA relative humidity during E-PEACE-2011, with 150 nm and 300 nm dry diameter sizes from all non-smoke sampling days (150–300 nm), and smoke sampling from 17 July 2011.
Ground-based measurements of GF for Dp,dry of 190–300 nm during TACO intensives (Fig. 2) indicate that higher values are observed during summer periods (above 1.15 at RH > 80%) with suppressed GFs and sub-1.0 values during winter periods. The reduction of GF below 1.0 is not more pronounced at any particular RH between 75–97%. Winter in the Tucson metropolitan area is characterized by enhanced residential burning for heat. As the area is surrounded by mountains with strong boundary layer inversions during cold nights, residential burning emissions are trapped in a shallow layer and often are not ventilated in periods of prolonged cooler temperatures [Crosbie et al., 2015], which leads to the highest year-round PM2.5 mass concentrations of species linked to biomass burning including elemental carbon, organic carbon, and water-soluble organic carbon [Youn et al., 2013]. While it cannot be proven unambiguously that sub-1.0 GFs in Tucson are due to biomass burning, certainly the coincidence of burning during periods with these data points supports the case for a potential link.
Figure 2.
Growth factor as a function of DASH-SP relative humidity for TACO winter and summer intensive measurement periods for dry diameter sizes 190–300 nm.
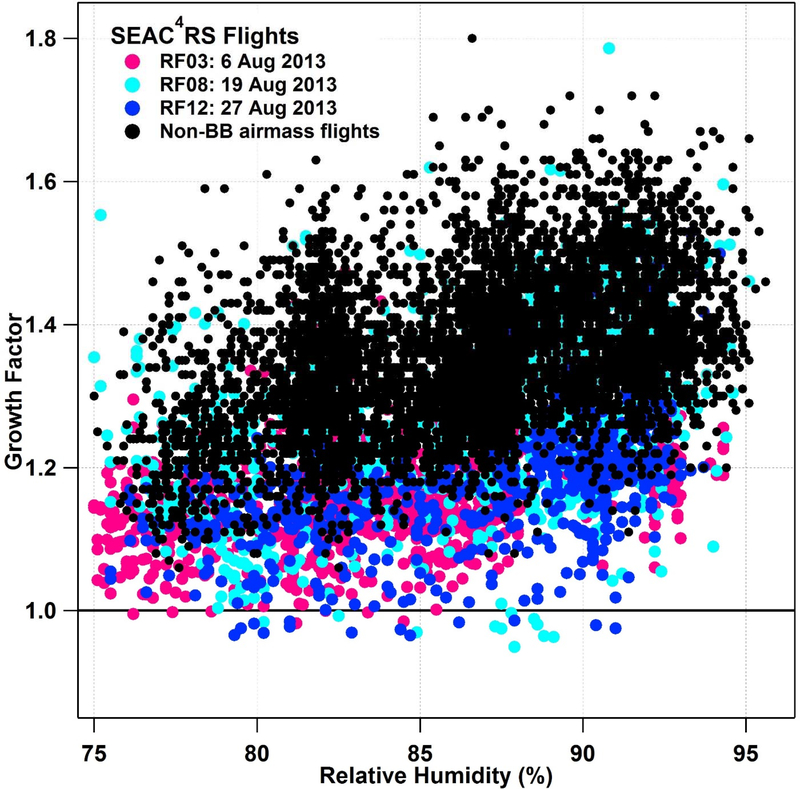
Hygroscopicity data from SEAC4RS for Dp,dry of 160–360 nm further provides evidence of sub-1.0 GF values with most occurrences being at RHs between 80–90% and without any systematic difference in value below 1.0 at any particular RH (Fig. 3). Similar to E-PEACE and TACO, a difference in trends between biomass burning sampling and non-smoke sampling is observed, with sub-1.0 points observed only during the former periods. Shingler et al. [2016] have shown that wildfire emissions during SEAC4RS coincide with suppressed GF and sub-1.0 observations.
Figure 3.
Growth factor as a function of DASH-SP relative humidity for all SEAC4RS flights, for dry diameters 160–360 nm, with all non-biomass burning flights (black dots) and three biomass burning-focused flights (colored dots) coinciding with all of the sub-1.0 GF data.
From the three presented field studies, biomass burning (SEAC4RS), residential burning TACO), and simulated smoke emissions (E-PEACE) coincide with suppressed GF observations compared to non-combustion sampling, and show evidence of sub-1.0 hygroscopicity. It is reinforced that strict quality control measures have been implemented for each data set, and the sub-1.0 observations in Figs. 1–3 have withstood those checks, including removing all in-cloud sampling from SEAC4RS and any periods with poor signal-to-noise ratio.
3.2. Case Study: Aged Smoke Sampling
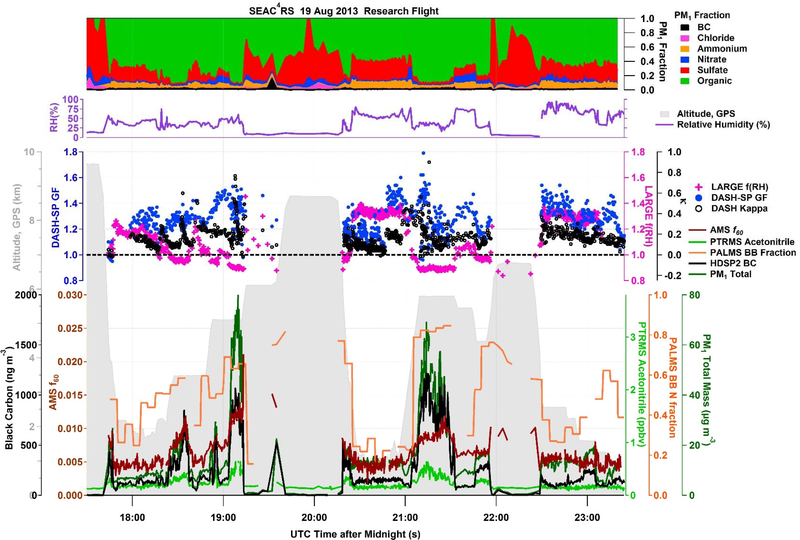
In order to investigate sub-1.0 hygroscopicity in depth, a case study is highlighted from SEAC4RS during the 19 August 2013 research flight. A flight from this campaign is chosen for a case study as it had the most complex suite of instruments as compared to the other campaigns and the DC-8 was able to study biomass-burning plumes across a wider plume age range. The 19 August flight in particular offered excellent data coverage across multiple instruments of relevance to this study. During this flight, the DC-8 probed an aged fire plume over Nebraska and Wyoming, originating from Idaho and Wyoming fires as determined from the Emission Inversion method [Saide et al., 2015]. Figure 4 presents a time series of chemical composition, biomass burning markers, aircraft altitude, ambient RH, and hygroscopicity measurements. The biomass burning markers utilized in this study are: (i) gas-phase acetonitrile, indicative of biomass burning emissions at elevated concentrations (> 250 ppbv); (ii) AMS f60, which is the fraction of organic aerosol at m/z 60 (i.e., levoglucosan-like fragment in the instrument); (iii) BC; and (iv) PALMS biomass burning (BB) fraction (i.e., number fraction in PM2.5 containing biomass burning material).
Figure 4.
Time series of chemical composition, ambient relative humidity, hygroscopicity measurements (GF, κ derived from GF, and f(RH)), aircraft altitude, and biomass burning tracers for the SEAC4RS 19 August 2013 flight targeting aged biomass burning wildfire smoke.
The periods of lowest f(RH) between 21:00–21:30 correspond to enhanced levels of all four of the aforementioned biomass burning tracers. GF and κ from DASH-SP are also lowest during this time period, however, only a few points exhibited values of sub-1.0 or sub-0, respectively. While the mass fraction of BC relative to total PM1 (MFBC) remains steady in and out of biomass burning sampling (~1–2%), periods with f(RH) < 1 exhibit enhanced organic mass fraction (MForg ~90%), with lower values (~70%) observed when f(RH) > 1. As PM1 total mass is elevated in biomass burning plumes (> 50 μg m−3), the BC contribution to total mass is of the same order of magnitude as inorganic species and the mass of BC increases by approximately a factor of ten. This increase in BC mass could affect the total scattering of the aerosol, as well as the DASH-SP size-resolved GF depending on the peak modal diameter of BC particles. Between 21:00–21:30, HD-SP2 measurements show that the mass-median diameter of BC cores is 175 nm volume equivalent diameter, and the calculated BC-specific κ is −0.03 ± 0.02. With DASH-SP sampling at a fixed dry size of 250 nm during this plume intersection, theoretically, BC cores would not be sampled. However, as LARGE f(RH) is a bulk scattering measurement, BC cores would be sampled, possibly explaining f(RH) values were more frequently detected below 1.0 as compared to GF values.
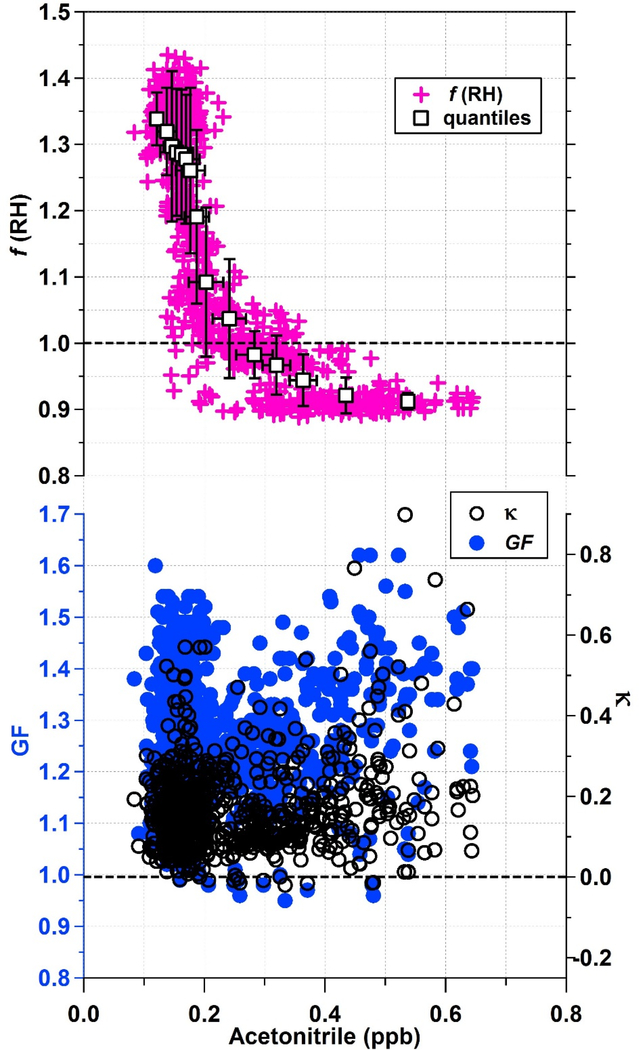
The relationship between hygroscopic growth and biomass burning indicators is further explored in Fig. 5 where it is shown that acetonitrile and f(RH) have an inverse relationship, which asymptotes to f(RH) ~0.9 at the highest acetonitrile concentrations (0.55–0.65 ppbv). f(RH) values were always sub-1.0 when acetonitrile levels exceeded 0.38 ppbv. The GF and κ relationship with acetonitrile is less clear. As already noted, this could be due to the size-resolved nature of DASH-SP measurements.
Figure 5.
Nephelometer-based hygroscopicity measurements of f(RH) from LARGE, and DASH-SP-based hygroscopicity measurements of GF and κ (derived from GF) as a function of PTRMS measured acetonitrile, a biomass burning marker, for the SEAC4RS 19 August 2013 flight.
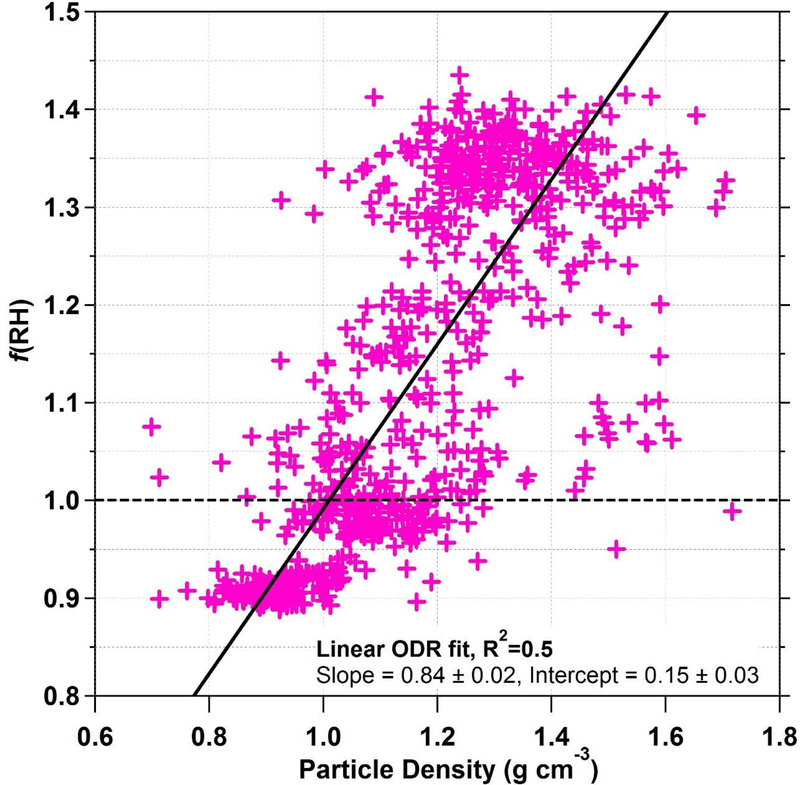
As literature suggests wetting of chain-like or aggregated particles can lead to a more compact nature and higher density [Weingartner et al., 1995; Jimenez et al., 2003; Onischuk et al., 2003; Lewis et al., 2009], differences in particle density can be used as a plausible marker for particle restructuring. Particle density is calculated using data for size distribution and PM1 mass fractions of organic, inorganic, and BC species. Figure 6 illustrates the relationship between particle density and f(RH), which both are representative of bulk aerosol unlike the size-resolved GF measurements from the DASH-SP. f(RH) is shown to increase as a function of particle density. A linear orthogonal distance regression (ODR) trend line is fit to the f(RH)-density scatterplot, resulting in slope of 0.84 cm3 g−1 and intercept of 0.15. With R2 of 0.5 (n = 747), 50% of the variance in f(RH) is explained by particle density. While the predictive correlation between these two parameters could be stronger, the results still support the notion that agglomerated and chain-like particles collapse into more compact, denser particles.
Figure 6.
Nephelometer-based hygroscopicity measurements of f(RH) from LARGE as a function of particle density for the SEAC4RS 19 August 2013 flight. Particle density, which is thought to be reduced during particle restructuring in biomass burning plumes, is calculated from LAS size distributions and AMS chemical composition.
4. Discussion
Section 4.1 below demonstrates how a revised data processing strategy with DASH-SP data can handle cases of externally mixed aerosol in order to identify more cases of sub-1.0 hygroscopic growth than with previous data processing methods. Sections 4.2–4.3 focus on reasons as to why sub-1.0 hygroscopic growth data are observed in the various datasets presented in this work. One mechanism already discussed in Section 1 that the current dataset cannot provide direct evidence for, but is a likely explanation for at least a subset of the sub-1.0 data points, is that of particle restructuring. It is also possible that restructuring can occur concurrently with any combination of the other reasons discussed below.
4.1. External Mixtures
Atmospheric aerosols are assumed to be internally mixed due to atmospheric processing, both from cloud and photochemical processing. As a result, atmospheric aerosol instruments are often optimized for internal mixtures [Seinfeld and Pandis, 2012]. An external mixture is a heterogeneous mixture of aerosol particle populations, where each particle may have unique composition, whereas, an internal mixture is a chemically homogeneous mixture of aerosol particles. The subsequent discussion examines how a revised treatment of DASH-SP data to consider external mixtures can lead to possible sub-1.0 GF values.
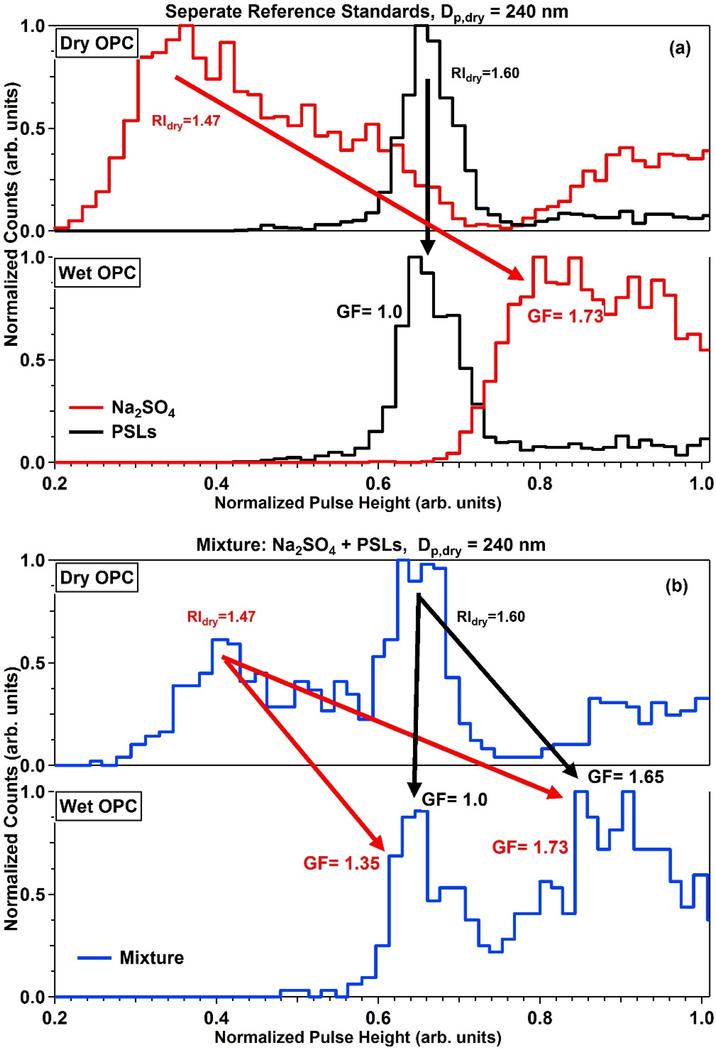
To test the DASH-SP’s capability to identify the presence of externally mixed aerosol, calibration standard solutions of Na2SO4, polystyrene latex particles (PSLs), and a mixture of the two were atomized and fed to the instrument, which sampled at a Dp,dry of 240 nm with RH = 80% (Fig. 7a–b). The dry RI (RIdry) of the two number concentration modes observed in the dry OPC channel correctly match the values of the individual standards, with RIdry = 1.47 for Na2SO4 and 1.60 for PSLs. While individual standards produce one clear number concentration mode, and thus one GF, according to the properties of that specific standard (Fig. 7a), a mixture of the two species results in a more ambiguity since it usually is unclear as to which of the multiple modes in the humidified size distribution should be assigned to a specific mode in the dry distribution (Fig. 7b). As this was a controlled laboratory experiment, it is known with certainty how the two modes in each distribution of Figure 7b match up. However, if this were a field measurement, it would be unclear which humidified peak should be associated to which RIdry leading to four potential GFs from the mixture sample scan (Fig. 7b). In the following discussion (Figs. 8–9), we define an external mixture as being when two distinct RIdry are observed at a selected dry size.
Figure 7.
DASH-SP laboratory characterization results (Dp,dry = 240 nm, 80% RH) when sampling (a) separate calibration standards and (b) the mixture of the two standards. Panel (b) shows that if the composition of the aerosol was unknown that four different GF values would be possible.
Figure 8.
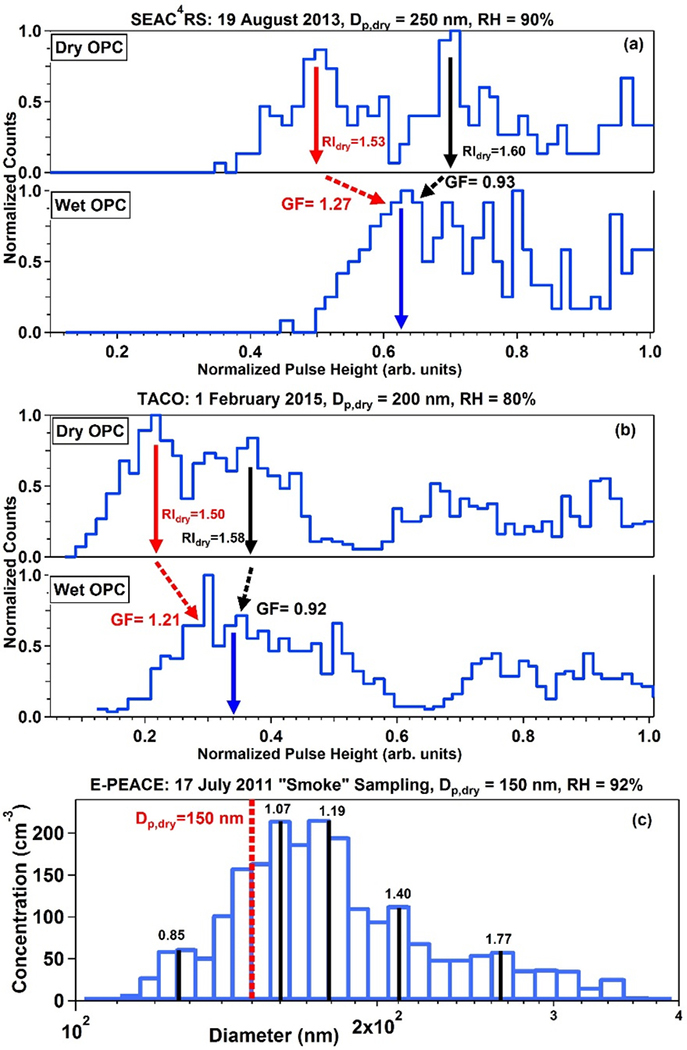
Examples of the DASH-SP detecting externally mixed aerosol, and thus multiple GFs, during (a) the SEAC4RS campaign, (b) wintertime intensive measurement periods in Tucson, Arizona at TACO, and (c) smoke sampling periods in E-PEACE.
Figure 9.
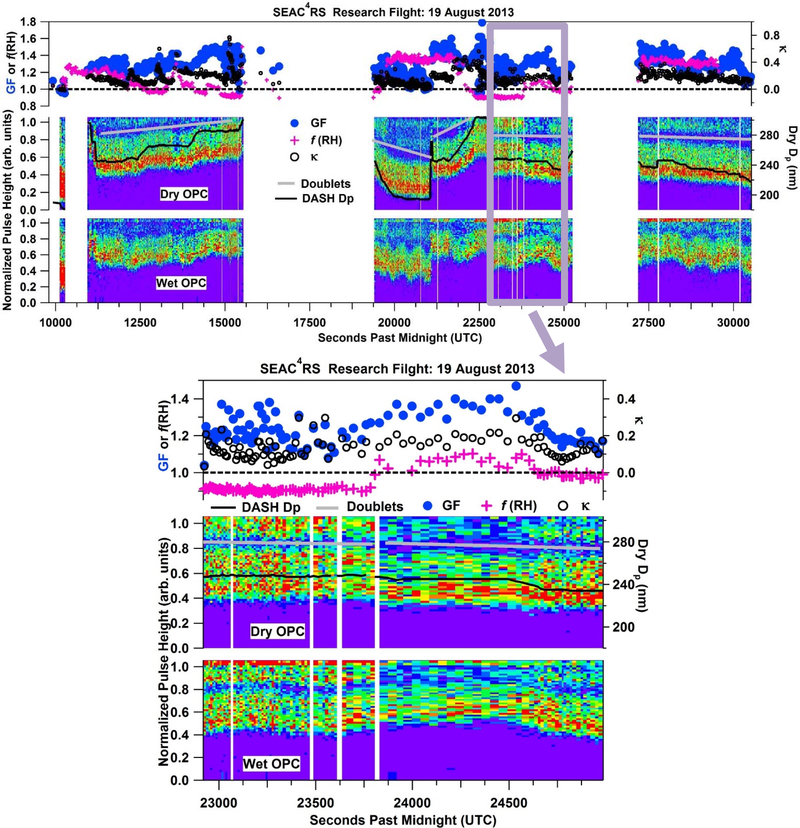
DASH-SP normalized pulse height distributions for dry and wet OPCs during the SEAC4RS 19 August 2013 flight, with dry particle diameter (black line), and hygroscopic growth parameters (GF, κ derived from GF, and f(RH)). The area above gray lines is intended to distinguish doubly-charged particles from the rest of the data underneath.
Data have been selected from SEAC4RS (Fig. 5), TACO (Fig. 2), and smoke sampling during E-PEACE (Fig. 1) to illustrate evidence of external mixtures. The scans selected are representative of the smoke sampling periods in each of these studies, with the caveat that TACO data do not reflect a fresh smoke plume but rather an urban plume with smoke influence due to residential heating. DASH-SP data from SEAC4RS (Fig. 8a), illustrate the presence of two RIdry at one Dp,dry during a period of biomass burning sampling. Similarly, DASH-SP data from TACO on 01 February 2015 during the wintertime reveal two RIdry are observed at one Dp,dry during a day with likely residential burning owing to low ambient temperatures (Fig. 8b).
While the DASH-SP scans in SEAC4RS and TACO show two clear modes, representative of two distinct values of RIdry, there are less defined modes in the humidified size distribution. Unlike the laboratory tests with an external mixture of two known species, the exact chemical composition of ambient air sampled is unknown, which complicates the matching of modes. Consequently, there is uncertainty about how to match each RIdry with an associated humidified channel mode. The weighted mean of the humidified distribution has been selected in these scans (Figs. 8a–b), as was done for the field campaign datasets, details of which can be found in Shingler et al. [2016]. Depending on RIdry associated with the weighted mean of the humidified OPC distribution, one of two GFs is possible, and in these cases, the higher RIdry results in a sub-1.0 GF. This analysis suggests that instances of sub-1.0 GF could generally be underreported with current post-processing algorithms (such as with the DASH-SP up to this point) that typically only lead to one GF value per scan. That is to say, the sub-1.0 GFs shown in Fig. 8a–b, are not in campaign-wide summary plots (Fig. 2–3). The reported GFs for DASH-SP scans in Fig. 8a and 8b, are 1.26 and 1.16, respectively, using the weighted mean approach of Shingler et al. [2016] for the dry and humidified OPC distributions.
Figure 8c represents a HTDMA scan from E-PEACE during smoke sampling on 17 July 2011, where five GF modes were resolved using the multi-peak fitting package in Igor (Wavemetrics, Inc.). Of note is that one of the GFs was 0.85. The HTDMA sampling time (~75 s) was longer than typical DASH-SP scanning times in smoke plumes (~ few seconds), which means that confidence in the ability of the former instrument to accurately resolve multiple GFs depends on whether the aerosol characteristics during the entire scan stay the same. This can be a challenge for plumes of fresh emissions where the probably of externally mixed aerosol is higher since moving platforms may struggle to stay in the plume for an entire scan. However, during this particular scan the instrument was able to sample the plume continuously for the full scan duration.
To further investigate external mixtures during the case study flight on 19 August 2013 during SEAC4RS, Fig. 9b shows a time series of dry and humidified OPC scans over the entire flight with GF, κ, and f(RH). Changes in selected Dp,dry are reflected in location of dry OPC distributions. During the expanded period in Fig. 9b the DC-8 spent time in and out of biomass burning plumes. This distinctive signature of being either in or out of the plume is evident in f(RH) measurements of sub-1.0 hygroscopicity in the plume. Evidence of prolonged periods of the DASH-SP sampling external mixtures is correlated with periods of f(RH) < 1, as seen in both periods of sub-1.0 f(RH) in Fig. 9b. The effect of two populations of aerosol at one Dp,dry supports the claim the DC-8 sampled an externally mixed aerosol population during biomass burning plumes on 19 August 2013. While sub-1.0 GF is observed during the 19 August 2013 case study, f(RH) < 1 is more common. One explanation for DASH-SP not observing sub-1.0 GF while f(RH) < 1 could be due to DASH-SP measurements at a specific Dp,dry combined with periods of externally mixed aerosol.
The question remains as to how an external mixture affects LARGE f(RH) measurements and what the difference is in chemical composition between the two peaks in DASH-SP’s bimodal distribution. It is worth noting that roughly 50% of pulse height observations in DASH-SP raw data during periods of externally mixed aerosol are at the higher RIdry, which has a similar RI to BC or PSLs. Typical organic aerosol has an RI of 1.55, and elemental carbon has an RI of 1.8 [Malm et al., 2005]. Other than there being a high concentration of BC, it has been suggested that amorphous carbon spheres or “tar balls” with higher RI than simple organics could be responsible for the second higher RI peak, particularly in Dp,dry size range of this study [Hand et al., 2005]. These tar balls are thought to consist of organic polymer material and are mostly insoluble in water [Posfai et al., 2004], unchanged by moderate RH or cloud processing. However, Hand et al. [2005] suggested that at RH > 80%, Scanning Electron Microscope (SEM) analysis indicates the start of “melting” of particle edges, with effective degradation of tar balls and wetting by RH > 92% resulting in irreversible morphological changes.
4.2. Refractive Index Sensitivity
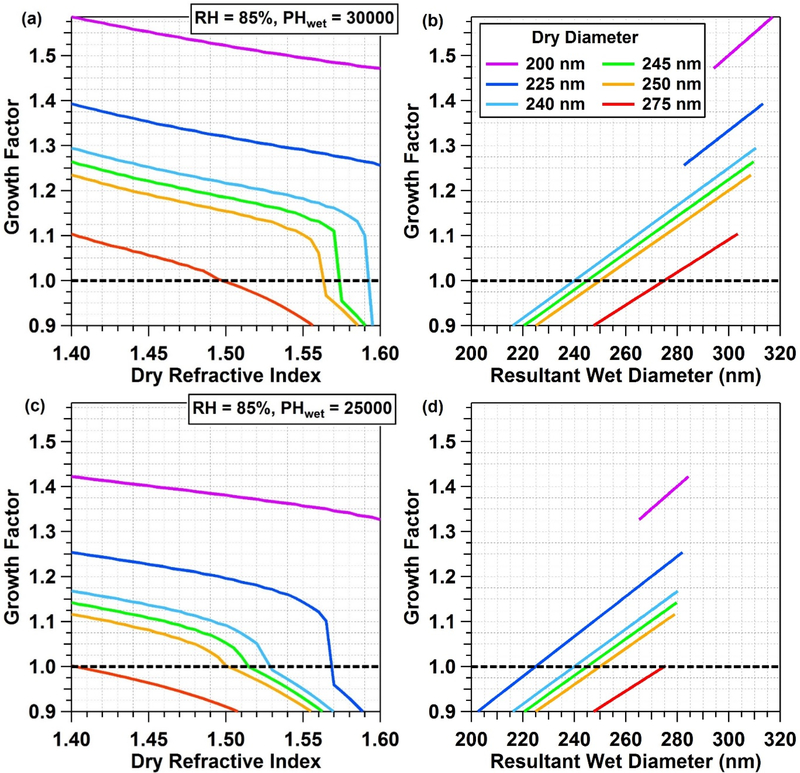
Since the DASH-SP data processing algorithm relies on the measurement of dry particle refractive index (real part), it is possible that a RI change, due to chemical modification in the DASH-SP after dry sizing, would result in an apparent change in wet size, without physical size changing. To probe this possibility, a sensitivity analysis of GF RIdry was conducted with results shown in Fig. 10. A representative humidified channel RH (85%) and OPC electrical pulse height (PHwet: 30,000 in Fig. 10a–b, 20,000 in Fig. 10c–d) were explored; it is noted that the OPC reports electrical pulse heights which are subsequently converted into number concentration. For a given Dp,dry, RHdry, and fixed PHwet, the effect of variations in RIdry on GF and “resultant” wet diameter was calculated. With a fixed PHwet, it is assumed that wet physical size does not change. Thus, the effect of RI (due to aqueous processing) on GF is isolated. For a fixed Dp,dry and wet physical size, a shift in RI produces a profound effect; in Fig. 10c, a 225 nm dry particle could have a GF ranging from 0.9–1.25 over an RI range of 1.4–1.59. Thus, while physical size may remain unchanged by water uptake, aqueous chemistry shifting RI could result in a sub-1.0 value.
Figure 10.
Visualization of the sensitivity of DASH-SP GFs to changes in RI that could arise due to chemical modification of particles upon aqueous processing during humidification. Dry RI is shown as a function of both GF and resultant wet diameter for different dry particle diameters. A GF value of 1.0 is marked for reference (black dotted line on left panel, black dots on right panel).
4.3. Evaporation and Phase Change
Sampling of aerosol to conduct hygroscopicity measurements is prone to evaporation of semivolatile compounds. Thermo-kinetic modeling was recently conducted by Shingler et al. [2016] to investigate the potential effects of evaporation of semivolatile organic compounds (SVOCs) and ammonium nitrate within the measurement inlet and inside the DASH-SP system. They reported results for select organic and inorganic compounds of varying chemical structure and volatility for typical SEAC4RS operating conditions. Details of model set up, conditions, and validation can be found in Shingler et al. [2016]. Briefly, the Aerosol Inorganic-Organic Mixtures Functional groups Activity Coefficients [AIOMFAC; Zuend et al., 2008, 2011] model was utilized to determine species activity coefficients and condensed phase concentrations. The output from AIOMFAC was used in the kinetic multi-layer model for gas-particle interactions in aerosols and clouds [KM-GAP; Shiraiwa et al., 2012] to model transient mass transfer processes and gas-phase concentrations during instrument sampling.
In this work, we are primarily concerned with additional losses due to particle evaporation experienced from the entrance of the humidifier up to the size distribution measurement in the humidified OPC. By definition, if a humidified particle does not grow in size upon hydration, a GF = 1 would result, and if this particle experiences evaporative losses, thus decreasing mass in the particle phase in the humidifier and humidified OPC measurement, a sub-1.0 GF could result. The particles modeled in Shingler et al. [2016] are characterized by plausible concentration ratios of inorganic to organic species, in addition to relative amounts of low-volatility organic compounds (LVOCs) to SVOCs (5% ammonium nitrate, 25% ammonium sulfate, 50% LVOCs, and 20% SVOCs). Simulations were conducted for particles with Dp,dry of 250 nm and with instrument humidified channel RHs of 75%, 85%, and 93%, but for this discussion we focus on 85%.
Evaporative losses of ammonium nitrate for liquid-phase and semi-solid particles range between 13.1–14.3% and 0.0–0.1%, respectively, the range depending on the reference ambient temperature (modeled at 250, 295, and 310 K; representative of a range of tropospheric altitudes) for both phases. Losses of organic species can range from near zero for low volatility compounds (e.g., docosanoic acid ~0.01% for liquid and semi-solid phases) to complete evaporation to gas-phase (e.g., chrysene, 5.6–11.2% for liquid and 0.0–0.1% for semi-solid particles) [Shingler et al., 2016]. Losses are more severe for liquid phase particles than for semi-solid particles, as the bulk diffusivity of water and organics is reduced in semi-solid particles. These reported evaporative losses in the instrument at 85% RH would reduce a GF of 1.15 (without losses) to 1.11 with losses and represent an upper limit of underestimation of GF values as the particle composition used in this modelling analysis was more volatile than a semivolatile ambient aerosol [Shingler et al., 2016].
Considering that the composition of wildfire biomass burning smoke has a higher organic mass fraction than other airmasses (~90% and 70%, respectively, as shown in Fig. 4 and reported in Shingler et al., [2016]), these evaporative loss modeling results must be extrapolated to conditions which lead to sub-1.0 GF and f(RH). As the volatility of biomass burning smoke can vary based on biofuel and fire phase, (i.e., more volatile biomass burning organic aerosol is produced in smoldering combustion than flaming combustion [Huffman et al., 2009]), without detailed chemical composition measurements during sampling, quantifying the evaporative losses for aerosol near the GF = 1 threshold is not possible in this study. Assuming the loss estimates in Shingler et al. [2016] are reasonable and represent an upper limit to reduction in GF, and the modeled semivolatile composition within the particle phase is representative of the ambient samples, it can be qualitatively assumed that a reported GF of 0.95 would be higher without evaporative losses within the sampling inlet and DASH-SP system. However, as there is no significant dilution or temperature change in the f(RH) measurement technique, evaporative losses are much less significant in f(RH) measurements compared to DASH-SP measurements of GF. As f(RH) datapoints represent the majority of sub-1.0 hygroscopicity observations (Fig. 4 and 5), it is unlikely that evaporative losses are the dominant contributing mechanism resulting in sub-1.0 observations.
5. Conclusions
Combining hygroscopicity measurements from three different instruments across multiple field projects and observation platforms, this work presents the first observations of sub-1.0 hygroscopicity reported in the ambient environment. Ship-based HTDMA measurements reveal sub-1.0 GFs exclusively during sampling smoke-like particles in the marine boundary layer off the California coast. Ground-based DASH-SP data in Tucson, Arizona exhibit sub-1.0 GFs exclusively during winter, coincident with widespread residential wood burning. Aircraft-based data for DASH-SP GF and LARGE f(RH) exhibit sub-1.0 hygroscopicity exclusively during wildfire biomass burning sampling. Detailed examination of a biomass burning focused flight during SEAC4RS indicate smoke plumes where acetonitrile exceeds 380 pptv result in sub-1.0 f(RH), with measurements leveling off at 0.9. Reduced particle density correlates with the lowest f(RH) values, with the majority of sub-1.0 observations occurring when particle density is less than 1.2 g cm−3.
A new manual data processing technique is demonstrated with the DASH-SP that can help identify more cases of sub-1.0 GF as compared to previous methods for both the current, previous, and future experiments. More specifically, the procedure focuses on identifying cases of externally mixed aerosol with support from laboratory tests. Observations from all three field campaigns by both the DASH-SP and HTDMA show that externally mixed aerosol, manifested as bimodal hygroscopicity profiles, were present during smoke-influenced sampling. Given current post-processing capabilities with DASH-SP data, quantitatively reporting multi-modal GFs is not yet possible; however, detailed case examples of specific scans show how multiple GFs are not uncommon with the lowest GF sometimes being sub-1.0. It is not clear how externally mixed aerosol would affect f(RH) measurements, yet SEAC4RS observations indicate f(RH) < 1 when DASH-SP observes two RIdry at one Dp,dry size. External mixtures observed in this work are consistent with literature reports of freshly emitted wood smoke from laboratory combusted biomass fuels resulted in bimodal κ, indicative of chemical heterogeneity, or externally mixed aerosol [Carrico et al., 2010]. Future work will focus on further development of DASH-SP post-processing to quantify more than one GF and examining the connection between external mixtures and sub-1.0 f(RH) observations.
Potential explanations for sub-1.0 hygroscopicity were explored, including RI modifications due to aqueous processing. A sensitivity analysis showed that aqueous processing of particles without a change in physical size can alter RI in such a way to result in a sub-1.0 value when using OPCs that rely on light scattering for detecting particle size. Interactions between particle morphological changes upon hydration and light-scattering changes warrants further exploration with biomass burning and very hydrophilic populations.
Evaporation of SVOCs within the DASH-SP measurement system could also contribute to sub-1.0 hygroscopic observations, the degree of which would be dependent upon on the volatility of biomass burning smoke, based on chemical composition and fire phase of biomass burning emissions. The majority of sub-1.0 hygroscopicity observations are in the f(RH) dataset during SEAC4RS, where substantial evaporative losses within the instrument are unexpected, thus reducing the likelihood of evaporative losses being the dominant mechanism contributing to sub-1.0 measurements.
While restructuring has been reported across a variety of sizes, RHs, combustion sources, and particle coatings, to our knowledge, evidence has not been reported from ambient measurements. While our datasets cannot allow for identification of this process as having explained sub-1.0 hygroscopicity, it cannot be discounted as a likely contributor. Soot particle morphology is important in climate models, as a recent study found diesel soot particles conducive to forming ice crystals were more compact than those that formed supercooled droplets, with enhanced single scattering albedo, thus reducing top-of-the-atmosphere direct radiative forcing by ~63% [China et al., 2015]. Additionally, better understanding particle restructuring is impactful for mixing state models, as one possibility for deviations in model predictions of GF and measurements is microscopic solid phase restructuring at increased humidity that is not accounted for in hygroscopicity and mixing state models [Lei et al., 2014]. To more robustly study this mechanism in future field projects, we suggest hygroscopicity-measuring instruments develop a prehumidification channel prior to instrument sizing modules, which can be easily switched on/off, to hydrate and collapse particles. When sampling aerosol types vulnerable to restructuring such as biomass burning smoke, a reasonable hypothesis would be that switching between prehumidified and non-prehumidified channels should result in periods of sub-1.0 observations only without prehumidification.
Significant Points:
Ambient measurements of sub-1.0 hygroscopic growth factor (GF) and f(RH)
Measured in multiple regions based on three instruments
Sub-1.0 GFs and f(RH) are observed consistently in biomass burning plumes
Reasons include particle restructuring, optical effects, and volatilization
Acknowledgements
All data used can be obtained from the corresponding author. This research was funded by NASA grants NNX12AC10G and NNX14AP75G. The development of the DASH-SP instrument was funded by ONR grant N00014-10-1-0811. TS acknowledges support from a NASA Earth and Space Science Fellowship (NNX14AK79H).
References
- ASDC: NASA Airborne Science Data for Atmospheric Composition: SEAC4RS, available at: http://www-air.larc.nasa.gov/missions/seac4rs/, doi: 10.5067/Aircraft/SEAC4RS/Aerosol-TraceGas-Cloud, 2015. [DOI]
- Canagaratna MR, et al. (2007), Chemical and microphysical characterization of ambient aerosols with the aerodyne aerosol mass spectrometer, Mass Spectrom Rev, 26(2), 185–222. [DOI] [PubMed] [Google Scholar]
- Carrico CM, Petters MD, Kreidenweis SM, Sullivan AP, McMeeking GR, Levin EJT, Engling G, Malm WC, and Collett JL (2010), Water uptake and chemical composition of fresh aerosols generated in open burning of biomass, Atmos Chem Phys, 10(11), 5165–5178. [Google Scholar]
- Chen H, Hu DW, Wang L, Mellouki A, and Chen JM (2015), Modification in light absorption cross section of laboratory-generated black carbon-brown carbon particles upon surface reaction and hydration, Atmos Environ, 116, 253–261. [Google Scholar]
- China S, et al. (2015), Morphology of diesel soot residuals from supercooled water droplets and ice crystals: implications for optical properties, Environ Res Lett, 10(11). [Google Scholar]
- Crosbie E, Youn JS, Balch B, Wonaschütz A, Shingler T, Wang Z, Conant WC, Betterton EA, and Sorooshian A (2015), On the competition among aerosol number, size and composition in predicting CCN variability: a multi-annual field study in an urbanized desert, Atmos. Chem. Phys, 15(12), 6943–6958. [DOI] [PMC free article] [PubMed] [Google Scholar]
- de Gouw J, and Warneke C (2007), Measurements of volatile organic compounds in the earths atmosphere using proton-transfer-reaction mass spectrometry, Mass Spectrom Rev, 26(2), 223–257. [DOI] [PubMed] [Google Scholar]
- DeCarlo PF, et al. (2006), Field-deployable, high-resolution, time-of-flight aerosol mass spectrometer, Anal Chem, 78(24), 8281–8289. [DOI] [PubMed] [Google Scholar]
- Dennis-Smither BJ, Miles REH, and Reid JP (2012), Oxidative aging of mixed oleic acid/sodium chloride aerosol particles, J Geophys Res-Atmos, 117. [Google Scholar]
- Dua SK, and Hopke PK (1996), Hygroscopicity of indoor aerosols and its influence on the deposition of inhaled radon decay products, Environ Int, 22, S941–S947. [Google Scholar]
- Dusek U, Frank GP, Massling A, Zeromskiene K, Iinuma Y, Schmid O, Helas G, Hennig T, Wiedensohler A, and Andreae MO (2011), Water uptake by biomass burning aerosol at sub- and supersaturated conditions: closure studies and implications for the role of organics, Atmos Chem Phys, 11(18), 9519–9532. [Google Scholar]
- Ghazi R, and Olfert JS (2013), Coating Mass Dependence of Soot Aggregate Restructuring due to Coatings of Oleic Acid and Dioctyl Sebacate, Aerosol Sci Tech, 47(2), 192–200. [Google Scholar]
- Giordano MR, and Asa-Awuku A (2014), Rebuttal to Correspondence on “Changes in Droplet Surface Tension Affect the Observed Hygroscopicity of Photochemically Aged Biomass Burning Aerosol”, Environ Sci Technol, 48(3), 2084–2085. [DOI] [PubMed] [Google Scholar]
- Giordano MR, Short DZ, Hosseini S, Lichtenberg W, and Asa-Awuku AA (2013), Changes in Droplet Surface Tension Affect the Observed Hygroscopicity of Photochemically Aged Biomass Burning Aerosol, Environ Sci Technol, 47(19), 10980–10986. [DOI] [PubMed] [Google Scholar]
- Gysel M, Weingartner E, and Baltensperger U (2002), Hygroscopicity of aerosol particles at low temperatures. 2. Theoretical and experimental hygroscopic properties of laboratory generated aerosols, Environ Sci Technol, 36(1), 63–68. [DOI] [PubMed] [Google Scholar]
- Hand JL, Day DE, McMeeking GM, Levin EJT, Carrico CM, Kreidenweis SM, Malm WC, Laskin A, and Desyaterik Y (2010), Measured and modeled humidification factors of fresh smoke particles from biomass burning: role of inorganic constituents, Atmos Chem Phys, 10(13), 6179–6194. [Google Scholar]
- Hand JL, et al. (2005), Optical, physical, and chemical properties of tar balls observed during the Yosemite Aerosol Characterization Study, Journal of Geophysical Research: Atmospheres, 110(D21), n/a–n/a. [Google Scholar]
- Henning S, et al. (2012), Hygroscopic growth and droplet activation of soot particles: uncoated, succinic or sulfuric acid coated, Atmos Chem Phys, 12(10), 4525–4537. [Google Scholar]
- Hersey SP, Sorooshian A, Murphy SM, Flagan RC, and Seinfeld JH (2009), Aerosol hygroscopicity in the marine atmosphere: a closure study using high-time-resolution, multiple-RH DASH-SP and size-resolved C-ToF-AMS data, Atmos Chem Phys, 9(7), 2543–2554. [Google Scholar]
- Hersey SP, Craven JS, Schilling KA, Metcalf AR, Sorooshian A, Chan MN, Flagan RC, and Seinfeld JH (2011), The Pasadena Aerosol Characterization Observatory (PACO): chemical and physical analysis of the Western Los Angeles basin aerosol, Atmos Chem Phys, 11(15), 7417–7443. [Google Scholar]
- Hersey SP, et al. (2013), Composition and hygroscopicity of the Los Angeles Aerosol: CalNex, J Geophys Res-Atmos, 118(7), 3016–3036. [Google Scholar]
- Huffman JA, Docherty KS, Mohr C, Cubison MJ, Ulbrich IM, Ziemann PJ, Onasch TB, and Jimenez JL (2009), Chemically-Resolved Volatility Measurements of Organic Aerosol from Different Sources, Environ Sci Technol, 43(14), 5351–5357. [DOI] [PubMed] [Google Scholar]
- IPCC (2013), Summary for Policymakers, in Climate Change 2013: The Physical Science Basis. Contribution of Working Group I to the Fifth Assessment Report of the Intergovernmental Panel on Climate Change, edited by Stocker TF, Qin D, Plattner G-K, Tignor M, Allen SK, Boschung J, Nauels A, Xia Y, Bex V and Midgley PM, pp. 1–30, Cambridge University Press, Cambridge, United Kingdom and New York, NY, USA. [Google Scholar]
- Jimenez JL, Bahreini R, Cocker DR, Zhuang H, Varutbangkul V, Flagan RC, Seinfeld JH, O’Dowd CD, and Hoffmann T (2003), New particle formation from photooxidation of diiodomethane (CH2I2), J Geophys Res-Atmos, 108(D10). [Google Scholar]
- Jung E, Albrecht BA, Jonsson HH, Chen YC, Seinfeld JH, Sorooshian A, Metcalf AR, Song S, Fang M, and Russell LM (2015), Precipitation effects of giant cloud condensation nuclei artificially introduced into stratocumulus clouds, Atmos. Chem. Phys, 15(10), 5645–5658. [Google Scholar]
- Khalizov AF, Lin Y, Qiu C, Guo S, Collins D, and Zhang RY (2013), Role of OH-Initiated Oxidation of Isoprene in Aging of Combustion Soot, Environ Sci Technol, 47(5), 2254–2263. [DOI] [PubMed] [Google Scholar]
- Kim PS, et al. (2015), Sources, seasonality, and trends of southeast US aerosol: an integrated analysis of surface, aircraft, and satellite observations with the GEOS-Chem chemical transport model, Atmos. Chem. Phys, 15(18), 10411–10433. [Google Scholar]
- Kreidenweis SM, and Asa-Awuku A (2014), 5.13 - Aerosol Hygroscopicity: Particle Water Content and Its Role in Atmospheric Processes, in Treatise on Geochemistry (Second Edition), edited by Turekian HDHK, pp. 331–361, Elsevier, Oxford. [Google Scholar]
- Lee S-H, Murphy DM, Thomson DS, and Middlebrook AM (2002), Chemical components of single particles measured with Particle Analysis by Laser Mass Spectrometry (PALMS) during the Atlanta SuperSite Project: Focus on organic/sulfate, lead, soot, and mineral particles, Journal of Geophysical Research: Atmospheres, 107(D1), AAC 1–1–AAC 1–13. [Google Scholar]
- Lee S, Yoon SC, Kim SW, Kim YP, Ghim YS, Kim JH, Kang CH, Kim YJ, Chang LS, and Lee SJ (2012), Spectral dependency of light scattering/absorption and hygroscopicity of pollution and dust aerosols in Northeast Asia, Atmos Environ, 50, 246–254. [Google Scholar]
- Lei T, Zuend A, Wang WG, Zhang YH, and Ge MF (2014), Hygroscopicity of organic compounds from biomass burning and their influence on the water uptake of mixed organic ammonium sulfate aerosols, Atmos Chem Phys, 14(20), 11165–11183. [Google Scholar]
- Lewis KA, et al. (2009), Reduction in biomass burning aerosol light absorption upon humidification: roles of inorganically-induced hygroscopicity, particle collapse, and photoacoustic heat and mass transfer, Atmos. Chem. Phys, 9(22), 8949–8966. [Google Scholar]
- Liu BYH (1978), Aerosol Instrumentation - Generation, Standards, Measurement Techniques, and Data Reduction, Staub Reinhalt Luft, 38(2), 43–45. [Google Scholar]
- Lopez-Yglesias XF, Yeung MC, Dey SE, Brechtel FJ, and Chan CK (2014), Performance Evaluation of the Brechtel Mfg. Humidified Tandem Differential Mobility Analyzer (BMI HTDMA) for Studying Hygroscopic Properties of Aerosol Particles, Aerosol Sci Tech, 48(9), 969–980. [Google Scholar]
- Ma XF, Zangmeister CD, Gigault J, Mulholland GW, and Zachariah MR (2013), Soot aggregate restructuring during water processing, J Aerosol Sci, 66, 209–219. [Google Scholar]
- Malm WC, Day DE, Carrico C, Kreidenweis SM, Collett JL, McMeeking G, Lee T, Carrillo J, and Schichtel B (2005), Intercomparison and closure calculations using measurements of aerosol species and optical properties during the Yosemite Aerosol Characterization Study, Journal of Geophysical Research: Atmospheres, 110(D14), n/a–n/a. [Google Scholar]
- Martin M, et al. (2013), Hygroscopic properties of fresh and aged wood burning particles, J Aerosol Sci, 56, 15–29. [Google Scholar]
- Mikhailov E, Vlasenko S, Niessner R, and Pöschl U (2004), Interaction of aerosol particles composed of protein and saltswith water vapor: hygroscopic growth and microstructural rearrangement, Atmos. Chem. Phys, 4(2), 323–350. [Google Scholar]
- Mikhailov E, Vlasenko S, Martin ST, Koop T, and Poschl U (2009), Amorphous and crystalline aerosol particles interacting with water vapor: conceptual framework and experimental evidence for restructuring, phase transitions and kinetic limitations, Atmos Chem Phys, 9(24), 9491–9522. [Google Scholar]
- Mikhailov EF, Vlasenko SS, Podgorny IA, Ramanathan V, and Corrigan CE (2006), Optical properties of soot-water drop agglomerates: An experimental study, J Geophys Res-Atmos, 111(D7). [Google Scholar]
- Modini RL, et al. (2015), Primary marine aerosol-cloud interactions off the coast of California, Journal of Geophysical Research: Atmospheres, 120(9), 4282–4303. [Google Scholar]
- Montgomery JF, Rogak SN, Green SI, You Y, and Bertram AK (2015), Structural Change of Aerosol Particle Aggregates with Exposure to Elevated Relative Humidity, Environ Sci Technol, 49(20), 12054–12061. [DOI] [PubMed] [Google Scholar]
- Onischuk AA, di Stasio S, Karasev VV, Baklanov AM, Makhov GA, Vlasenko AL, Sadykova AR, Shipovalov AV, and Panfilov VN (2003), Evolution of structure and charge of soot aggregates during and after formation in a propane/air diffusion flame, J Aerosol Sci, 34(4), 383–403. [Google Scholar]
- Pagels J, Khalizov AF, McMurry PH, and Zhang RY (2009), Processing of Soot by Controlled Sulphuric Acid and Water CondensationMass and Mobility Relationship, Aerosol Sci Tech, 43(7), 629–640. [Google Scholar]
- Petters MD, and Kreidenweis SM (2007), A single parameter representation of hygroscopic growth and cloud condensation nucleus activity, Atmos Chem Phys, 7(8), 1961–1971. [Google Scholar]
- Petters MD, and Kreidenweis SM (2008), A single parameter representation of hygroscopic growth and cloud condensation nucleus activity - Part 2: Including solubility, Atmos Chem Phys, 8(20), 6273–6279. [Google Scholar]
- Petters MD, and Kreidenweis SM (2013), A single parameter representation of hygroscopic growth and cloud condensation nucleus activity - Part 3: Including surfactant partitioning, Atmos Chem Phys, 13(2), 1081–1091. [Google Scholar]
- Posfai M, Gelencser A, Simonics R, Arato K, Li J, Hobbs PV, and Buseck PR (2004), Atmospheric tar balls: Particles from biomass and biofuel burning, J Geophys Res-Atmos, 109(D6). [Google Scholar]
- Rader DJ, and Mcmurry PH (1986), Application of the Tandem Differential Mobility Analyzer to Studies of Droplet Growth or Evaporation, J Aerosol Sci, 17(5), 771–787. [Google Scholar]
- Rissler J, Pagels J, Swietlicki E, Wierzbicka A, Strand M, Lillieblad L, Sanati M, and Bohgard M (2005), Hygroscopic behavior of aerosol particles emitted from biomass fired grate boilers, Aerosol Sci Tech, 39(10), 919–930. [Google Scholar]
- Russell LM, et al. (2013), Eastern Pacific Emitted Aerosol Cloud Experiment, B Am Meteorol Soc, 94(5), 709–+. [Google Scholar]
- Saide PE, et al. (2015), Revealing important nocturnal and day-to-day variations in fire smoke emissions through a multiplatform inversion, Geophys Res Lett, 42(9), 3609–3618. [Google Scholar]
- Schnitzler EG, Dutt A, Charbonneau AM, Olfert JS, and Jager W (2014), Soot Aggregate Restructuring Due to Coatings of Secondary Organic Aerosol Derived from Aromatic Precursors, Environ Sci Technol, 48(24), 14309–14316. [DOI] [PubMed] [Google Scholar]
- Schwarz JP, Gao RS, Spackman JR, Watts LA, Thomson DS, Fahey DW, Ryerson TB, Peischl J, Holloway JS, Trainer M, Frost GJ, Baynard T, Lack DA, de Gouw JA, Warneke C, and Del Negro LA, (2008), Measurement of the mixing state, mass, and optical size of individual black carbon particles in urban and biomass burning emissions, Geophys Res Lett, 35(13). [Google Scholar]
- Seinfeld JH, and Pandis SN (2012), Atmospheric Chemistry and Physics: From Air Pollution to Climate Change, Wiley. [Google Scholar]
- Shingler T, Crosbie E, Ortega A, Shiraiwa M, Zuend A, Beyersdorf A, Ziemba L, Anderson B, Thornhill L, Perring AE, Schwarz JP, Campazano-Jost P, Day DA, Jimenez JL, Hair JW, Mikoviny T, Wisthaler A, and Sorooshian A (2016), Airborne characterization of sub-saturated aerosol hygroscopicity and dry refractive index from the surface to 6.5 km during the SEAC4RS campaign, J. Geophys. Res, in press. [Google Scholar]
- Shiraiwa M, Pfrang C, Koop T, and Poschl U (2012), Kinetic multi-layer model of gas-particle interactions in aerosols and clouds (KM-GAP): linking condensation, evaporation and chemical reactions of organics, oxidants and water, Atmos Chem Phys, 12(5), 2777–2794. [Google Scholar]
- Sorooshian A, Hersey S, Brechtel FJ, Corless A, Flagan RC, and Seinfeld JH (2008a), Rapid, size-resolved aerosol hygroscopic growth measurements: Differential aerosol sizing and hygroscopicity spectrometer probe (DASH-SP), Aerosol Sci Tech, 42(6), 445–464. [Google Scholar]
- Sorooshian A, Crosbie E, Maudlin LC, Youn J-S, Wang Z, Shingler T, Ortega AM, Hersey S, and Woods RK (2015), Surface and airborne measurements of organosulfur and methanesulfonate over the western United States and coastal areas, Journal of Geophysical Research: Atmospheres, 120(16), 8535–8548. [DOI] [PMC free article] [PubMed] [Google Scholar]
- Sorooshian A, Murphy SN, Hersey S, Gates H, Padro LT, Nenes A, Brechtel FJ, Jonsson H, Flagan RC, and Seinfeld JH (2008b), Comprehensive airborne characterization of aerosol from a major bovine source, Atmos Chem Phys, 8(17), 5489–5520. [Google Scholar]
- Toon OB, et al. (2016), Planning, implementation and scientific goals of the Studies of Emissions and Atmospheric Composition, Clouds and Climate Coupling by Regional Surveys (SEAC4RS) field mission, Journal of Geophysical Research: Atmospheres, n/a–n/a. [Google Scholar]
- Tritscher T, Dommen J, DeCarlo PF, Gysel M, Barmet PB, Praplan AP, Weingartner E, Prevot ASH, Riipinen AI, Donahue NM, and Baltensperger U (2011), Volatility and hygroscopicity of aging secondary organic aerosol in a smog chamber, Atmos. Chem. Phys, 11(22), 11477–11496. [Google Scholar]
- Wang Z, Sorooshian A, Prabhakar G, Coggon MM, and Jonsson HH (2014), Impact of emissions from shipping, land, and the ocean on stratocumulus cloud water elemental composition during the 2011 E-PEACE field campaign, Atmos Environ, 89, 570–580. [Google Scholar]
- Weingartner E, Baltensperger U, and Burtscher H (1995), Growth and Structural-Change of Combustion Aerosols at High Relative-Humidity, Environ Sci Technol, 29(12), 2982–2986. [DOI] [PubMed] [Google Scholar]
- Weingartner E, Burtscher H, and Baltensperger U (1997), Hygroscopic properties of carbon and diesel soot particles, Atmos Environ, 31(15), 2311–2327. [Google Scholar]
- Wonaschütz A, Coggon M, Sorooshian A, Modini R, Frossard AA, Ahlm L, Mülmenstädt J, Roberts GC, Russell LM, Dey S, Brechtel FJ, and Seinfeld JH (2013), Hygroscopic properties of organic aerosol particles emitted in the marine atmosphere, Atmos. Chem. Phys, 13, 9819–9835, doi: 10.5194/acp-13-9819-2013. [DOI] [Google Scholar]
- Xue HX, Khalizov AF, Wang L, Zheng J, and Zhang RY (2009), Effects of Coating of Dicarboxylic Acids on the Mass-Mobility Relationship of Soot Particles, Environ Sci Technol, 43(8), 2787–2792. [DOI] [PubMed] [Google Scholar]
- Youn J-S, Wang Z, Wonaschütz A, Arellano A, Betterton EA, and Sorooshian A (2013), Evidence of aqueous secondary organic aerosol formation from biogenic emissions in the North American Sonoran Desert, Geophys Res Lett, 40(13), 3468–3472. [DOI] [PMC free article] [PubMed] [Google Scholar]
- Youn JS, Crosbie E, Maudlin LC, Wang Z, and Sorooshian A (2015), Dimethylamine as a major alkyl amine species in particles and cloud water: Observations in semi-arid and coastal regions, Atmos Environ, 122, 250–258. [DOI] [PMC free article] [PubMed] [Google Scholar]
- Zhang RY, Khalizov AF, Pagels J, Zhang D, Xue HX, and McMurry PH (2008), Variability in morphology, hygroscopicity, and optical properties of soot aerosols during atmospheric processing, P Natl Acad Sci USA, 105(30), 10291–10296. [DOI] [PMC free article] [PubMed] [Google Scholar]
- Ziemba LD, Thornhill KL, Ferrare R, Barrick J, Beyersdorf AJ, Chen G, Crumeyrolle SN, Hair J, Hostetler C, Hudgins C, Obland M, Rogers R, Scarino AJ, Winstead EL, and Anderson BE (2013), Airborne observations of aerosol extinction by in situ and remote-sensing techniques: Evaluation of particle hygroscopicity, Geophys. Res. Lett, 40(2), 417–422, doi: 10.1029/2012GL054428. [DOI] [Google Scholar]
- Zuend A, Marcolli C, Luo BP, and Peter T (2008), A thermodynamic model of mixed organic-inorganic aerosols to predict activity coefficients, Atmos Chem Phys, 8(16), 4559–4593. [Google Scholar]
- Zuend A, Marcolli C, Booth AM, Lienhard DM, Soonsin V, Krieger UK, Topping DO, McFiggans G, Peter T, and Seinfeld JH (2011), New and extended parameterization of the thermodynamic model AIOMFAC: calculation of activity coefficients for organic-inorganic mixtures containing carboxyl, hydroxyl, carbonyl, ether, ester, alkenyl, alkyl, and aromatic functional groups, Atmos Chem Phys, 11(17), 9155–9206. [Google Scholar]


