

Abstract
Mutations in the GDAP1 gene cause Charcot–Marie–Tooth (CMT) neuropathy. GDAP1 is an atypical glutathione S-transferase (GST) of the outer mitochondrial membrane and the mitochondrial membrane contacts with the endoplasmic reticulum (MAMs). Here, we investigate the role of this GST in the autophagic flux and the membrane contact sites (MCSs) between mitochondria and lysosomes in the cellular pathophysiology of GDAP1 deficiency. We demonstrate that GDAP1 participates in basal autophagy and that its depletion affects LC3 and PI3P biology in autophagosome biogenesis and membrane trafficking from MAMs. GDAP1 also contributes to the maturation of lysosome by interacting with PYKfyve kinase, a pH-dependent master lysosomal regulator. GDAP1 deficiency causes giant lysosomes with hydrolytic activity, a delay in the autophagic lysosome reformation, and TFEB activation. Notably, we found that GDAP1 interacts with LAMP-1, which supports that GDAP1–LAMP-1 is a new tethering pair of mitochondria and lysosome membrane contacts. We observed mitochondria–lysosome MCSs in soma and axons of cultured mouse embryonic motor neurons and human neuroblastoma cells. GDAP1 deficiency reduces the MCSs between these organelles, causes mitochondrial network abnormalities, and decreases levels of cellular glutathione (GSH). The supply of GSH-MEE suffices to rescue the lysosome membranes and the defects of the mitochondrial network, but not the interorganelle MCSs nor early autophagic events. Overall, we show
that GDAP1 enables the proper function of mitochondrial MCSs in both degradative and nondegradative pathways, which could explain primary insults in GDAP1-related CMT pathophysiology, and highlights new redox-sensitive targets in axonopathies where mitochondria and lysosomes are involved.
Introduction
Charcot–Marie–Tooth disease (CMT) and related disorders are a heterogenous group of genetic neuropathies with a complex pathophysiology involving both myelin and axons, and the Schwann cell axonal interactions. The discovery of pathogenic mechanisms underlying the different types of CMT is a crucial point to define molecular targets and design therapeutic approaches (1).
Ganglioside-induced differentiation-associated protein 1 (GDAP1) is an atypical glutathione S-transferase (GST) (2) with glutathione-conjugating and membrane-remodeling activities (3). Mutations in the GDAP1 gene cause Charcot–Marie–Tooth disease, which can be expressed as an autosomal recessive demyelinating neuropathy (4) or as an axonopathy, either recessive (5) or dominant (6–8). Autosomal recessive mutations are associated with an early-onset and severe neuropathy, with most patients being wheelchair-bound by the second decade and having vocal cord paresis (9), while dominant mutations used to be associated with a milder course (10).
GDAP1 is an integral protein of the outer mitochondrial membrane (OMM) (11–13). Our previous studies in embryonic motor neurons (eMNs) of the Gdap1 knockout mouse (Gdap1−/−) and GDAP1 knockdown neuroblastoma cells showed structural defects in mitochondria, mitochondrial network and endoplasmic reticulum (ER) cisternae, associated with abnormal autophagic vesicles (14,15). Additionally, the lack of GDAP1 causes oxidative stress in the peripheral nervous system (16) and fibroblasts (17) and decreases the levels of cellular glutathione (GSH) (18), which is the major redox buffer of the cell (19). Recently, we have also reported an inflammatory response in both spinal cord and sciatic nerve associated with axonal damage in the Gdap1−/− mouse (20).
GDAP1 is also located in the mitochondria-associated membranes (MAMs), the membrane contact sites (MCSs) between mitochondria and ER, and its deficiency reduces the contact between these two organelles (15). Mitochondria come into contact with other organelles not only regulating their own function but also impacting larger inter-organelle networks, which are essential for cell function and tissue homeostasis (21,22). Recently, mitochondria–lysosome MCSs have been identified as regulators of mitochondrial fission via the lysosomal GTPase Ras-related protein Rab-7 (RAB7) (23). Interestingly, GDAP1 also regulates mitochondrial fission and mitochondrial network dynamics (3,11–13). Nevertheless, the scenario of primary pathophysiological insult caused by GDAP1 deficiency remains unclear. In this work, we demonstrate that GDAP1 depletion causes membrane defects in early autophagic vesicles as well as in lysosomes and their contacts with mitochondria. Moreover, GDAP1 interacts with the lysosomal marker LAMP-1, tethering the membranes of these organelles. Glutathione supply suffices to rescue the lysosomal morphology and the mitochondrial network dynamics but not autophagic defects. Overall, our results indicate that GDAP1 enables the proper function of mitochondria and their MCSs in both degradative and nondegradative pathways whose deficiencies are early events in the pathophysiology of CMT.
Results
GDAP1 deficiency impairs basal autophagy
We first investigated the occurrence of basal autophagy. We found by electron microscopy a significant accumulation of autophagic vesicles in eMNs from Gdap1−/− mice (Fig. 1A). This phenotype was confirmed using the GFP-labeled autophagosome marker LC3. Punctate GFP-LC3 was increased in transfected Gdap1−/− eMNs and GDAP1-silenced human neuroblastoma SH-SY5Y cells (hereinafter referred to as G4 cells) (15) stably expressing GFP-LC3 (Fig. 1B). Western blotting analysis showed an increase of lipidated LC3 (LC3-II) levels in both Gdap1−/− eMNs and G4 cells (Fig. 1C and D). To examine the autophagic flux, we analyzed the aggregates forming of p62, whose levels negatively correlate with this flux (24). We found accumulation of p62 aggregates in Gdap1−/− eMNs (Fig. 1E), G4 cells (Fig. 1F) and postnatal spinal cord MNs from Gdap1−/− mice (Supplementary Material, Fig. S1). We did not observe the accumulation of p62 in Gdap1−/− mice brain (Supplementary Material, Fig. S1B), which may be related to the selective neuronal vulnerability to GDAP1 deficiency. To further investigate the autophagic flux we used bafilomycin A1 (BafA1), which prevents late phases of autophagy. BafA1 caused accumulation of p62 aggregates in Gdap1−/− eMNs (Fig. 1E) and G4 cells (Fig. 1F) although to a lesser degree than in controls, suggesting that the fusion of autophagosomes with lysosomes is affected. Western blotting analyses and GFP quantification by flow cytometry after BafA1 treatment also showed reduced LC3-II accumulation in GDAP1-deficient cells (Supplementary Material, Fig. S2A and B) and G4 cells stably expressing GFP-LC3 (Supplementary Material, Fig. S2C). These results indicate that basal autophagy occurs despite GDAP1 depletion, although its efficiency is suboptimal.
Figure 1.
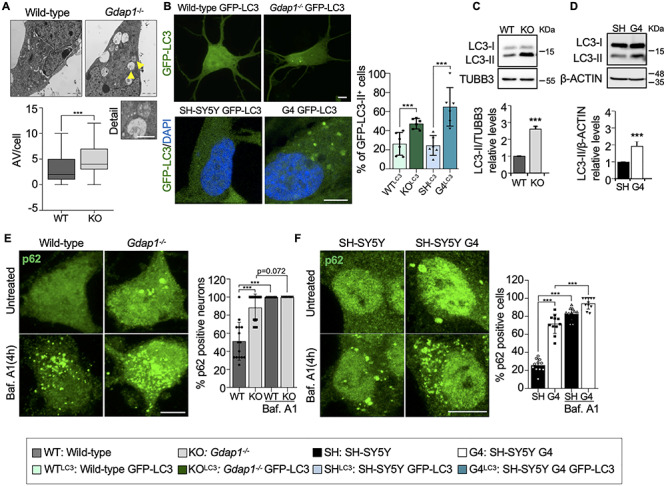
GDAP1 deficiency produces an impairment of basal autophagy. (A) Representative electron microscopy images of two-day cultured eMNs and box-plot of the autophagic vesicles (AV, yellow arrows) per cell (number of neurons: wild-type = 31, Gdap1−/− = 48). The analysis was performed from independent culture preparations (wild-type = 2, Gdap1−/− = 4). Scale bar 2 μm, detail 1 μm. (B) Percentage of punctate GFP-LC3 in transfected eMNs (n = 150 wild-type cells, n = 202 Gdap1−/− cells) and in neuroblastoma cells stably expressing GFP-LC3 (n = SH-SY5Y GFP-LC3 cells, n = 100 SH-SY5Y G4 GFP-LC3 cells; three independent experiments). Scale bars: 10 μm. (C and D) Western blotting of LC3-I and LC3-II in eMNs and neuroblastoma cells with quantification of relative LC3-II protein levels (three independent experiments). (E and F) Percentage of p62-positive eMNs (D; n = 56, 50, 47 and 45 cells, respectively) and neuroblastoma cells (E; n = 287 241 288 and 222 cells, respectively) without treatment and after BafA1 treatment. Three independent experiments. Scale bars: 10 μm. Data information: In (A), the box plot lines correspond from the bottom of the box to top: 25th percentile, median percentile, 75th percentile. The whiskers extend to the minimum and maximum values. In (B–F), data represent mean ± SD and individual values are displayed as dots. Mann–Whitney test (A), Mantel–Haenszel chi-squared test (B, E, F) and Student’s t-test (C, D). *P < 0.05, **P < 0.01, ***P < 0.001.
GDAP1 participates in membrane biogenesis of early autophagic vesicles
GDAP1 function in basal autophagy was further assessed by studying its interaction with autophagy- and MAM-related proteins in SH-SY5Y cells. We performed a series of co-immunoprecipitation (co-IP) experiments of GDAP1 with Acyl-CoA synthetase long-chain family member 1 (ACSL1), Autophagy-related 4 cysteine peptidase (ATG4), coiled-coil myosin-like BCL2-interacting protein (BECLIN-1), Dynamin-related protein 1 (DRP1), LC3-I, LC3-II, RAB7 and SYNTAXIN 17 (STX17) (Fig. 2A–E). We found constitutive interaction of GDAP1 with STX17, LC3-I and LC3-II that were confirmed by proximity ligation assay (PLA) (Fig. 2D and E). These proteins are involved in autophagosome biogenesis and membrane trafficking (25–27). BafA1 or autophagy induction by starvation in Earle’s balanced salt solution (EBSS) treatments did not affect these interactions. In addition, western blotting of subcellular fractions showed GDAP1, STX17 (28), LC3-I and LC3-II bands in MAMs (Fig. 2F), suggesting mitochondria-ER contacts as a platform for their interaction. We found significantly lower levels of LC3-I and LC3-II in MAMs fraction of G4 cells, probably caused by impaired recruitment. Notably, we also found ATG4 in MAMs (Fig. 2F), a redox-regulated cysteine protease that processes cytosolic pro-LC3 for lipidation and binding to autophagosome membranes (29). ATG4 also delipidates LC3-II for autophagosome maturation and LC3 recycling (30,31). Furthermore, since early events of autophagosome formation also include the local synthesis of phosphatidylinositol 3-phosphate (PI3P) in MAMs (28), we visualized PI3P-positive vesicles when GDAP1 is depleted. We transfected into SH-SY5Y and G4 cells the GFP-2xFYVE plasmid, which is a domain that mostly binds PI3P (32). Super-resolution confocal imaging revealed enlarged abnormal PI3P-positive vesicles in G4 cells (Fig. 3A). Altogether, these findings demonstrate that GDAP1 participates in early autophagic events and membrane trafficking initiated in MAMs.
Figure 2.
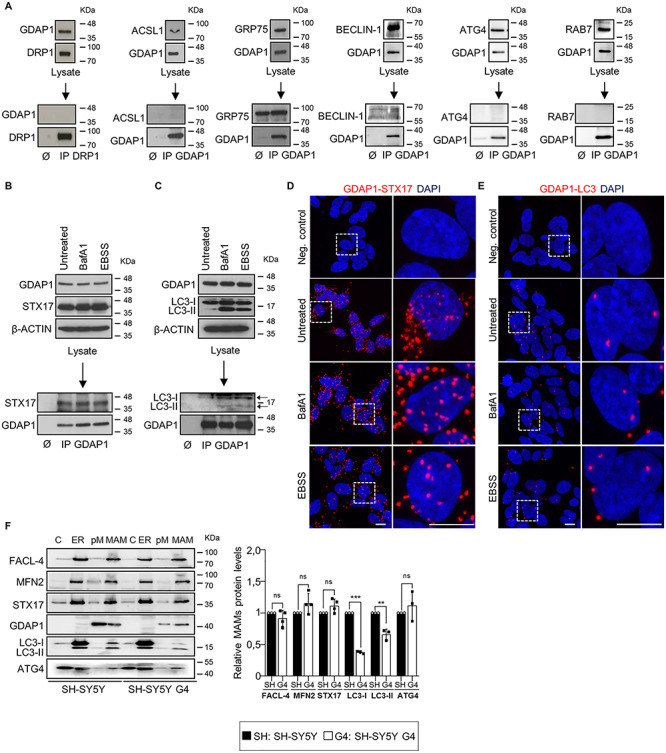
GDAP1 interacts with SYNTAXIN 17 (STX17) and LC3 in MAMs. (A) Negative interactions by co-IP assays of GDAP1 with DRP1 (mitochondrial fission in MAMs), ACSL1 (fatty acid metabolism in MAMs), GRP75 (Ca2+ channel in MAMs), BECLIN-1 (ER-mitochondria tethering and autophagosome formation), ATG4 (unique redox sensor essential for maturation of autophagosomes) and RAB7 (trafficking, maturation, and fusion of endocytic and autophagic vesicles). (B and C) Co-IP assay of endogenous GDAP1 and STX17 (B) or LC3 (C) in SH-SY5Y cells. (D and E) Representative images of the interaction between GDAP1 and STX17 (D) or LC3 (E) in SH-SY5Y cells by PLA from 3 independent experiments. Scale bar: 10 μm. (F) Western blot of subcellular fractions from SH-SY5Y and G4 cells and quantification of relative protein levels in MAMs fraction (three or four independent experiments). C, cytosol; ER, endoplasmic reticulum; pM, pure mitochondria; MAM, mitochondria associated membranes. Data information: In (F), data represent mean ± SD and individual values are displayed as dots. ANOVA followed by Sidak’s post hoc test.
Figure 3.
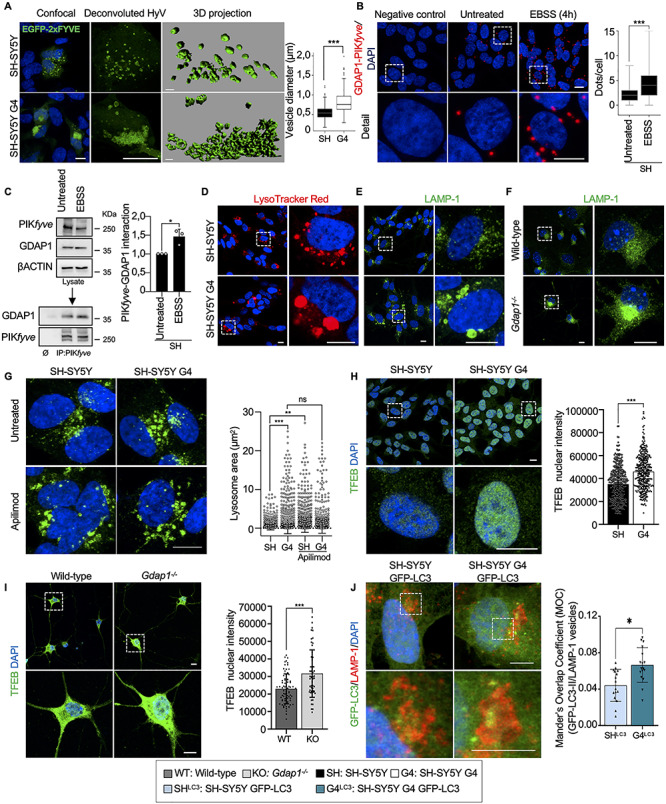
GDAP1 regulates membrane biogenesis in MAMs and the activity of PYKfyve. (A) Representative images of GFP-FYVE positive vesicles in transfected SH-SY5Y and G4 cells. Box-plot shows vesicle diameter (μm). Scale bar: 10 μm, 3D scale bar:1 μm. (B) PLA of GDAP1 and PIKfyve in untreated SH-SY5Y cells and after autophagy induction (EBSS). Quantification of the number of dots per cell is shown in the right panel (n = 261 untreated SH-SY5Y cells and n = 229 SH-SY5Y EBSS cells; three independent experiments). (C) Co-IP assay of endogenous GDAP1 and PIKfyve in SH-SY5Y cells. Quantification is shown in the right panel (three independent experiments). (D–F) Representative images of lysosomes stained with LysoTracker Red (D) or α-LAMP-1 (E) in SH-SY5Y and G4 cells and with α-LAMP-1 in eMNs (F). (G) Representative images of α-LAMP-1 staining in untreated neuroblastoma cells and after Apilimod treatment (left panel) and lysosomal area distribution (right panel) (n = 2339 SH-SY5Y lysosomes, n = 3128 G4 lysosomes, n = 4487 SH-SY5Y Apilimod lysosomes and n = 2338 G4 Apilimod lysosomes; two independent experiments). Scale bar: 10 μm. (H and I) Representative images of TFEB staining and quantification of nuclear TFEB intensity in neuroblastoma cells (H) (n = 459 SH-SY5Y cells, n = 399 G4 cells; three independent experiments) and eMNs (I) (n = 95 Wild-type cells, n = 66 Gdap1−/− cells; three independent primary cultures). Scale bars: 10 μm. (J) Colocalization of GFP-LC3 vesicles with LAMP-1 staining in SH-SY5Y and G4 cells. Analysis of Mander’s Overlapping Coefficient (MOC) of the vesicles is shown in the graphic below (n = 278 SH-SY5Y cells, n = 260 G4 cells; three independent experiments). Scale bars: 10 μm. Data information: In (A, B), the box plot lines correspond from the bottom of the box to top: 25th percentile, median percentile, 75th percentile. The whiskers extend to the minimum and maximum values. Outliers are represented as dots. In (C, G, H, I and J) data represent mean ± SD and individual values are displayed as dots. Mann–Whitney U test (A, B), Student’s t-test (C, H–J) and Kolmogorov–Smirnov test (G). *P < 0.05, **P < 0.01, ***P < 0.001.
GDAP1 deficiency causes enlarged lysosomes that maintain the hydrolytic capacity
Next, we investigated whether GDAP1 contributes to autophagosome maturation by studying its interaction with PIKfyve. This kinase is a master regulator of lysosomes that phosphorylates PI3P to PI(3,5)P2 for vesicle maturation, identity and trafficking (33,34). PLA and co-IP experiments revealed the interaction between GDAP1 and PIKfyve (Fig. 3B and C), which increases after starvation-induced autophagy (EBSS). Either LysoTracker or α-LAMP-1 (Lysosomal-associated membrane protein 1) staining of GDAP1-depleted models showed enlarged perinuclear lysosomes and abnormal distribution of this organelle in G4 cells (Fig. 3D and E), Gdap1−/− eMNs (Fig. 3F) and spinal cord MNs from Gdap1−/− mice (Supplementary Material, Fig. S3). As this lysosomal phenotype is associated with decreased PIKfyve kinase activity (38), we treated SH-SY5Y and G4 cells with Apilimod, a specific PIKfyve inhibitor (Fig. 3G). After treatment, we observed a significant increase in the lysosomal area in SH-SY5Y cells and not in G4, suggesting that PIKfyve was already inhibited in G4 cells. This finding indicates that there is a loss of PIKfyve activity when GDAP1 is depleted. We also quantified the nuclear translocation of the transcription factor EB (TFEB), which is a crucial regulator of autophagy by promoting autophagosome formation, lysosomal biogenesis and function (35–37). TFEB nuclear levels were significantly increased in G4 cells (Fig. 3H) and Gdap1−/− eMNs (Fig. 3I), supporting the inhibitory effect on PIKfyve (38) and suggesting an impaired lysosomal function when GDAP1 is depleted. To know if autophagosome defects also contribute to lysosomal defects, we immunostained with α-LAMP-1 both SH-SY5Y and G4 cells stably expressing GFP-LC3. Although we observed a significant increase of LAMP-1+/LC3-II+ vesicles in G4 cells (Fig. 3J), most of the vesicles were LAMP-1+/LC3-II– that confirmed their lysosomal nature in both SH-SY5Y and G4 cells.
Then, we wondered if the enlargement of lysosomes affected their enzymatic activity. We found no changes either in lysosomal pH (LysoSensor Green) or in CATHEPSIN B activity (Magic Red) in G4 cells (Supplementary Material, Fig. S4). On the other hand, after BafA1 treatment, we observed morphological differences in G4 cells, suggestive of a delay in the autophagic lysosome reformation (ALR) (39) (Supplementary Material, Fig. S4A, detail). This finding would further support that PYKfyve, which regulates ALR (40), needs GDAP1 for proper activity. These results argue that GDAP1 regulates the activity of PYKfyve for the maturation of lysosomal membranes regardless of their hydrolytic capacity.
GDAP1–LAMP-1 is a tethering couple of mitochondria-lysosome MCSs
We analyzed how GDAP1 is related to lysosomes. We found by western blotting a GDAP1 band in lysosome-enriched fractions from SH-SY5Y cells (Fig. 4A). These fractions were negative for other mitochondrial and peroxisomal markers. To further investigate whether GDAP1 is located in lysosomes, we transiently overexpressed GDAP1 in SH-SY5Y cells and stained with α-GDAP1, α-LAMP-1 and MitoTracker Deep Red. Super-resolution confocal imaging revealed that GDAP1 is exclusively located at mitochondria (Fig. 4B). We then hypothesized that GDAP1, located in the OMM could be resident of the MCSs between these organelles. Co-IP assays in untransfected SH-SY5Y cells detected the constitutive interaction of GDAP1 with the lysosomal membrane protein LAMP-1 in untreated cells and after BafA1 or EBSS treatments (Fig. 4C). Consistent with co-IP data, PLA experiments confirmed the GDAP1–LAMP-1 interaction. We used two different α-LAMP-1 antibodies that recognize either the carboxy-terminus (α-LAMP-1-Ct) or a luminal epitope of the protein. We found a larger number of PLA spots using α-GDAP1 and α-LAMP-1-Ct antibodies, which recognize exposed epitopes on the outer surface of mitochondria and lysosomes, respectively. The number of PLA spots was significantly lower when GDAP1 is depleted (G4 cells) or the α-LAMP-1 epitope is located in the lysosome lumen (Fig. 4D). Hence, GDAP1 is not located at the lysosome membrane but rather it associates with lysosomes by its interaction with LAMP-1 in mitochondria–lysosome MCSs. We also examined mitochondria–lysosome MCSs in cultured WT and Gdap1−/− eMNs. We found PLA spots in both soma and axons of WT eMNs whilst they were absent in Gdap1−/− eMNs (Fig. 4E). The location of mitochondria–lysosome MCSs along the eMNs axons (Fig. 4E, detail) is intriguing, and therefore, we seek to visualize these contacts in SH-SY5Y in vivo by intensity-based image segmentation of time-lapse images (Supplementary Material, Fig. S5). We identified mitochondria–lysosome colocalization signal in SH-SY5Y soma and neurites as well (Fig. 4F), thus, indicating a role for mitochondria–lysosome MCSs along axons.
Figure 4.
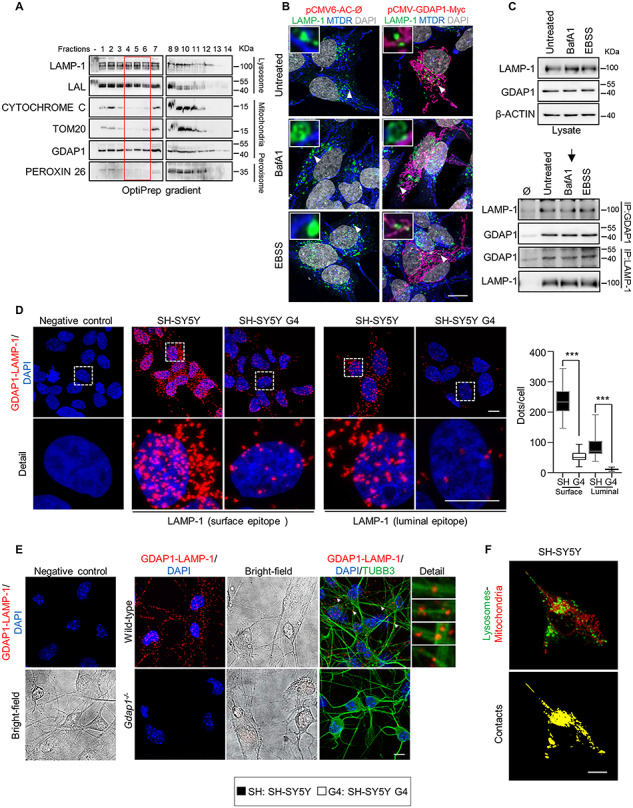
GDAP1 interacts with the lysosomal-associated membrane protein LAMP-1. (A) Western blotting of enriched lysosome fractions isolated from SH-SY5Y cells. The red box marks the pure lysosome fractions. (B) SH-SY5Y cells transfected with pCMV-GDAP1-Myc and stained with α-LAMP-1 and MitoTracker Deep Red after different treatments. Deconvoluted images and magnification are shown (insets). Scale bar: 10 μm. (C) Co-IP assay of endogenous GDAP1 and LAMP-1 in SH-SY5Y cells. (D) PLA assay of endogenous GDAP1 and LAMP-1 interaction in SH-SY5Y and G4 cells with two specific epitope-LAMP-1 antibodies. Quantification of the number of dots per cell is shown in the right panel (n = 54 SH-SY5Y cells, n = 29 G4 cells, n = 22 SH-SY5Y cells, n = 42 G4 cells). Scale bar 10 μm. (E) PLA assay of endogenous GDAP1 and LAMP-1 interaction in wild-type and Gdap1−/− eMNs. The bright field, a complementary image with TUBB3 staining and magnification details of axonal interactions are shown. Scale bars: 10 μm. (F) A sample frame (up) of the confocal live imaging of SH-SY5Y cells overexpressing LAMP1-GFP and stained with MitoTracker Deep Red. Intensity-based image segmentation (identification of lysosomes and mitochondria) was applied to each video frame and the colocalization structures were then isolated. Maximum projection of the 2D + t volume generated from the colocalization at each video frame is shown (down). Scale bar: 10 μm. Data information: In (D) the box plot lines correspond from the bottom of the box to top: 25th percentile, median percentile, 75th percentile. The whiskers extend to the minimum and maximum values. Mann–Whitney U test ***P < 0.001.
We next examined how GDAP1 knockdown might be affecting mitochondria–lysosome MCSs by using super-resolution confocal imaging. GDAP1 depletion markedly increased the distance between mitochondria and lysosomes (Fig. 5A–C) as well as the distribution of the four contact event categories (see Methods) according to the distance between these organelles (Fig. 5D). G4 cells showed a decrease of contacts (≤80 nm) and possible contacts (80–150 nm) whereas the vicinity (150–300 nm) and far populations (>300 nm) were increased (Fig. 5D and E). We also observed a significant presence of engulfment events (lysosome enveloping mitochondria) in G4 cells (Fig. 5F). Besides, time-lapse cell imaging (Supplementary Material, Fig. S5) of mitochondria–lysosome MCSs in G4 cells showed a reduction of mitochondria–lysosome MCSs surface (Fig. 5G and Supplementary Material, Movies S1, S2, S4 and S5) and contact duration (Fig. 5H and Supplementary Material, Movies S3 and S6). Collectively, these data demonstrated that GDAP1–LAMP-1 is a new tethering pair of mitochondria–lysosome MCSs, which is altered by GDAP1 depletion.
Figure 5.
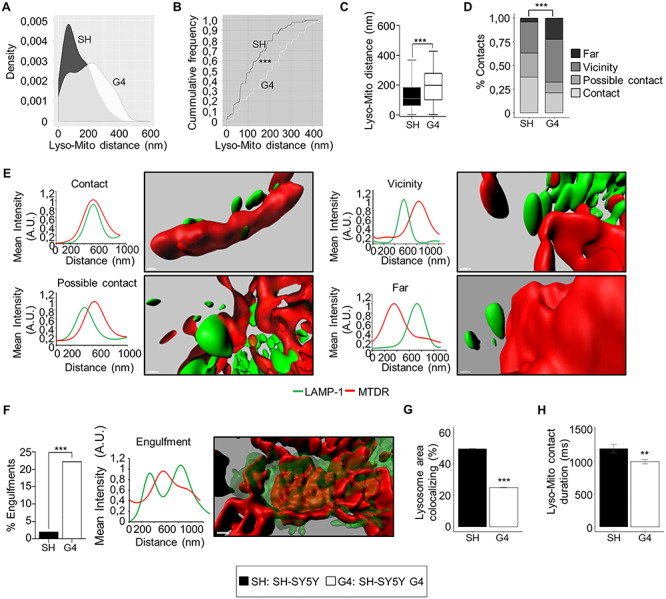
GDAP1 and LAMP-1 is a new tethering pair of mitochondria-lysosomes MCSs. (A) Comparative Kernel density plots of lysosome-mitochondria distance in SH-SY5Y and G4 cells. (B) Cumulative distribution plot of lysosome-mitochondria distance in SH-SY5Y and G4 cells. (C) Distance between lysosomes and mitochondria in SH-SY5Y (n = 100 total events) and G4 (n = 104 total events) cells. (D) Percentage of events in the four categories (contact, possible contact, vicinity and far) in SH-SY5Y (n = 100 total events) and G4 (n = 104 total events) cells. (E) Representative 3D images of the four mitochondria–lysosome event categories and the corresponding intensity profiles of MTDR (red channel) and LAMP-1 (green channel) along an ideal straight line crossing the event. Scale bar: 500 nm. (A.U: arbitrary units). (F) Percentage of engulfment events in SH-SY5Y (n = 100 total events) and G4 (n = 104 total events) cells. A representative 3D images of and engulfment event and the corresponding intensity profile of MTDR (red channel) and LAMP-1 (green channel) along an ideal straight line (white) crossing the event. Scale bar: 500 nm. (A.U: arbitrary units). (G) Percentage of total lysosome area colocalizing with mitochondria (n = 3600 video frames form 8 SH-SY5Y cells), n = 3150 video frames from 7 G4 cells). (H) Duration (ms) of lysosome-mitochondria contacts (n = 10 658 contacts from 8 SH-SY5Y cells), n = 19 661 contacts from 7 G4 cells. Data information: In (C), the box plot lines correspond from the bottom of the box to top: 25th percentile, median percentile, 75th percentile. The whiskers extend to the minimum and maximum values. In (F, G and H) data represent mean ± SD. Kolmogorov–Smirnov test (B), Mann–Whitney U test (C), Pearson’s Chi-squared test (D), Fisher’s exact test (F) and Student’s t-test (G and H). *P < 0.05, **P < 0.01, ***P < 0.001.
Glutathione supply rescues lysosome and mitochondrial network abnormalities caused by GDAP1 depletion
As GDAP1 has been proposed to be a sensor for cellular redox status (3,16), we investigate whether the effects observed by the depletion of GDAP1 are related to changes in redox homeostasis of the cell. We detected significantly lower levels of GSH in G4 cells and Gdap1−/− eMNs (Fig. 6A and B), which led us to perform rescue experiments with GSH-reduced ethyl ester (GSH-MEE). The supply of GSH-MEE did not rescue autophagosome accumulation linked to basal autophagy slow-down (Fig. 6C). In contrast, GSH-MEE did rescue the aberrant lysosomal morphology in G4 cells (Fig. 6D) and Gdap1−/− eMNs (Fig. 6E). As lysosomes and mitochondria–lysosome MCSs regulate mitochondrial network dynamics (23), we performed rescue experiments to analyze GSH-MEE effect on 3D volume models of mitochondrial network (Fig. 7A–P and Supplementary Material, Fig. S6). In untreated G4 cells, the mitochondrial network showed a significant increase in volume, length and number of branchpoints and endpoints, as well as a reduction in the number of substructures (individual mitochondria and subnetworks). GSH-MEE supply rescued all these mitochondrial network abnormalities (Fig. 7), while the number of mitochondria–lysosome contacts was further decreased; however, the supply of GSH-MEE caused these organelles to come closer (Fig. 7Q) and a reduction of mitochondria engulfment events in G4 cells (Fig. 7R), suggesting a reduction of dysfunctional mitochondria and lysosomes. Therefore, the antioxidant environment after GSH-MEE supply rescued the lysosome membranes and mitochondrial network dynamics, but not the defects in the autophagic degradative pathway.
Figure 6.
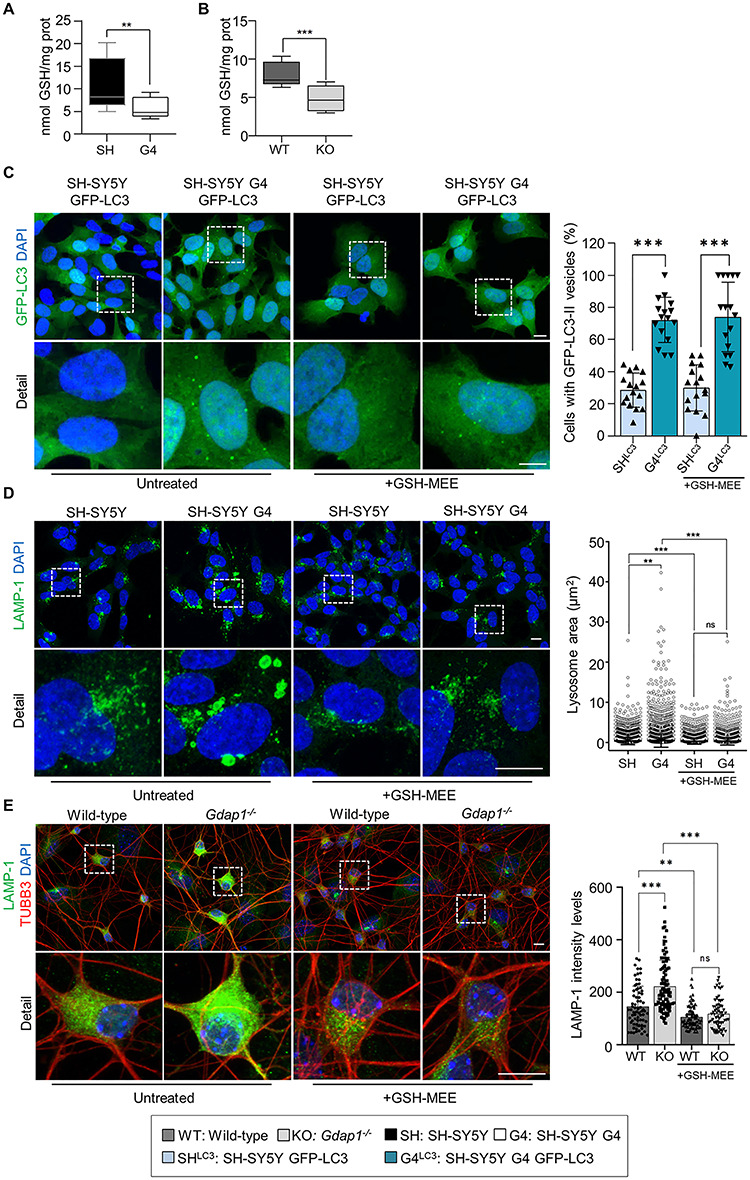
Restoration of cellular GSH levels rescues lysosomal morphology in GDAP1 depleted cells. (A and B) GSH levels (nmol/mg protein) in SH-SY5Y and G4 cells (n = 6 independent experiments) (A) and in Gdap1−/− eMNs (n = 3 independent experiments) (B). (C) Percentage of GFP-LC3 vesicles in untreated neuroblastoma cells stably expressing GFP-LC3 and after GSH-MEE treatment (n = 278 SH-SY5Y cells, n = 260 G4 cells, n = 181 SH-SY5Y GSH cells and n = 111 G4 GSH cells; three independent experiments). (D) Representative images of α-LAMP-1 staining in untreated neuroblastoma cells and after GSH-MEE treatment (left panel) and lysosomal area distribution (right panel) (n = 7653 SH-SY5Y lysosomes, n = 9404 G4 lysosomes, n = 6181 SH-SY5Y GSH-MEE lysosomes and n = 6504 G4 GSH-MEE lysosomes; three independent experiments). Scale bars: 10 μm. (E) Representative images of α-LAMP-1 staining in untreated MNs and after GSH-MEE treatment (left panel) and quantification of LAMP-1 intensity levels (right panel) (n = 71 Wild-type cells, n = 92 Gdap1−/− cells, n = 83 Wild-type GSH-MEE cells, and n = 70 Gdap1−/− GSH-MEE cells; two independent primary cultures). Scale bars: 10 μm. Data information: In (A and B), the box plot lines correspond from the bottom of the box to top: 25th percentile, median percentile, 75th percentile. The whiskers extend to the minimum and maximum values. In (C–E) data represent mean ± SD and individual values are displayed as dots. Mann–Whitney U test (A and B), ANOVA followed by Sidak’s post hoc test (C and E) and Kolmogorov–Smirnov test (D). *P < 0.05, **P < 0.01, ***P < 0.001.
Figure 7.
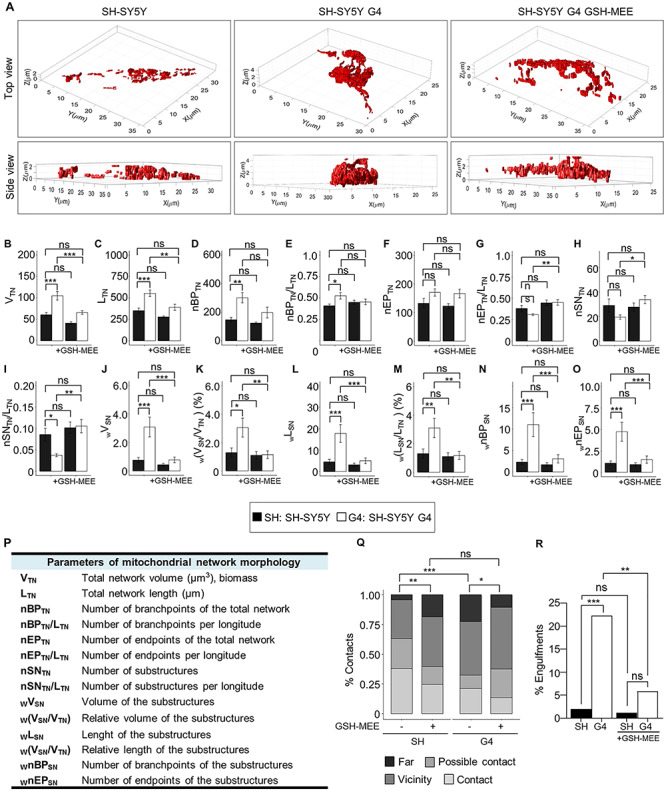
Restoration of cellular GSH levels rescues mitochondrial network dynamics in GDAP1 depleted cells. (A) Representative 3D volume models of the mitochondrial network in SH-SY5Y, G4 and GSH-MEE-treated G4 cells. (B–O) Assessment of morphological mitochondrial parameters for the total network (B–I) (n = 20 SH-SY5 cells, n = 22 G4 cells, n = 21 SH-SY5Y GSH-MEE cells, and n = 24 G4 GSH-MEE cells) and network sub-structures (J–O) (n = 582 structures from 20 SH-SY5Y cells, n = 432 structures from 22 G4 cells, n = 584 structures from SH-SY5Y GSH-MEE 21 cells and n = 815 structures from 24 cells). (P) Table summarizing measured mitochondrial parameters. (Q and R) Percentage of contacts in the four categories (Q) and engulfment events (R) in untreated SH-SY5Y and G4 cells or after GSH-MEE treatment (n = 100 SH-SY5Y cells, n = 104 G4 cells, n = 82 SH-SY5Y GSH-MEE cells and n = 102 G4 GSH-MEE cells). Data information: In (B–O) data represent mean ± SEM. ANOVA followed by Tukey’s post hoc test (A–O), Pearson’s Chi-squared (Q) and Fisher’s exact tests (R). *P < 0.05, **P < 0.01, ***P < 0.001, ns, non-significant.
Discussion
Here, we report novel functions of GDAP1 linked to its localization in the OMM (12) and to its potential GST-like activity (2), which could explain primary insults in GDAP1-related CMT pathophysiology. We previously described that GDAP1 is part of the mitochondrial MCSs with the ER (MAMs), and of the mitochondria–ER–plasmatic membrane contacts (Ca2+ microdomains), and that MCSs are affected by GDAP1 depletion (14,15). Additionally, GDAP1 reduction affects mitochondrial movement, which would cause defects in the structure and function of mitochondrial membrane contacts, as we found in the mitochondria–ER–plasmatic membrane contacts that regulate the store-operated Ca2+ entry (SOCE) activity (15,41,42).
In this study, we found that GDAP1 function is relevant in cellular pathways where mitochondria and lysosomes act in a coordinated manner (Fig. 8). In first place, GDAP1 participates in early autophagic events by interacting with STX17, LC3-I and LC3-II; all of which are involved in autophagosome biogenesis and membrane trafficking (25–27,29,30). As GDAP1 and these interactors have been found in MAMs, it is tempting to propose the direct participation of GDAP1 in early events of membrane biogenesis in MAMs. The depletion of GDAP1 causes abnormal autophagosomes contributing to the slow-down of autophagic pathways. Moreover, our GDAP1-deficient models also showed membrane defects of lysosomes thus supporting that mitochondrial dysfunction affects lysosomes structure, as previously reported (43). We observed enlarged lysosomes, whose mobility and fusion with autophagosomes may be compromised, affecting both basal and induced autophagy by defective autophagic flux (Fig. 8). However, the lysosomal defects related to GDAP1 depletion were only structural since the lysosomes did not lose their hydrolytic capacity. Importantly, lysosome morphology but not the autophagosome phenotype was rescued by restoring cellular GSH levels in GDAP1-deficient cells, indicating that membrane defects of these vesicles have a different origin. Regarding lysosomes rescue, it has been reported that PIKfyve inhibition activates TFEB (44) and causes lysosome coalescence (38) as we found here. Given that FYVE-PI3P binding is pH dependent (45) and consequently sensitive to redox state (19), we propose that GDAP1 interacts with PYKfyve to maintain the redox state for proper PYKfyve binding to PI3P in membranes. Of note, GDAP1-PYKfyve interaction increases with the induction of autophagy when the activity of PYKfyve for vesicle maturation is more necessary.
Figure 8.
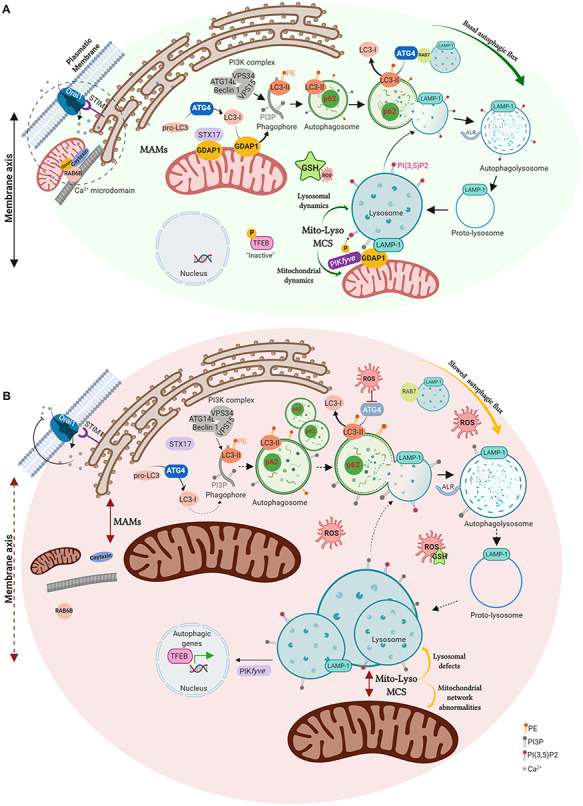
GDAP1 function in mitochondrial MCSs and proposed pathophysiological mechanisms in deficient cells. (A) GDAP1 is located in both the outer mitochondrial membrane and the mitochondria-associated membranes (MAMs), the membrane contact sites (MCSs) between mitochondria and ER. GDAP1 participates in membrane biogenesis of early autophagic vesicles, interacting with STX17 and LC3-I/II, allowing proper basal autophagic flux. GDAP1 through its interaction with the lysosomal protein LAMP-1, constitutes a new tether of mitochondria-lysosome MCSs, regulating mitochondrial and lysosomal dynamics. GDAP1 also interacts with the kinase PIKfyve, involved in lysosomal identity, maturation, and transport. The figure also includes the known participation of GDAP1 in both retrograde and anterograde movements mediated by RAB6 and caytaxin, respectively, which locates mitochondria at Ca2+ microdomains. (B) Cells lacking GDAP1 present an oxidative microenvironment due to a decrease in GSH levels. The depletion of GDAP1 causes defects in vesicle biogenesis from MAMs, leading to autophagosome accumulation and slowing down the autophagic flux. The lack of GDAP1 also affects mitochondria-lysosome MCSs inducing (1) enlarged lysosomes and the activation of TFEB, which is recruited to the nucleus activating the expression of autophagic genes and (2) mitochondrial network abnormalities. In Ca2+ microdomains, mitochondrial localization is also altered affecting SOCE activity. Illustration created with BioRender (https://biorender.com/).
Notably, we also found that GDAP1 is located in mitochondria–lysosome MCSs, another mitochondrial membrane contact, that links this protein with lysosomal biology (Fig. 8). Indeed, we show that GDAP1–LAMP-1 is a new tethering pair of mitochondria–lysosome MCSs, where GDAP1 increases the affinity of one organelle for the other. In our models, GDAP1 reduction affects both the structure and function of these MCSs, causing lysosomes to coalesce and mitochondrial network defects. Since mitochondria–lysosome MCSs regulate mitochondrial fission via RAB7 (23), defective MCSs between these organelles could explain mitochondrial network abnormalities related to GDAP1 deficiency (12,13,15,44). The supply of GSH in GDAP1-depleted cells rescue all mitochondrial network abnormalities including the number of substructures suggesting a link between mitochondrial fission and the redox state (18). The relevance of GST activity in the regulation of mitochondrial function has been recently reported for the role of the cytosolic glutathione S-transferase Gfzf upon mitochondrial network in axons (46). Previous studies on GDAP1 relation with cellular redox state showed that overexpression of this protein increases GSH in neuronal cells whereas its knockdown causes sensitivity to oxidative stress (18), which would support GDAP1 GST activity. However, the canonical GST activity of GDAP1 is still controversial (3,11,47,48) and recent structural data showed that GDAP1 is not capable of binding GSH in the G-domain but retains binding of the substrate in the H-domain (47). These findings are consistent with a putative role of GDAP1 as a sensor of cellular oxidative stress (3,16,18,47), which would also explain the cellular oxidative state caused by GDAP1 depletion.
GSH rescue of lysosome membranes and mitochondrial network dynamics but not of their contacts further support the GDAP1 tethering function of mitochondrial MCSs. Given that very few proteins have now been found to be pure tethers (49), we propose that GDAP1 is a tether that also regulates or senses the redox state in mitochondrial MCSs and, perhaps also, through its remodeling membrane activity (3). The uniqueness of mitochondrial MCSs functions in terms of its redox state regulation has not been studied. Mitochondria-organelle contacts constitute membrane domains that integrate organelle communication and function with cellular metabolism and homeostasis (22). Our findings place GDAP1 as part of this network regulating both mitochondria-lysosome MCSs and mitochondria-lysosome degradative and nondegradative pathways. Neurons are particularly sensitive to disruption of both mitochondria and lysosome function and combined defects of these organelles are observed in many neurodegenerative diseases, also in hereditary neuropathies (50). The absence of GDAP1 especially affects neurons and long axons of the peripheral nerves and now it seems that the abnormal changes of the redox state in ER–mitochondria–lysosome membrane axis can be a primary insult that causes Charcot–Marie–Tooth disease: the contacts between mitochondria and lysosomes may play a relevant role not only in the neuronal soma but also within axons. Finally, our results open new target pathways in the axonal pathophysiology in peripheral neuropathies like CMT disease, but also in the axonopathy associated with neurodegenerative diseases, where mitochondria and lysosomes are involved.
Materials and Methods
Reagents
Plasmids
The following plasmids were used: mGFP-LAMP (Addgene plasmid #34831), eGFP–LC3 was a gift from Dr Erwin Knecht (Addgene #21073), pEGFP-2xFYVE was a gift from Dr Pascual Sanz, pCMV6-AC-Ø and pCMV-GDAP1-Myc plasmid (15).
Antibodies and probes
The following antibodies were used: ACSL1 rabbit antibody (Cell Signaling, #4047), ATG4B mouse antibody (MBL, M134-3), ATG4B rabbit antibody (Abcam, ab154843), BECLIN-1 rabbit antibody (Cell Signaling #3738), β-ACTIN mouse antibody (Sigma-Aldrich, A5316), TUBB3 rabbit antibody (Sigma-Aldrich, T2200), TUBB3 mouse antibody (Promega, G7121), DRP1 mouse antibody (BD Biosciences, 611113), FACL-4 mouse antibody (Santa Cruz, sc-365230), GDAP1 rabbit antibody (Sigma-Aldrich, HPA024334), GDAP1 mouse antibody (Abcam, ab194493), GRP75 rabbit antibody (Santa Cruz, sc-13967), HA-probe mouse antibody (Santa Cruz, sc-7392), LAMP-1 rabbit antibody (Sigma-Aldrich, L1418 and Abcam ab24170), LAMP-1 mouse antibody (DSHB, H4A3), LC3 mouse antibody (LifeSpan Biosciences, LS-C165694), LC3B rabbit antibody (Sigma-Aldrich, L7543), MITOFUSIN-2 rabbit antibody (Sigma-Aldrich, M6319), PIKfyve mouse antibody (Santa Cruz, sc-100408), p62/SQSTM1 rabbit antibody (Sigma-Aldrich, P0067), RAB7 mouse antibody (Sigma-Aldrich, R8779), SYNTAXIN 17 rabbit antibody (Sigma-Aldrich, HPA001204), TFEB rabbit antibody (LifeSpan Biosciences, LS-C353036), TOM20 mouse antibody (BD Biosciences, 612278), V5 rabbit antibody (Sigma-Aldrich,V8137) and Alexa fluorophore-conjugated secondary antibodies from Molecular Probes (Invitrogen). MitoTracker Deep Red, LysoTracker Red DND-99 and LysoSensor Green DND-189 were from Molecular Probes and Magic Red™ cathepsin B reagent was from Immunochemistry Technologies.
Drugs and treatments
For the induction of autophagy by amino acid starvation cells were washed three times with PBS and cultured in Earle’s Balanced Salt Solution (EBSS, Thermo Fisher) for 4 or 24 h at 37°C. The PIKfyve kinase inhibitor Apilimod (Selleckchem) was used at 20 nm for 60 min at 37°C. The specific inhibitor of vacuolar-type H+-ATPase Bafilomycin A1 (Merck) was used at 200 nm for 30 min or 4 h at 37°C. The antioxidant glutathione reduced ethyl ester (GSH-MEE, Sigma-Aldrich) was used at 1 mm for 24 h at 37°C.
Animals and embryonic motor neuron (eMN) primary culture
Gdap1 knockout (Gdap1−/−) mice were previously generated and characterized in our laboratory (14). All the animals were kept under controlled temperature (23°C) and humidity (60%) on a 12 h light/dark cycle with access to food and water ad libitum. eMN cultures were prepared from 13.5 embryonic day (E13.5) mouse spinal cord as previously described with some modifications (14). Briefly, mouse embryo spinal cords were dissected, and the dorsal half removed. Ventral spinal cords were dissociated mechanically after trypsin treatment (0.025% trypsin in HBSS) and collected under a 4% bovine serum albumin (BSA) cushion. The largest cells were isolated by centrifugation (10 min at 520g) using iodixanol density gradient purification. The collected cells were finally suspended in a tube containing: Neurobasal (Life technologies) supplemented with B27 (Life technologies), 2% horse serum (Life technologies), 1× glutamax (Life technologies), and a cocktail of recombinant neurotrophins: 1 ng/ml BDNF, 10 ng/ml GDNF, 10 ng/ml CNTF, and 10 ng/ml HGF (PreProtech). Isolated eMNs were plated on poly-DL-ornithine/laminin-coated surfaces and grown in a 5% CO2 incubator at 37°C. media was changed every 2–3 days and 2 μm AraC (Sigma-Aldrich) was added to the culture medium to limit the growth of non-neuronal cells. eMNs were transfected with Lipofectamine™ 2000 reagent (Invitrogen) according to manufacturer’s instructions.
Neuroblastoma cell culture
SH-SY5Y and SH-SY5Y G4 (15) neuroblastoma cell lines were cultured in Dulbecco’s Modified Eagles’s Medium/Nutrient mixture F-12 (DMEM-F12, Sigma-Aldrich) supplemented with 10% fetal bovine serum (Sigma-Aldrich), 2 mm l-glutamine (Sigma-Aldrich) and 100 mg/ml penicillin–streptomycin (Sigma-Aldrich), at 37°C in a 5% CO2 incubator. SH-SY5Y G4 cell line was additionally supplemented with 2 cg/ml puromycin (Sigma-Aldrich) to maintain the selection and GFP-LC3 stable cell lines were selected in the presence of 500 μg/ml geneticin (G418 Sigma-Aldrich). Neuroblastoma cells were transfected with FuGENE Transfection Reagent (Promega) according to the manufacturer’s instructions.
Transmission electron microscopy
Isolated eMNs were seeded onto poly-D-lysine/laminin-coated Lab-Tek chamber slides of 2 wells (Nalge Nunc International), fixed after 24 h of culture in 2.5% glutaraldehyde for 1 h at 37°C and processed for TEM as previously reported (51).
Western blot and co-immunoprecipitation assays (co-IP)
Cells were homogenized in lysis buffer (50 mm Tris HCl pH 7.4, 1.5 mm MgCl2, 5 mm EDTA, 1% Triton X-100, 50 mm NaF and 1 mm Na2VO3) containing a protease inhibitor cocktail (Complete Mini-Protease Inhibitor Cocktail, Roche). Homogenates were centrifuged at 13200 rpm (FA-45-30-11 Rotor) for 15 min at 4°C and the protein concentration of the supernatant was quantified by BCA method (Thermo Fisher Scientific), resolved in sodium dodecyl sulfate-polyacrylamide gels (SDS-Page) and transferred onto Amersham Hybond PVDF membranes (GE Healthcare). The membranes were blocked with 5% defatted-milk or bovine serum albumin in TBS-0.1% Tween 20 buffer (25 mm Tris, 50 mm NaCl, 2.5 mm KCl, 0.1% Tween-20). Afterward the membranes were blotted with the specific primary antibodies, which were detected using secondary antibodies coupled to horseradish peroxidase. Proteins were processed for chemiluminescence with Amersham ECL Prime Western Blotting Detection Reagent and visualized by iBright™ CL1000 Imaging System (Thermo Fisher Scientific). Bands intensity was measured using ImageJ (NIH, http://rsb.info.nih.gov/ij).
For immunoprecipitation assays, 1 mg of total lysate was incubated with the specific antibody for 6–8 h at 4°C followed by incubation with Protein G Sepharose™ 4 Fast Flow (GE, Healthcare) overnight at 4°C. Beads were softly washed with lysis buffer, resuspended in Laemmli Buffer, heated at 95°C and analyzed by SDS-Page and western blot.
Immunofluorescence
Cells were seeded onto glass coverslips, washed with PBS and fixed in pre-warmed 4% paraformaldehyde for 20 min at room temperature. Cells were permeabilized with 0.2% Triton in PBS for 30 min and they were blocked with 1% BSA and 4% serum in PBS. The specific primary antibodies were incubated overnight at 4°C and the secondary conjugated antibodies were incubated for 1.5 h at room temperature. The coverslips were mounted with Fluoromount-G with DAPI (4′,6′-diamidino-2-phenylindole). To visualize mitochondria or lysosomes, cells were loaded with 200 nm MitoTracker Deep Red for 30 min at 37°C or with 75 nm LysoTracker Red DND-99 for 45 min at 37°C, respectively.
eMNs were washed with PB 0.1 M and fixed in pre-warmed 4% paraformaldehyde for 20 min at room temperature. Cells were permeabilized and blocked with BSA 4%—Triton 0.5% in PB 0.1 M for 1.5 h. The following steps are explained above.
For immunostaining of autophagic markers in tissues, sections of brains and spinal cords were dewaxed, and antigenic unmasking was carried out. The tissues were blocked with 4% BSA 0.1% Triton and 5% goat serum for 2 h at room temperature. After several wash steps, the sections were incubated with the corresponding primary antibodies overnight at 4°C in a humidity chamber. The secondary antibody was added after washed with PBS, and the sections were mounted with Fluoromount-G with DAPI.
Proximity ligation assay
Cells were seeded onto glass coverslips, washed with PBS, fixed in pre-warmed 4% paraformaldehyde for 20 min at room temperature and permeabilized with ice-cold methanol at −20°C for 20 min. In MNs, the permeabilization was performed with PBS 0.4% Triton X-100 for 10 min. After 1 h of incubation at 37°C with the blocking solution in a pre-heated humidity chamber, cells were incubated overnight at 4°C with the specific primary antibodies. Afterward, we performed the PLA assay according to the manufacturer’s instructions (Duolink In Situ-Fluorescence, Sigma-Aldrich) and the coverslips were mounted with Duolink In Situ Mounting Medium with DAPI.
GFP-LC3 flow cytometry
SH-SY5Y and SH-SY5Y G4 GFP-LC3 stable cell lines were seeded on 35-mm plates and treated with Bafilomycin A1 for 4 h at 37°C. Cells were harvested by trypsinization and washed with PBS. 10 000 cells were counted by sample, and GFP intensity levels were analyzed with a Novocyte 3000 flow cytometer (ACEA).
Lysosomal pH analysis
To observe lysosomal alkalinization cells were seeded onto 25-mm glass coverslips, washed with PBS and loaded with 1 μm LysoSensor Green DND-189 for 30 min at 37°C. Cells were washed with PBS and immediately visualized with a confocal microscope.
CATHEPSIN B activity
Lysosomal function was analyzed by the CATHEPSIN B enzymatic activity. Cells were loaded with Magic Red™ CATHEPSIN B reagent for 45 min at 37°C and the fluorescence intensity of 10 000 cells per sample was measured by flow cytometry.
Subcellular fractionation (MAMs)
Subcellular fractions were obtained according to Annunziata and collaborators (52) with little modifications. Briefly, cells were resuspended in hypotonic buffer (250 mm sucrose, 20 mm HEPES pH 7.4, 10 mm KCl, 1.5 mm MgCl2, 1 mm EDTA, 1 mm EGTA, protease and phosphatase inhibitors) for 30 min on ice and then homogenized with a pestle and disrupted by passing through a 25 G and 30 G needles. Lysed cells were centrifuged at 750g for 10 min at 4°C to remove cell debris and nuclei. The supernatant was centrifuged at 10 000g for 20 min at 4°C: the pellet contained the mitochondrial fraction. The supernatant was again centrifuged at 100 000g for 1 h at 4°C in a Hitachi Ultracentrifuge CP80NX, rotor P40ST. This third supernatant was the cytosolic fraction, while the pellet contained the endoplasmic reticulum fraction. The mitochondrial pellet was resuspended in isolation medium (250 mm mannitol, 5 mm HEPES pH 7.4, 0.5 mm EGTA, 0.10% BSA), layered on top of a 30% Percoll gradient and centrifuged at 95 000g for 30 min at 4°C (P40ST Rotor). Two white bands were obtained: the upper band was collected, diluted with isolation medium and centrifuged at 6300g for 10 min at 4°C. The resulting supernatant was centrifuged at 100 000g for 1 h at 4°C. The pellet contained the MAMs fraction. The lower band was diluted with isolation medium and centrifuged at 6300g for 10 min at 4°C twice to remove the Percoll. The resulting pellet was collected as the pure mitochondrial fraction.
Lysosomal enriched fractions
Lysosomes were isolated using a lysosomal enrichment kit (Thermo Fisher Scientific). SH-SY5Y cells were seeded on 150-mm plates and lysed following the manufacturer’s instructions. The lysates were combined with OptiPrep to a final concentration of 15% and layered on top of a discontinuous density gradient with the following concentrations from top to bottom: 17, 20, 23, 27 and 30%. The tube was centrifuged for 2 h at 145 000g and the whole volume collected to determine the lysosome-containing fraction. The fractions were diluted with PBS, pelleted by centrifugation for 30 min at 18 000g and washed with the kit solution. The fractions were analyzed by SDS-Page and western blot.
Glutathione quantification (GSH assay)
Cells were seeded onto a 96-well plate and the measure of GSH cellular levels was performed with the GSH-Glo Glutathione Assay (Promega) following the manufacturer’s instructions. The total protein concentration of equitable wells was analyzed by BCA method to normalize the results of each well and eliminate the variations due to differences in the number of cells.
Image acquisition and processing
Super-resolution images were acquired with a Leica TCS SP8 X White Light Laser confocal microscope with Hybrid spectral detectors and HyVolution (Leica Microsystems, Wetzlar, Germany) using the Leica LAS X software (version 3.1.5). Image deconvolution was performed with Huygens Essential software v 4.4 0p6 (SVI, Leiden, The Netherlands). Image processing and analysis were implemented and performed using the software MATLAB R_2018a (The MathWorks Inc., Natick, MA, USA) and the Leica Application Suite X (LAS-X) software (Leica Microsystems, Wetzlar, Germany).
Mitochondria–lysosome contact sites in fixed cells
Coverslips were mounted in ProLong Antifade Kit (Life Technologies). Images were acquired using a HC x PL APO 100×/1.4 oil immersion objective, the HyD detector and HyVolution. Optimized emission detectors bandwidths were configured to avoid inter-channel crosstalk. The confocal pinhole was set to 0.5 Airy units. To study and detect contacts in three dimensions, Z stacks were acquired every 0.12 μm along with the cell thickness (n = 10 independent experiments). Appropriate negative controls were used to adjust confocal settings to avoid non-specific fluorescence artifacts. To compare the data, identical settings were used for image acquisition of different experiments. The distances between mitochondria–lysosome in each cell were measured by LAS-X and quantified as the distance of mass center mitochondria-lysosome. We analyzed the MCS-visual field (contact region/area) which is the visual field defined by the presence of 1 or more membrane contact sites. Organelle membrane contacts sites in confocal images are defined as an overlap of 3 or more contiguous pixels, in our case 1 pixel is equivalent to 29 nm (3 pixels are 87 nm). This definition may lead to an overestimate of contacts, as the distance between membranes at membrane contact sites studied by electron microscopy has generally been reported in the range of 15–30 nm. However, the maximum distance between membranes that allows for a functional interaction is unclear and maybe even greater than 100 nm owing to the long lengths of tethering proteins (53,54). Moreover, if physical links exist between two organelles, they might be transient and/or localized to limited membrane areas, so that vicinities might in part represent contacts undetected by electron microscopy (55). For these reasons, we defined four categories to obtain the maximum information: contact (≤80 nm), possible contact (80–150 nm), vicinity (150–300 nm) and far (>300 nm).
Mitochondria-lysosome contact sites in live cells
Time-lapsed multichannel (red and green) fluorescence microscopy was used to image living cells in a temperature-controlled chamber (37°C) at 5% CO2. The confocal pinhole was set to 1.5 Airy units. Images were captured using a HC x PL APO 100×/1.4 oil immersion objective with an acquisition period of 261 ms for 2 min. This resulted in a sequence of images stored as 16-bit grey scale images with a spatial resolution of 496 × 496 pixels and with a physical pixel size of 0.117 × 0.117 μm (Supplementary Material, Fig. S5, Supplementary Material, Movies S1 and S4).
A custom automatic image analysis method was developed to identify both mitochondria and lysosome vesicles and characterize their spatio-temporal colocalization patterns (Supplementary Material, Fig. S5). To enhance the structures before segmentation an image pre-processing routine was implemented including the following stages: (1) individual cells of interest were manually masked from the fields, (2) the contrast of mitochondrial and lysosome objects was enhanced using an intensity-based linear transformation saturating the bottom and the top 10% of all pixel values at each frame, (3) median filtering with a 3 × 3 pixels window provided a convenient way to further increase image quality by reducing noise while preserving edges. Subsequently, a segmentation algorithm based on Otsu’s method (which chooses the threshold to minimize the intraclass variance of the black and white pixels) was selected for the autonomous discrimination of the organelles from the background (Supplementary Material, Fig. S5A–G). Mitochondria–lysosome contacts were defined as an overlap of 3 or more pixels (consistent with the analysis in fixed cells) between segmented organelles. Contact area was defined as the mean percentage of the overlapping area of each colocalizing lysosome at each frame (Supplementary Material, Fig. S5H–J; Supplementary Material, Movies S2 and S5). The percentage of lysosomes in contacts was quantified as the mean percentage of lysosome vesicles that formed contacts with mitochondria divided by the total number of lysosome vesicles at each frame. For contact duration assessment, we generated a 2D + t structure from the colocalization segmentation at each frame. Duration time was then calculated as the average number of frames (each frame representing 261 ms) that an individual contact spans in time (Supplementary Material, Fig. S5K–M; Supplementary Material, Movies S3 and S6).
Mitochondrial network morphology
Images were captured using a HC × PL APO 100×/1.4 oil immersion objective. The confocal pinhole was set to 0.5 Airy units. The original data was stored as 16-bit grey scale images with a spatial resolution of 1024 × 1024 pixels. Pixel sizes ranged from 0.035 × 0.035 to 0.057 × 0.057 μm. Z-stacks were acquired in 0.16 μm z-increments from each cell.
Image pre-processing to assess mitochondrial network morphology involved: (1) manually masking of individual cells of interest from the fields, (2) contrast enhancement using an intensity-based linear transformation saturating the bottom 25% of all pixel values, (3) median filtering with a 5 × 5 pixels neighborhood. To accurately identify the mitochondrial structures, we applied a 2D segmentation algorithm at each layer of the Z-stack involving a Laplacian of Gaussian edge detector followed by a Moore-Neighbor algorithm. An iso-surface 3D (volumetric) model was generated by stacking the contiguous set of segmented slices. The segmentation technique was validated using a ground truth of the 3D mitochondrial network generated by an expert. Overall, this segmentation approach avoided erroneous fusions and provided better segmentation results than standard algorithms (Otsu’s segmentation, for instance, tripled false positive rate). A labeling algorithm was applied to identify each substructure (objects smaller than 100 pixels were excluded) (Supplementary Material, Fig. S6A–F). Furthermore, the resulting mitochondrial network volume was subsequently skeletonized using the standard process operations. This approach allowed 3D quantification of shape and topology biomarkers, namely, the number of mitochondrial structures (individuals/subnetworks) as wells as volume, length (rods + branches) and the number of branchpoints both for total network and single structures (Supplementary Material, Fig. S6G and H).
Colocalization analysis of GFP-LC3 and LAMP-1 vesicles
Images were captured using a HC × PL APO 63×/1.75 oil immersion objective. The confocal pinhole was set to 1.0 Airy units. The original data was stored as 8-bit grayscale images with a spatial resolution of 1024 × 1024 pixels and a pixel size of 0.103 × 0.103 μm. Z-stacks were acquired in 0.5 μm z-increments. Maximum-intensity projections of 3D image stacks of lysosomes (red channel—LAMP-1), GFP-LC3 (green channel—GFP) and nuclei (blue channel-DAPI) were calculated. A multi-stage approach was implemented to correct for spectral bleed-through artifacts (caused by the emission of DAPI fluorophore being detected in the through the filter combination reserved for the GFP). First, image segmentation (Otsu’s method) of the blue channel rendered a binary mask delimitating nuclei regions. The resulting mask was applied to the GFP channel to exclude those pixels outside the nuclei regions. Next, morphological opening (disk-shaped structuring element with a radius of 10) followed by 2D-gaussian filtering (sigma = 5) returned a background approximation image. Intensity values were then adjusted by saturating the bottom 10%-pixel values. The result obtained (inflated nuclei illumination) was finally substracted from the original image. The automatic identification of cell regions was achieved by applying an Otsu segmentation algorithm to the green channel. Background artifacts were subsequently filtered by a morphological opening operator that removed small objects with an area <10.6 μm2. The resulting binary mask (delimiting cells) was applied both to the red and green channels to exclude from the analysis the unsuccessfully co-transfected cells. A segmentation algorithm based on Otsu’s method was selected for the autonomous delimitation of vesicles (lysosomes and GFP-LC3 vesicles). Artifacts were removed if they had an area <0.0027 μm2. Mander’s overlapping coefficient (MOC) was used to assess the degree of colocalization (pixel co-occurrence) between the vesicle regions of the two channels. This index is more robust to background noise fluctuations than area overlap measures since it gives more relevance to pixels with higher intensities.
Statistics
Statistical analysis was performed using Excel (Microsoft Corporation, Redmond, WA), GraphPad Prism or R (3.5.1 version) with a minimum of three independent experiments. The specific test applied in each case is indicated in the figure legend. P values less than 0.05 were considered significant.
Study approval
Experimental procedures were performed following the European Union Council guidelines (2010/63/EU) and Spanish regulations (RD 1201/2005). Research protocols with experimental mouse models are reported in detail to the local Ethical Committee of Animal Experimentation (CEEA) of the University of Barcelona before experiments start, and further approval has been provided by the Government of Catalonia. The registration number is C-133/18 (10071) for Gdap1−/− mouse model. All efforts were made to minimize pain and distress.
Supplementary Material
Acknowledgements
All imaging acquirement was performed at the confocal microscopy unit of Sant Joan de Déu Children’s Hospital, as part of ‘Centre Daniel Bravo de Diagnòstic i Recerca en Malalties Minoritàries (CDB)’ and the Pediatric Institute of Rare Diseases (IPER). We thank the Pathology Department at Sant Joan de Déu Hospital for the preparation of tissue slices. We thank Dr Erwin Knecht for the GFP-LC3 plasmid and Dr Pascual Sanz for the EGFP-FYVEx2 plasmid.
Conflict of Interest Statement: None declared.
Funding
Spanish Ministry of Science, Innovation and Universities (SAF2015-66625-R); the Generalitat de Catalunya (2015 FEDER/S-21, 2017/SRG1308); and the Instituto de Salud Carlos III (CIBERER, ACCI 2019-16). L.C. is the recipient of a postdoctoral research contract from CIBERER; E.J.-E. is the recipient of a FPI PhD scholarship.
References
- 1. Rossor A.M., Tomaselli P.J. and Reilly M.M. (2016) Recent advances in the genetic neuropathies. Curr. Opin. Neurol., 29, 537–548. [DOI] [PMC free article] [PubMed] [Google Scholar]
- 2. Marco A., Cuesta A., Pedrola L., Palau F. and Marin I. (2004) Evolutionary and structural analyses of GDAP1, involved in Charcot-Marie-Tooth disease, characterize a novel class of glutathione transferase-related genes. Mol. Biol. Evol., 21, 176–187. [DOI] [PubMed] [Google Scholar]
- 3. Huber N., Bieniossek C., Wagner K.M., Elsasser H.P., Suter U., Berger I. and Niemann A. (2016) Glutathione-conjugating and membrane-remodeling activity of GDAP1 relies on amphipathic C-terminal domain. Sci. Rep., 6, 36930. [DOI] [PMC free article] [PubMed] [Google Scholar]
- 4. Baxter R.V., Ben Othmane K., Rochelle J.M., Stajich J.E., Hulette C., Dew-Knight S., Hentati F., Ben Hamida M., Bel S., Stenger J.E. et al. (2002) Ganglioside-induced differentiation-associated protein-1 is mutant in Charcot-Marie-Tooth disease type 4A/8q21. Nat. Genet., 30, 21–22. [DOI] [PubMed] [Google Scholar]
- 5. Cuesta A., Pedrola L., Sevilla T., Garcia-Planells J., Chumillas M.J., Mayordomo F., LeGuern E., Marin I., Vilchez J.J. and Palau F. (2002) The gene encoding ganglioside-induced differentiation-associated protein 1 is mutated in axonal Charcot-Marie-Tooth type 4A disease. Nat. Genet., 30, 22–25. [DOI] [PubMed] [Google Scholar]
- 6. Claramunt R., Pedrola L., Sevilla T., Lopez de Munain A., Berciano J., Cuesta A., Sanchez-Navarro B., Millan J.M., Saifi G.M., Lupski J.R. et al. (2005) Genetics of Charcot-Marie-Tooth disease type 4A: mutations, inheritance, phenotypic variability, and founder effect. J. Med. Genet., 42, 358–365. [DOI] [PMC free article] [PubMed] [Google Scholar]
- 7. Sivera R., Espinos C., Vilchez J.J., Mas F., Martinez-Rubio D., Chumillas M.J., Mayordomo F., Muelas N., Bataller L., Palau F. and Sevilla T. (2010) Phenotypical features of the p.R120W mutation in the GDAP1 gene causing autosomal dominant Charcot-Marie-Tooth disease. J. Peripher. Nerv. Syst., 15, 334–344. [DOI] [PubMed] [Google Scholar]
- 8. Zimon M., Baets J., Fabrizi G.M., Jaakkola E., Kabzinska D., Pilch J., Schindler A.B., Cornblath D.R., Fischbeck K.H., Auer-Grumbach M. et al. (2011) Dominant GDAP1 mutations cause predominantly mild CMT phenotypes. Neurology, 77, 540–548. [DOI] [PMC free article] [PubMed] [Google Scholar]
- 9. Sevilla T., Jaijo T., Nauffal D., Collado D., Chumillas M.J., Vilchez J.J., Muelas N., Bataller L., Domenech R., Espinos C. and Palau F. (2008) Vocal cord paresis and diaphragmatic dysfunction are severe and frequent symptoms of GDAP1-associated neuropathy. Brain, 131, 3051–3061. [DOI] [PubMed] [Google Scholar]
- 10. Sivera R., Frasquet M., Lupo V., Garcia-Sobrino T., Blanco-Arias P., Pardo J., Fernandez-Torron R., Munain A.L., Marquez-Infante C., Villarreal L. et al. (2017) Distribution and genotype-phenotype correlation of GDAP1 mutations in Spain. Sci. Rep., 7, 6677. [DOI] [PMC free article] [PubMed] [Google Scholar]
- 11. Pedrola L., Espert A., Wu X., Claramunt R., Shy M.E. and Palau F. (2005) GDAP1, the protein causing Charcot-Marie-Tooth disease type 4A, is expressed in neurons and is associated with mitochondria. Hum. Mol. Genet., 14, 1087–1094. [DOI] [PubMed] [Google Scholar]
- 12. Niemann A., Ruegg M., La Padula V., Schenone A. and Suter U. (2005) Ganglioside-induced differentiation associated protein 1 is a regulator of the mitochondrial network: new implications for Charcot-Marie-Tooth disease. J. Cell Biol., 170, 1067–1078. [DOI] [PMC free article] [PubMed] [Google Scholar]
- 13. Pedrola L., Espert A., Valdes-Sanchez T., Sanchez-Piris M., Sirkowski E.E., Scherer S.S., Farinas I. and Palau F. (2008) Cell expression of GDAP1 in the nervous system and pathogenesis of Charcot-Marie-Tooth type 4A disease. J. Cell. Mol. Med., 12, 679–689. [DOI] [PMC free article] [PubMed] [Google Scholar]
- 14. Barneo-Muñoz M., Juárez P., Civera-Tregón A., Yndriago L., Pla-Martin D., Zenker J., Cuevas-Martín C., Estela A., Sánchez-Aragó M., Forteza-Vila J. et al. (2015) Lack of GDAP1 induces neuronal calcium and mitochondrial defects in a knockout mouse model of Charcot-Marie-Tooth neuropathy. PLoS Genet., 11, e1005115. [DOI] [PMC free article] [PubMed] [Google Scholar]
- 15. Pla-Martin D., Rueda C.B., Estela A., Sanchez-Piris M., Gonzalez-Sanchez P., Traba J., Fuente S., Scorrano L., Renau-Piqueras J., Alvarez J. et al. (2013) Silencing of the Charcot-Marie-Tooth disease-associated gene GDAP1 induces abnormal mitochondrial distribution and affects Ca2+ homeostasis by reducing store-operated Ca2+ entry. Neurobiol. Dis., 55, 140–151. [DOI] [PubMed] [Google Scholar]
- 16. Niemann A., Huber N., Wagner K.M., Somandin C., Horn M., Lebrun-Julien F., Angst B., Pereira J.A., Halfter H., Welzl H. et al. (2014) The Gdap1 knockout mouse mechanistically links redox control to Charcot-Marie-Tooth disease. Brain, 137, 668–682. [DOI] [PMC free article] [PubMed] [Google Scholar]
- 17. Cassereau J., Chevrollier A., Codron P., Goizet C., Gueguen N., Verny C., Reynier P., Bonneau D., Lenaers G. and Procaccio V. (2020) Oxidative stress contributes differentially to the pathophysiology of Charcot-Marie-Tooth disease type 2K. Exp. Neurol., 323, 113069. [DOI] [PubMed] [Google Scholar]
- 18. Noack R., Frede S., Albrecht P., Henke N., Pfeiffer A., Knoll K., Dehmel T., Meyer Zu Horste G., Stettner M., Kieseier B.C. et al. (2012) Charcot-Marie-Tooth disease CMT4A: GDAP1 increases cellular glutathione and the mitochondrial membrane potential. Hum. Mol. Genet., 21, 150–162. [DOI] [PubMed] [Google Scholar]
- 19. Schafer F.Q. and Buettner G.R. (2001) Redox environment of the cell as viewed through the redox state of the glutathione disulfide/glutathione couple. Free Radic. Biol. Med., 30, 1191–1212. [DOI] [PubMed] [Google Scholar]
- 20. Fernandez-Lizarbe S., Civera-Tregon A., Cantarero L., Herrer I., Juarez P., Hoenicka J. and Palau F. (2019) Neuroinflammation in the pathogenesis of axonal Charcot-Marie-Tooth disease caused by lack of GDAP1. Exp. Neurol., 320, 113004. [DOI] [PubMed] [Google Scholar]
- 21. Prinz W.A., Toulmay A. and Balla T. (2020) The functional universe of membrane contact sites. Nat. Rev. Mol. Cell Biol., 21, 7–24. [DOI] [PMC free article] [PubMed] [Google Scholar]
- 22. Lackner L.L. (2019) The expanding and unexpected functions of mitochondria contact sites. Trends Cell Biol., 29, 580–590. [DOI] [PMC free article] [PubMed] [Google Scholar]
- 23. Wong Y.C., Ysselstein D. and Krainc D. (2018) Mitochondria-lysosome contacts regulate mitochondrial fission via RAB7 GTP hydrolysis. Nature, 554, 382–386. [DOI] [PMC free article] [PubMed] [Google Scholar]
- 24. Klionsky D.J. (2016) Stepping back from the guidelines: where do we stand? Autophagy, 12, 223–224. [DOI] [PMC free article] [PubMed] [Google Scholar]
- 25. Itakura E. and Mizushima N. (2013) Syntaxin 17: the autophagosomal SNARE. Autophagy, 9, 917–919. [DOI] [PMC free article] [PubMed] [Google Scholar]
- 26. Schaaf M.B., Keulers T.G., Vooijs M.A. and Rouschop K.M. (2016) LC3/GABARAP family proteins: autophagy-(un)related functions. FASEB J., 30, 3961–3978. [DOI] [PubMed] [Google Scholar]
- 27. Zhao Y.G. and Zhang H. (2018) Autophagosome maturation: an epic journey from the ER to lysosomes. J. Cell Biol., 218, 757–770. [DOI] [PMC free article] [PubMed] [Google Scholar]
- 28. Hamasaki M., Furuta N., Matsuda A., Nezu A., Yamamoto A., Fujita N., Oomori H., Noda T., Haraguchi T., Hiraoka Y. et al. (2013) Autophagosomes form at ER-mitochondria contact sites. Nature, 495, 389–393. [DOI] [PubMed] [Google Scholar]
- 29. Maruyama T. and Noda N.N. (2018) Autophagy-regulating protease Atg4: structure, function, regulation and inhibition. J. Antibiot., 71, 72–78. [DOI] [PMC free article] [PubMed] [Google Scholar]
- 30. Kjos I., Borg Distefano M., Saetre F., Repnik U., Holland P., Jones A.T., Engedal N., Simonsen A., Bakke O. and Progida C. (2017) Rab7b modulates autophagic flux by interacting with Atg4B. EMBO Rep., 18, 1727–1739. [DOI] [PMC free article] [PubMed] [Google Scholar]
- 31. Scherz-Shouval R., Shvets E., Fass E., Shorer H., Gil L. and Elazar Z. (2007) Reactive oxygen species are essential for autophagy and specifically regulate the activity of Atg4. EMBO J., 26, 1749–1760. [DOI] [PMC free article] [PubMed] [Google Scholar]
- 32. Burman C. and Ktistakis N.T. (2010) Regulation of autophagy by phosphatidylinositol 3-phosphate. FEBS Lett., 584, 1302–1312. [DOI] [PubMed] [Google Scholar]
- 33. Sbrissa D., Ikonomov O.C. and Shisheva A. (1999) PIKfyve, a mammalian ortholog of yeast Fab1p lipid kinase, synthesizes 5-phosphoinositides. Effect of insulin. J. Biol. Chem., 274, 21589–21597. [DOI] [PubMed] [Google Scholar]
- 34. Tsuruta F. and Dolmetsch R.E. (2015) PIKfyve mediates the motility of late endosomes and lysosomes in neuronal dendrites. Neurosci. Lett., 605, 18–23. [DOI] [PubMed] [Google Scholar]
- 35. Cortes C.J. and La Spada A.R. (2019) TFEB dysregulation as a driver of autophagy dysfunction in neurodegenerative disease: molecular mechanisms, cellular processes, and emerging therapeutic opportunities. Neurobiology, 122, 83–93. [DOI] [PMC free article] [PubMed] [Google Scholar]
- 36. Martini-Stoica H., Xu Y., Ballabio A. and Zheng H. (2016) The autophagy-lysosomal pathway in neurodegeneration: a TFEB perspective. Trends Neurosci., 39, 221–234. [DOI] [PMC free article] [PubMed] [Google Scholar]
- 37. Napolitano G. and Ballabio A. (2016) TFEB at a glance. J. Cell Sci., 129, 2475–2481. [DOI] [PMC free article] [PubMed] [Google Scholar]
- 38. Choy C.H., Saffi G., Gray M.A., Wallace C., Dayam R.M., Ou Z.A., Lenk G., Puertollano R., Watkins S.C. and Botelho R.J. (2018) Lysosome enlargement during inhibition of the lipid kinase PIKfyve proceeds through lysosome coalescence. J. Cell Sci., 131, jcs213587. [DOI] [PMC free article] [PubMed] [Google Scholar]
- 39. Chen Y. and Yu L. (2018) Recent progress in autophagic lysosome reformation. Traffic, 18, 358–361. [DOI] [PubMed] [Google Scholar]
- 40. Bissig C., Hurbain I., Raposo G. and Niel G. (2017) PIKfyve activity regulates reformation of terminal storage lysosomes from endolysosomes. Traffic, 18, 747–757. [DOI] [PubMed] [Google Scholar]
- 41. Gonzalez-Sanchez P., Pla-Martin D., Martinez-Valero P., Rueda C.B., Calpena E., Del Arco A., Palau F. and Satrustegui J. (2017) CMT-linked loss-of-function mutations in GDAP1 impair store-operated Ca(2+) entry-stimulated respiration. Sci. Rep., 7, 42993. [DOI] [PMC free article] [PubMed] [Google Scholar]
- 42. Gonzalez-Sanchez P., Satrustegui J., Palau F. and Del Arco A. (2019) Calcium deregulation and mitochondrial bioenergetics in GDAP1-related CMT disease. Int. J. Mol. Sci., 20, 403. [DOI] [PMC free article] [PubMed] [Google Scholar]
- 43. Demers-Lamarche J., Guillebaud G., Tlili M., Todkar K., Belanger N., Grondin M., Nguyen A.P., Michel J. and Germain M. (2016) Loss of mitochondrial function impairs lysosomes. J. Mol. Biol., 291, 10263–10276. [DOI] [PMC free article] [PubMed] [Google Scholar]
- 44. Gayle S., Landrette S., Beeharry N., Conrad C., Hernandez M., Beckett P., Ferguson S.M., Mandelkern T., Zheng M., Xu T. et al. (2017) Identification of apilimod as a first-in-class PIKfyve kinase inhibitor for treatment of B-cell non-Hodgkin lymphoma. Blood, 129, 1768–1778. [DOI] [PMC free article] [PubMed] [Google Scholar]
- 45. Ballatori N., Krance S.M., Notenboom S., Shi S., Tieu K. and Hammond C.L. (2009) Glutathione dysregulation and the etiology and progression of human diseases. Biol. Chem., 390, 191–214. [DOI] [PMC free article] [PubMed] [Google Scholar]
- 46. Smith G.A., Lin T.H., Sheehan A.E., Van der Goes van Naters W., Neukomm L.J., Graves H.K., Bis-Brewer D.M., Zuchner S. and Freeman M.R. (2019) Glutathione S-transferase regulates mitochondrial populations in axons through increased glutathione oxidation. Neuron, 103, 52–65 e56. [DOI] [PMC free article] [PubMed] [Google Scholar]
- 47. Googins M.R., Woghiren-Afegbua A.O., Calderon M., St Croix C.M., Kiselyov K.I. and VanDemark A.P. (2020) Structural and functional divergence of GDAP1 from the glutathione S-transferase superfamily. FASEB J., 34, 7192–7207. [DOI] [PMC free article] [PubMed] [Google Scholar]
- 48. Shield A.J., Murray T.P. and Board P.G. (2006) Functional characterisation of ganglioside-induced differentiation-associated protein 1 as a glutathione transferase. Biochem. Biophys. Res. Commun., 347, 859–866. [DOI] [PubMed] [Google Scholar]
- 49. Scorrano L., De Matteis M.A., Emr S., Giordano F., Hajnoczky G., Kornmann B., Lackner L.L., Levine T.P., Pellegrini L., Reinisch K. et al. (2019) Coming together to define membrane contact sites. Nat. Commun., 10, 1287. [DOI] [PMC free article] [PubMed] [Google Scholar]
- 50. Haidar M. and Timmerman V. (2017) Autophagy as an emerging common pathomechanism in inherited peripheral neuropathies. Front. Mol. Neurosci., 10, 143. [DOI] [PMC free article] [PubMed] [Google Scholar]
- 51. Voliani V., Gonzalez-Bejar M., Herranz-Perez V., Duran-Moreno M., Signore G., Garcia-Verdugo J.M. and Perez-Prieto J. (2013) Orthogonal functionalisation of upconverting NaYF4 nanocrystals. Chemistry, 19, 13538–13546. [DOI] [PubMed] [Google Scholar]
- 52. Annunziata I., Patterson A. and d'Azzo A. (2013) Mitochondria-associated ER membranes (MAMs) and glycosphingolipid enriched microdomains (GEMs): isolation from mouse brain. J. Vis. Exp. 73, e50215. [DOI] [PMC free article] [PubMed] [Google Scholar]
- 53. Gatta A.T. and Levine T.P. (2016) Piecing together the patchwork of contact sites. Trends Cell Biol., 27, 214–229. [DOI] [PubMed] [Google Scholar]
- 54. Valm A.M., Cohen S., Legant W.R., Melunis J., Hershberg U., Wait E., Cohen A.R., Davidson M.W., Betzig E. and Lippincott-Schwartz J. (2017) Applying systems-level spectral imaging and analysis to reveal the organelle interactome. Nature, 546, 162–167. [DOI] [PMC free article] [PubMed] [Google Scholar]
- 55. Daniele T., Hurbain I., Vago R., Casari G., Raposo G., Tacchetti C. and Schiaffino M.V. (2014) Mitochondria and melanosomes establish physical contacts modulated by Mfn2 and involved in organelle biogenesis. Curr. Biol., 24, 393–403. [DOI] [PubMed] [Google Scholar]
Associated Data
This section collects any data citations, data availability statements, or supplementary materials included in this article.