Abstract
This study uses national survey data to describe overall and regional trends in adherence to protective behaviors (mask wearing, physical distancing, staying at home, others) among US adults during the COVID-19 pandemic from April to November 2020.
Nonpharmaceutical interventions (NPIs) have been used to mitigate the effects of the coronavirus disease 2019 (COVID-19) pandemic. Reports describe an increasing attitude of apathy or resistance toward adherence to NPIs, termed pandemic fatigue.1 To better describe this phenomenon in the US, we used national surveillance data to analyze reporting of adherence to protective behaviors identified as NPIs.
Methods
We analyzed survey responses from 16 waves of the Coronavirus Tracking Survey (CTS) completed between April 1, 2020, and November 24, 2020. CTS participants are recruited from the Understanding America Study (UAS), an ongoing panel of US residents from marketing data on all household addresses conducted by the University of Southern California Center for Economic and Social Research. Households without access to the internet are provided internet-connected tablets, with responses weighted for national representativeness.2 CTS respondents consented to participation via the UAS website. Data collection was approved by the University of Southern California Institutional Review Board.
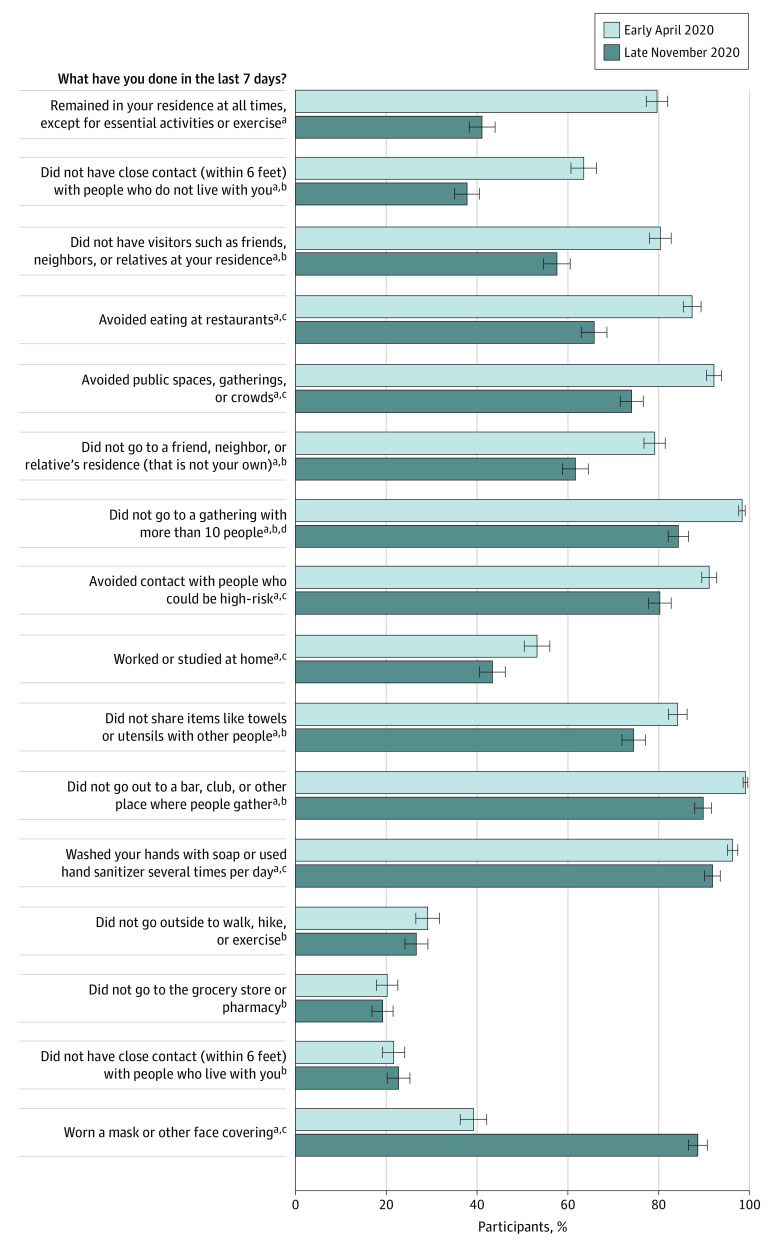
Every 14 days, each participant was asked to complete a wave of the CTS within the next 14 days. We constructed an NPI adherence index from 16 evidence-based protective behaviors that were included in all survey waves and susceptible to pandemic fatigue (Supplement).1 The index sums the number of behaviors reported in the week prior to survey completion (Figure 1), ranging from to 0 to 100; higher scores indicate better adherence.
Figure 1. Adherence to Protective Behaviors in the US During the Coronavirus Disease 2019 Pandemic Among 7705 Adults, April-November 2020.
Weighted and adjusted percentages of Coronavirus Tracking Survey (CTS) participants reporting adherence to protective behaviors are reported. Behaviors are ordered from greatest decrease to greatest increase across the study period. Error bars indicate 95% CIs.
aStatistically significant difference between results in late November and early April (P < .001).
bQuestion language in CTS assesses a risky behavior and has been negated in study to represent a protective behavior (eg, reportedly went to a gathering with 10 or more people is framed as not having reported such behavior).
cQuestion language in CTS prompted “Which of the following have you done in the last seven days to keep yourself safe from coronavirus? Only consider actions that you took or decisions that you made personally.”
dQuestion language in CTS includes examples of gatherings, such as a reunion, wedding, funeral, birthday party, concert, or religious service.
We report the index by week of survey completion and percentage of participants who were adherent to each behavior. Responses were adjusted for sociodemographic factors of the survey week, age, sex, race/ethnicity, education, household income, and 7-day mean of daily new COVID-19 cases in the respondent’s state on the survey date.3 Weighted linear regression (for the NPI adherence index) and logistic regression (for behaviors) based on predictive margins were performed. A robust sandwich estimator was used to allow arbitrary correlations within participating households. We performed t and z tests to determine significant differences between adherence in the first and final survey weeks, defined as 2-sided P < .05. Analyses were conducted in Stata, version 14.0 (StataCorp).
Results
Ninety-two percent of UAS panelists consented to participation in the CTS; 97% of participants completed the first wave of the survey and 80% completed the last wave. The analysis involved 7705 participants.
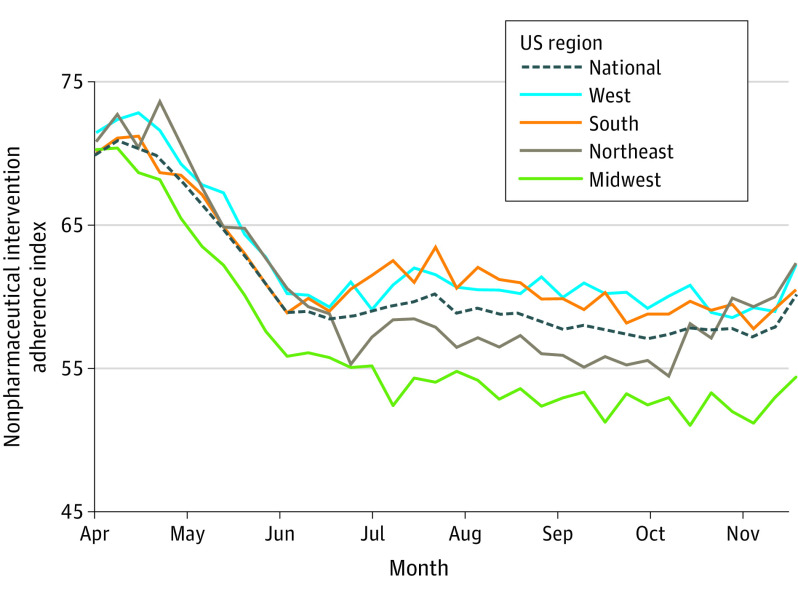
The national NPI adherence index decreased substantially from 70.0 in early April, reaching a plateau in the high 50s in June (Figure 2). In late November, an increase to 60.1 in the final survey week remained significantly below the starting level in early April (P < .001). All US Census regions experienced decreases in the NPI adherence index from early April to late November, from 70.0 to 60.5 in the South, 71.5 to 62.2 in the West, 70.8 to 62.4 in the Northeast, and 70.3 to 54.4 in the Midwest (all P < .001). The NPI adherence index in the final survey week was significantly lower in the Midwest than in the South (P = .003), West (P < .001), and Northeast (P = .001).
Figure 2. Adherence to Protective Nonpharmaceutical Interventions (NPIs) in the US During the Coronavirus Disease 2019 (COVID-19) Pandemic, April-November 2020.
The NPI adherence index ranges from 0 to 100. This index is the sum of reported adherence to 16 protective behaviors in the 7 days prior to survey completion. A higher score indicates better adherence. Mean values weighted for representativeness and adjusted by linear regression for sociodemographics and new COVID-19 cases are shown.
Reported protective behaviors that had the largest decreases in weighted and adjusted adherence from early April to late November 2020 were remaining in residence except for essential activities or exercise (from 79.6% [95% CI, 77.2%-81.9%] to 41.1% [95% CI, 38.2%-44.0%]), having no close contact with non–household members (from 63.5% [95% CI, 60.7%-66.3%] to 37.8% [95% CI, 35.1%-40.5%]), not having visitors over (from 80.3% [95% CI, 77.9%-82.7%] to 57.6% [95% CI, 54.6%-60.5%]), and avoiding eating at restaurants (from 87.3% [95% CI, 85.4%-89.3%] to 65.8% [95% CI, 63.0%-68.6%]) (all P < .001) (Figure 1). Reported wearing of a mask or other face covering showed a significant increase among participants (from 39.2% [95% CI, 36.3%-42.1%] to 88.6% [95% CI, 86.6%-90.6%]) (P < .001).
Discussion
This study found a decrease in reported adherence to NPIs overall and to most individual NPIs during the pandemic, irrespective of geography. The increase in reported mask wearing aligns with other national surveys of self-reported mask use and may reflect improved public health messaging.4
Strategic approaches to combating pandemic fatigue have been proposed, such as precision in government mandates and consistent communication from authorities.1,5 Additional research is necessary to understand the differential effect of NPIs in reducing COVID-19 transmission and to inform where policy interventions and public health messaging may be most effective.6 Study limitations include a reliance on self-reported behaviors, which may not reflect actual behaviors, as well as the use of an adherence index that has not been validated.
Section Editor: Jody W. Zylke, MD, Deputy Editor.
eMethods. Methodology for CTS Analysis
eTable. Items Excluded from CTS Survey Questions CR015 and CR016
References
- 1.Pandemic Fatigue: Reinvigorating the Public to Prevent COVID-19. World Health Organization; 2020. Accessed December 23, 2020. https://apps.who.int/iris/bitstream/handle/10665/335820/WHO-EURO-2020-1160-40906-55390-eng.pdf
- 2.Welcome to the Understanding America Study. University of South California. Accessed December 23, 2020. https://uasdata.usc.edu/index.php
- 3.Dong E, Du H, Gardner L. An interactive web-based dashboard to track COVID-19 in real time. Lancet Infect Dis. 2020;20(5):533-534. doi: 10.1016/S1473-3099(20)30120-1 [DOI] [PMC free article] [PubMed] [Google Scholar]
- 4.Hutchins HJ, Wolff B, Leeb R, et al. COVID-19 mitigation behaviors by age group—United States, April-June 2020. MMWR Morb Mortal Wkly Rep. 2020;69(43):1584-1590. doi: 10.15585/mmwr.mm6943e4 [DOI] [PMC free article] [PubMed] [Google Scholar]
- 5.Encouraging Adoption of Protective Behaviors to Mitigate the Spread of COVID-19: Strategies for Behavior Change. National Academies of Sciences, Engineering, and Medicine; 2020. [Google Scholar]
- 6.Fisher KA, Tenforde MW, Feldstein LR, et al. ; IVY Network Investigators; CDC COVID-19 Response Team . Community and close contact exposures associated with COVID-19 among symptomatic adults ≥18 years in 11 outpatient health care facilities—United States, July 2020. MMWR Morb Mortal Wkly Rep. 2020;69(36):1258-1264. doi: 10.15585/mmwr.mm6936a5 [DOI] [PMC free article] [PubMed] [Google Scholar]
Associated Data
This section collects any data citations, data availability statements, or supplementary materials included in this article.
Supplementary Materials
eMethods. Methodology for CTS Analysis
eTable. Items Excluded from CTS Survey Questions CR015 and CR016


