Figure 5.
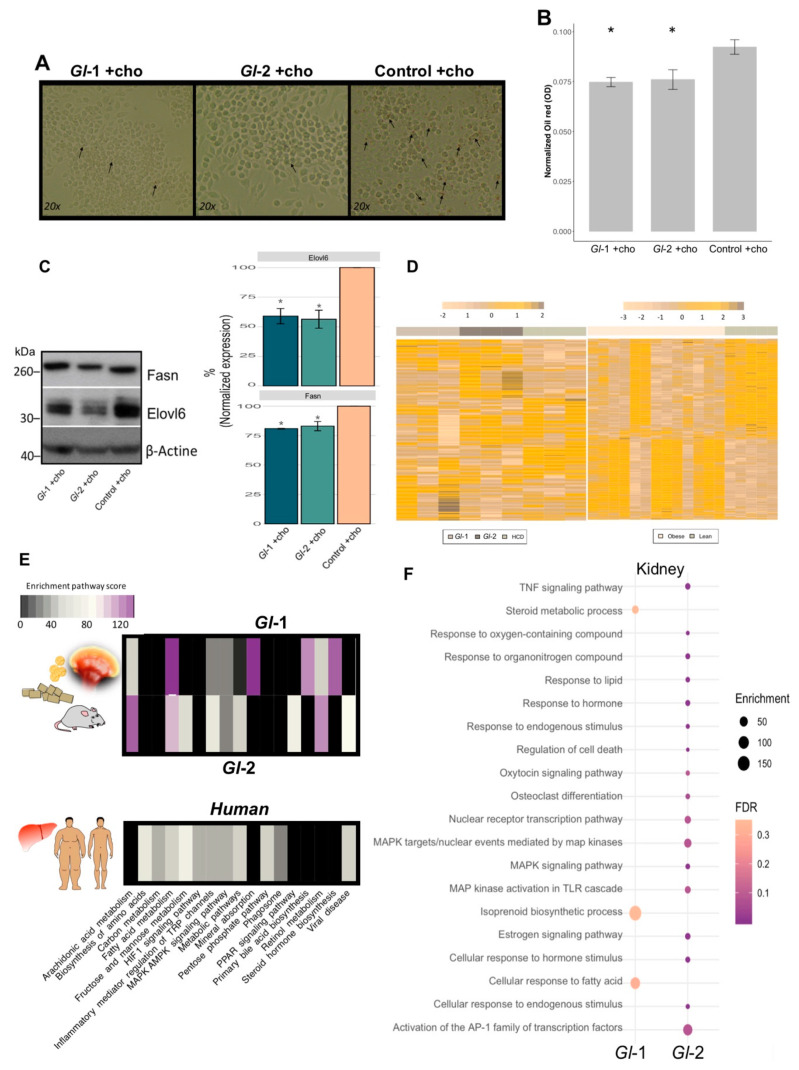
Ganoderma lucidum extracts (Gl-1, Gl-2) modulate the transcriptional landscape of hepatic-like macrophages and kidney tissue, as well as the common mouse-human metabolic process. (A) Oil red O staining of RAW 264.7 macrophages grown in high cholesterol conditions, after the intervention with Gl-1 and Gl-2 extracts, in comparison with the untreated control (vehicle). Zoom images obtained at 20x. Arrows indicate lipid accumulation. (B) Absorbance quantification of oil red O staining normalized by sulforhodamine B (SRB) absorbance levels of each experimental condition. Contrast: Absorbance of Gl-1 or Gl-2 extracts vs Control, * p < 0.05. (C) Western blot for Fasn and Elovl6 in RAW 264.7 macrophage-like cell line treated with Gl extracts (Gl-1, Gl-2), as well as the untreated control (vehicle), under high cholesterol concentrations. Representative blot from two independent experiments. Bar plot described the results of two independent experiments with three technical replicates represented as the mean +/− standard deviation error. * p < 0.05 (D) Comparative transcriptional landscape of homologous human and mouse genes modulated by both Gl-1 and Gl-2 extracts in liver tissue of C57BL/6 mice, under a high-cholesterol diet (HCD), in comparison with differentially expressed genes in liver tissue of obese versus lean patients. (E) Enriched pathways shared between hepatic genes modulated by Gl extracts (Gl-1, Gl-2) in mice, and altered hepatic genes in obese versus lean patients. (F) Bubble plot showing the pathway enrichment analysis of differentially expressed renal genes of C57BL/6 mice fed with a HCD, and treated with Gl-1 and Gl-2 extracts. The bubble size represents the enrichment score, while the bubble color indicates FDR values. Ch: cholesterol.

